Meet the Grafana Labs team: Simon Crute, a support engineer for Grafana Cloud and EnterpriseGrafana CloudGrafana EnterpriseTeam
Now GA: Cortex blocks storage for running Prometheus at scale with reduced operational complexityMimir
The new Wavefront Enterprise plugin brings the high-scale, high-speed SaaS to your Grafana dashboardsGrafana EnterpriseGrafanaPlugins
New features in the ServiceNow plugin for Grafana: table query, annotations, and more!Grafana EnterpriseGrafanaPluginsGrafana Cloud
Explore what's next in agentic operations: Introducing AI WeekWe're excited to show you what's new in AI for observability and observability for AI—and for you to get hands on with all the latest AI tools during our first ever AI Week.AI
Grafana Labs named a Leader again in the 2026 Gartner® Magic Quadrant™ for Observability PlatformsObservabilityGrafana Cloud
Grafana 13.1 release: observability as code updates, extending Grafana Assistant across more data sources, and moreGrafanaRelease
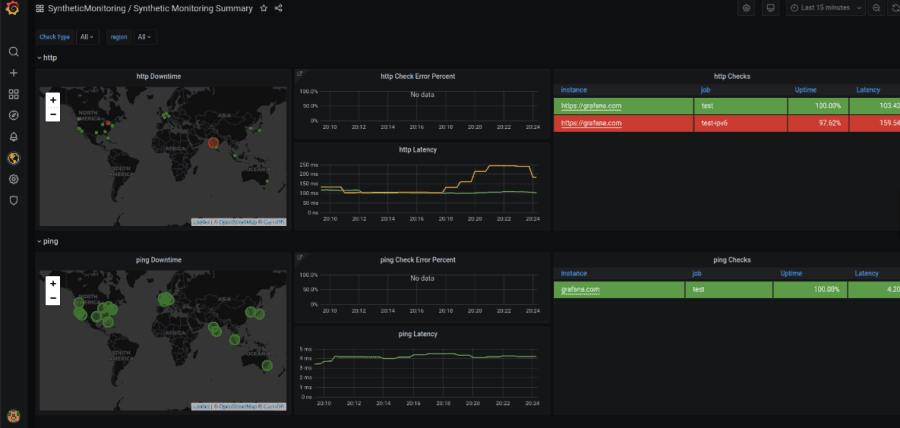
Cost attribution in Grafana Cloud: Manage spend across observability and testing workflows Grafana CloudCost managementSynthetic monitoringPerformance Testing
Stop switching tools to find answers: Grafana Assistant now works across 30+ data sourcesAIGrafanaIntegrations
'Grafana's Big Tent' podcast: Anthropic on agentic coding, observability, and the future of software engineeringPodcastsAIObservability