Introducing Grafana Metrics Enterprise, a Prometheus-as-a-service solution for enterprise scalePrometheusGrafana Enterprise Metrics
How we’re making it easier to use the Loki logging system with AWS Lambda and other short-lived servicesGrafanaLoki
Meet the Grafana Labs team: Suraj Nath, a software engineer working on Grafana CloudGrafana CloudTeam
All the non-technical advantages of Loki: reduce costs, streamline operations, build better teamsLoki
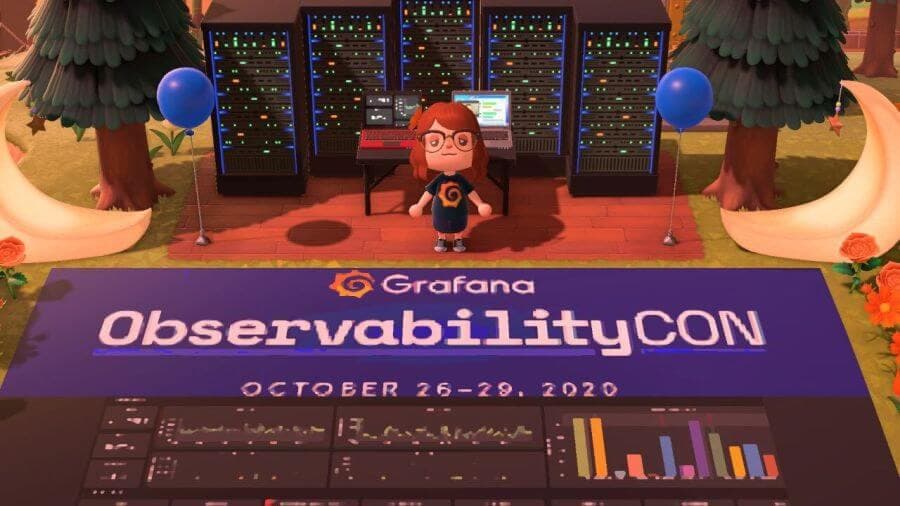
Interested in Grafana, Prometheus, Loki, and more? The first-ever Grafana ObservabilityCON is coming October 26-29EventsGrafanaLokiPrometheus
Meet the Grafana Labs team: Heds Simons, a Grafana, Loki, and Prometheus power user turned solutions engineerTeam
Identify anomalies, outlier detection, forecasting: How Grafana Cloud uses AI to make observability easierExplore how Grafana Cloud uses AI to help you spot anomalies earlier, explore your data through natural language, and find root causes faster.AIGrafana Cloud
Grafana Labs named a Leader again in the 2026 Gartner® Magic Quadrant™ for Observability PlatformsObservabilityGrafana Cloud
Knowledge Graph as context for LLMs: demonstrating decisive RCA and faster production performanceGrafana CloudAI
Digital Experience Monitoring with Grafana Cloud: Session Replay, synthetic checks, and faster investigationsSynthetic monitoringFrontend observabilityGrafana Cloud Frontend ObservabilityGrafana Cloud
Custom labels in Grafana Cloud Synthetic Monitoring: New updates for consistency and ease-of-useSynthetic monitoringGrafana Cloud
Identify anomalies, outlier detection, forecasting: How Grafana Cloud uses AI to make observability easierAIGrafana Cloud
Knowledge Graph as context for LLMs: demonstrating decisive RCA and faster production performanceGrafana CloudAI

%3Aquality(90)%2F&w=3840&q=75)
%3Aquality(90)%2F&w=3840&q=75)

%3Aquality(90)%2F&w=3840&q=75)
%3Aquality(90)%2F&w=3840&q=75)
%3Aquality(90)%2F&w=3840&q=75)
%3Aquality(90)%2F&w=3840&q=75)
%3Aquality(90)%2F&w=3840&q=75)

%3Aquality(90)%2F&w=3840&q=75)
%3Aquality(90)%2F&w=3840&q=75)
%3Aquality(90)%2F&w=3840&q=75)


%3Aquality(90)%2F&w=3840&q=75)
%3Aquality(90)%2F&w=3840&q=75)

%3Aquality(90)%2F&w=3840&q=75)
%3Aquality(90)%2F&w=3840&q=75)


%3Aquality(90)%2F&w=3840&q=75)
%3Aquality(90)%2F&w=3840&q=75)
%3Aquality(90)%2F&w=3840&q=75)

