The latest in Kubernetes Monitoring: new features to track persistent storage, simplify alerting, and moreKubernetes MonitoringGrafana Cloud
The Golden Grot Awards need you: Vote for your favorite dashboard today!Golden GrotsCommunityGrafanaConGrafana
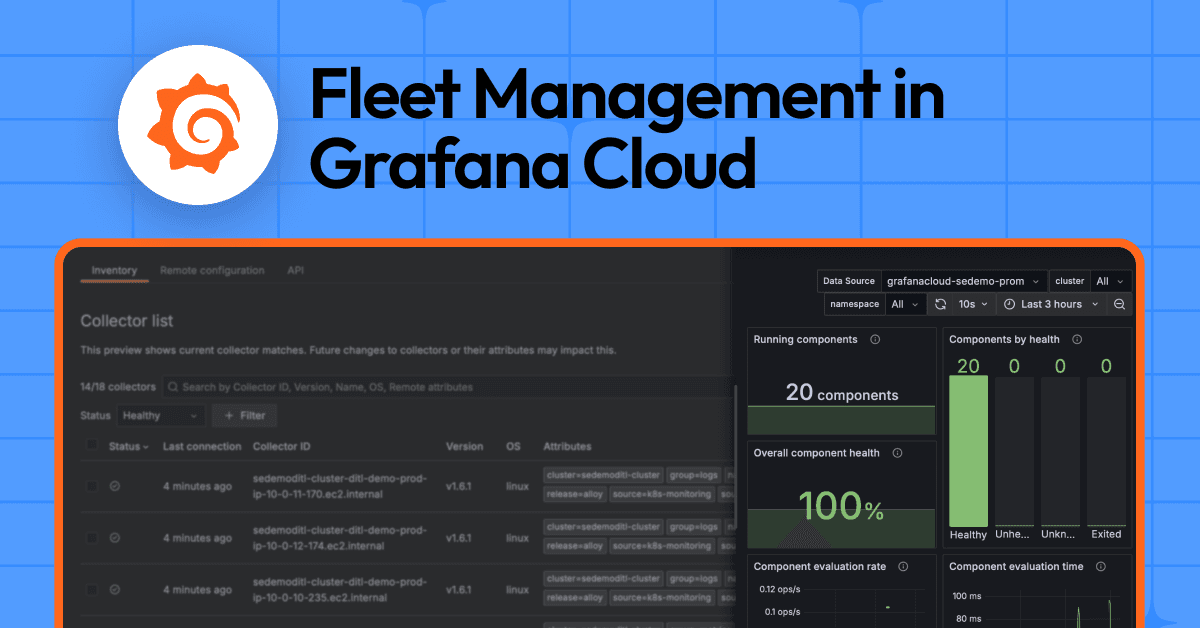
Telemetry pipeline management at any scale: Fleet Management in Grafana Cloud is generally availableGrafana AlloyGrafana Cloud
How LATAM Airlines uses Grafana Cloud for real-time observability that improves customers’ experiencesObservabilityGrafana CloudGrafana SLO
Visualize Google Sheets data: how to turn your spreadsheets into Grafana dashboardsPluginsVisualizationGrafana
How to monitor your Shopify store with Grafana Cloud Frontend ObservabilityFrontend observabilityReal user monitoring (RUM)
Monitor Microsoft Azure in Grafana Cloud: simplify and centralize your cloud provider observabilityCloud Provider Observability
Data sources, visualizations, and apps: A guide to extending and customizing GrafanaPluginsVisualizationGrafana
Grafana Loki 101: How to ingest logs with Alloy or the OpenTelemetry CollectorLokiPrometheusGrafana AlloyVideo
Grafana Drilldown apps: the improved queryless experience formerly known as the Explore appsDrilldown
Cost attribution in Grafana Cloud: Manage spend across observability and testing workflows Grafana CloudCost managementSynthetic monitoringPerformance Testing
Stop switching tools to find answers: Grafana Assistant now works across 30+ data sourcesAIGrafanaIntegrations
'Grafana's Big Tent' podcast: Anthropic on agentic coding, observability, and the future of software engineeringPodcastsAIObservability
Grafana Labs named a Leader again in the 2026 Gartner® Magic Quadrant™ for Observability PlatformsGrafana Labs has been recognized as a Leader in the 2026 Gartner® Magic Quadrant™ for Observability Platforms for the third consecutive year.ObservabilityGrafana Cloud
Grafana 13.1 release: observability as code updates, extending Grafana Assistant across more data sources, and moreGrafanaRelease