Metrics, logs, and literature: Inside The National Library of the Netherlands’ observability stackGrafanaMimirLokiGrafanaCon
Why companies choose Grafana Cloud over self-hosted OSS stacksGrafana CloudAdaptive MetricsGrafana Cloud Profiles
Grafana Cloud updates: k6 browser checks in Synthetic Monitoring, an easier way to share dashboards, and moreGrafana CloudSynthetic monitoring
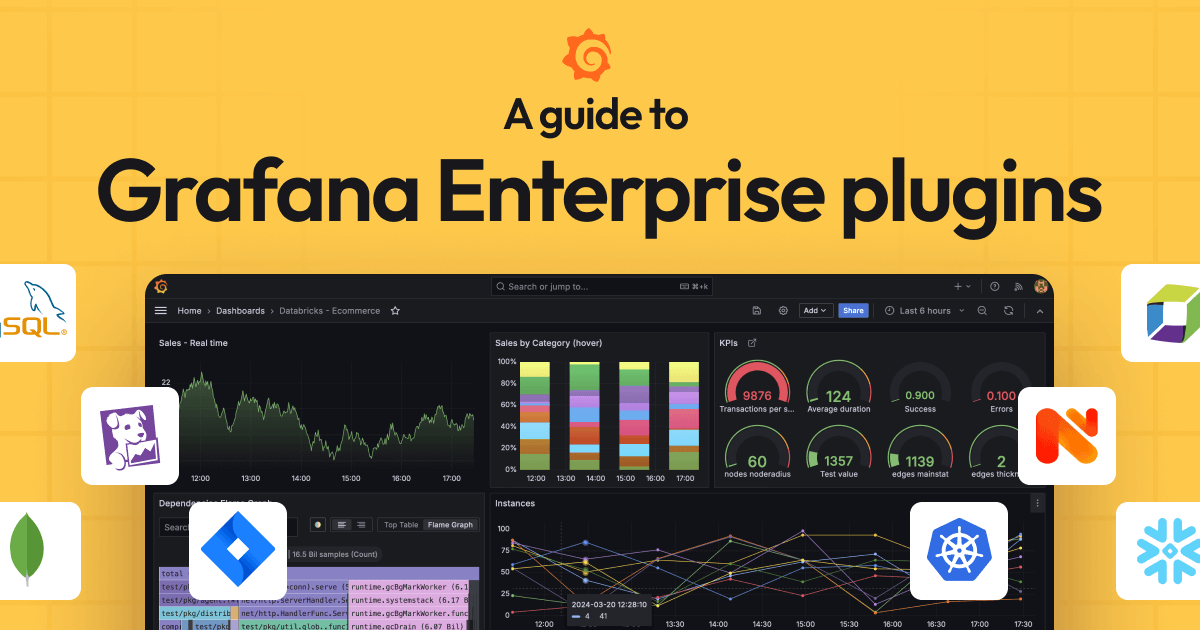
Visualize Atlassian Statuspage, Cloudflare, and Netlify data: what’s new in Grafana Enterprise data source pluginsPluginsGrafana CloudGrafana Enterprise
Grafana Cloud updates: The Explore apps suite for queryless data analysis, Adaptive Logs for cost optimization, and moreGrafana CloudDrilldown
Grafana Cloud updates: new data visualization options, enhancements to Grafana Cloud k6, and moreGrafana CloudGrafana Cloud k6
Grafana Cloud updates: Kubernetes Monitoring enhancements, browser tests in Grafana Cloud k6, and moreGrafana Cloud
Grafana Cloud updates: new visualization options, performance test analysis, Grafana Alerting improvements, and moreGrafana Cloud
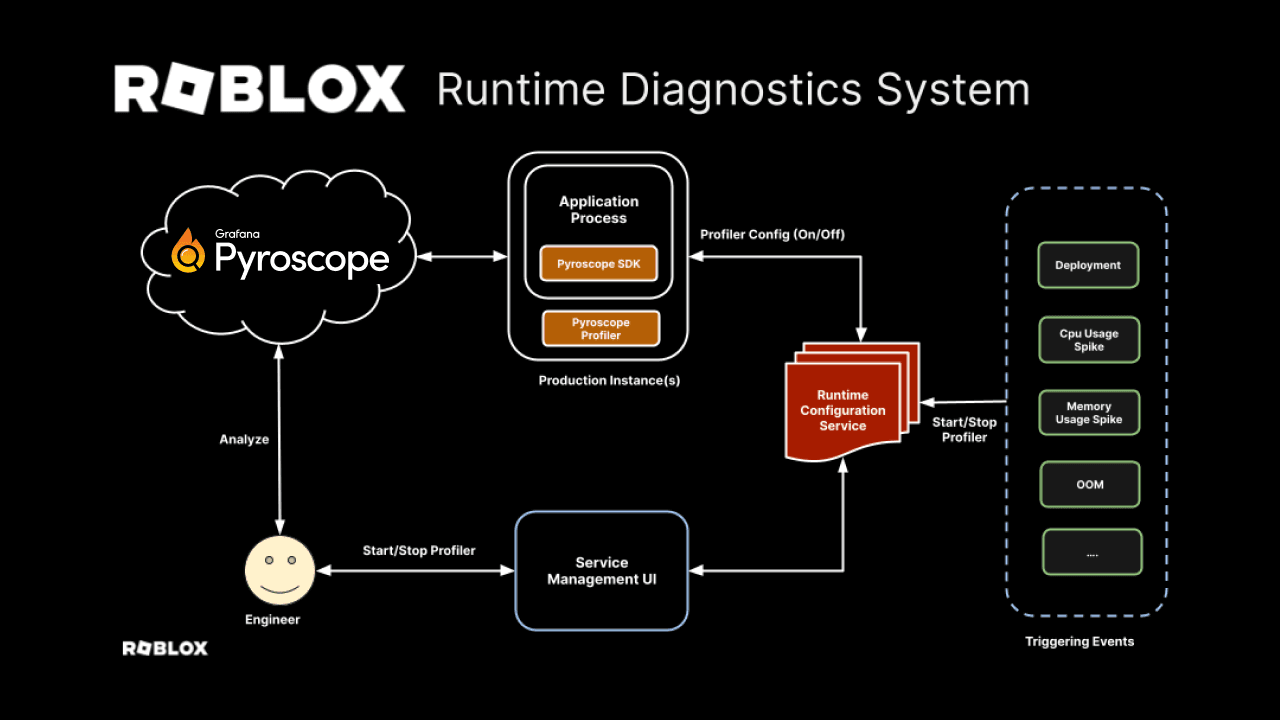
Streamlining runtime diagnostics with on-demand profiling: Inside Roblox’s observability stackGrafana PyroscopeGrafana Cloud Profiles
Grafana Cloud updates: revamped Synthetic Monitoring, improvements to Kubernetes Monitoring, and moreGrafana CloudSynthetic monitoringKubernetes Monitoring
Grafana Enterprise data source plugins: A brief guide to what they are and how to get startedPluginsGrafana EnterpriseGrafana Cloud
The loser tree data structure: How to optimize merges and make your programs run fasterEngineeringCommunity
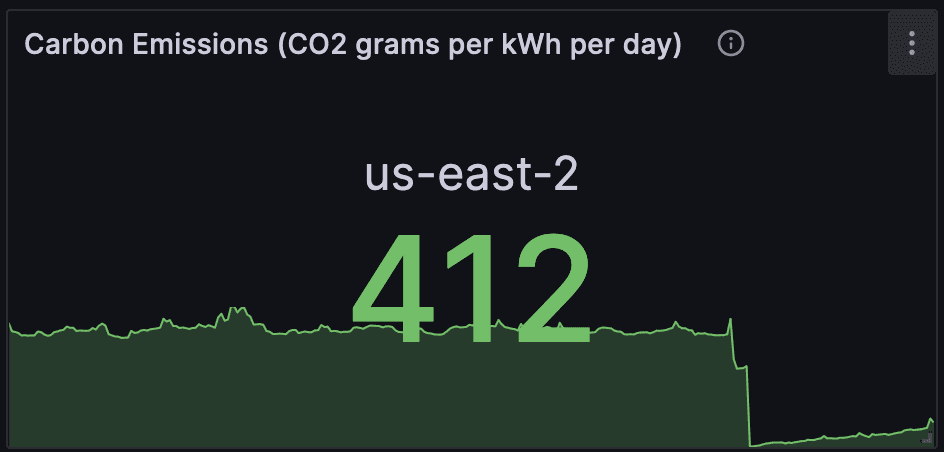
Going green: How to monitor your cloud carbon footprint using Kepler, Prometheus, and GrafanaSustainabilityGrafanaPrometheusEvents
Why companies migrate from OSS to Grafana Cloud for metrics managementAdaptive MetricsGrafana CloudCost management