Ivana Huckova
Staff Software Engineer
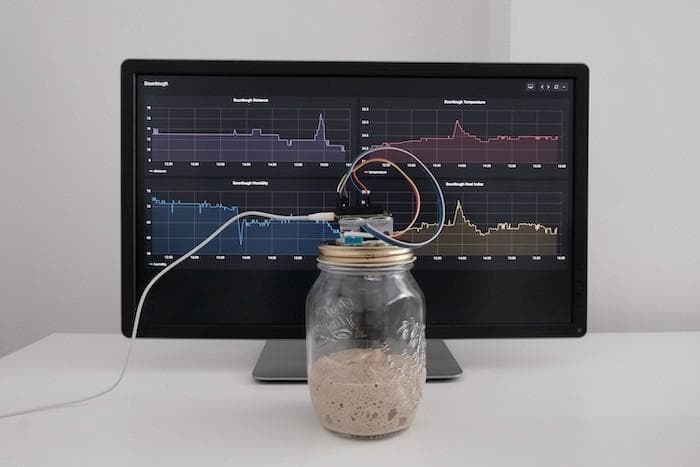
Ivana Huckova is a Staff Software Engineer on the Data Sources team at Grafana Labs. She works on making Grafana’s data sources more reliable and easier to use. In her free time and during Grafana hack days, she builds fun monitoring setups for things like her sourdough starter, avocado plants, or bird songs. She also enjoys speaking about observability and creative uses of Grafana.
Want to stay on top of Grafana and Observability news? Sign up for our newsletter.