AI-powered diagnostics for incident response: New Sift features in Grafana IRMGrafana IncidentMachine learningAIMTTRSift
How to create an ideal Grafana dashboard for science and engineeringGrafanaDashboardCommunityMachine learning
How to observe your TensorFlow Serving instances with Grafana CloudIntegrationsGrafana CloudMonitoringMachine learning
How to forecast holiday data with Grafana Machine Learning in Grafana CloudMachine learningGrafana Cloud
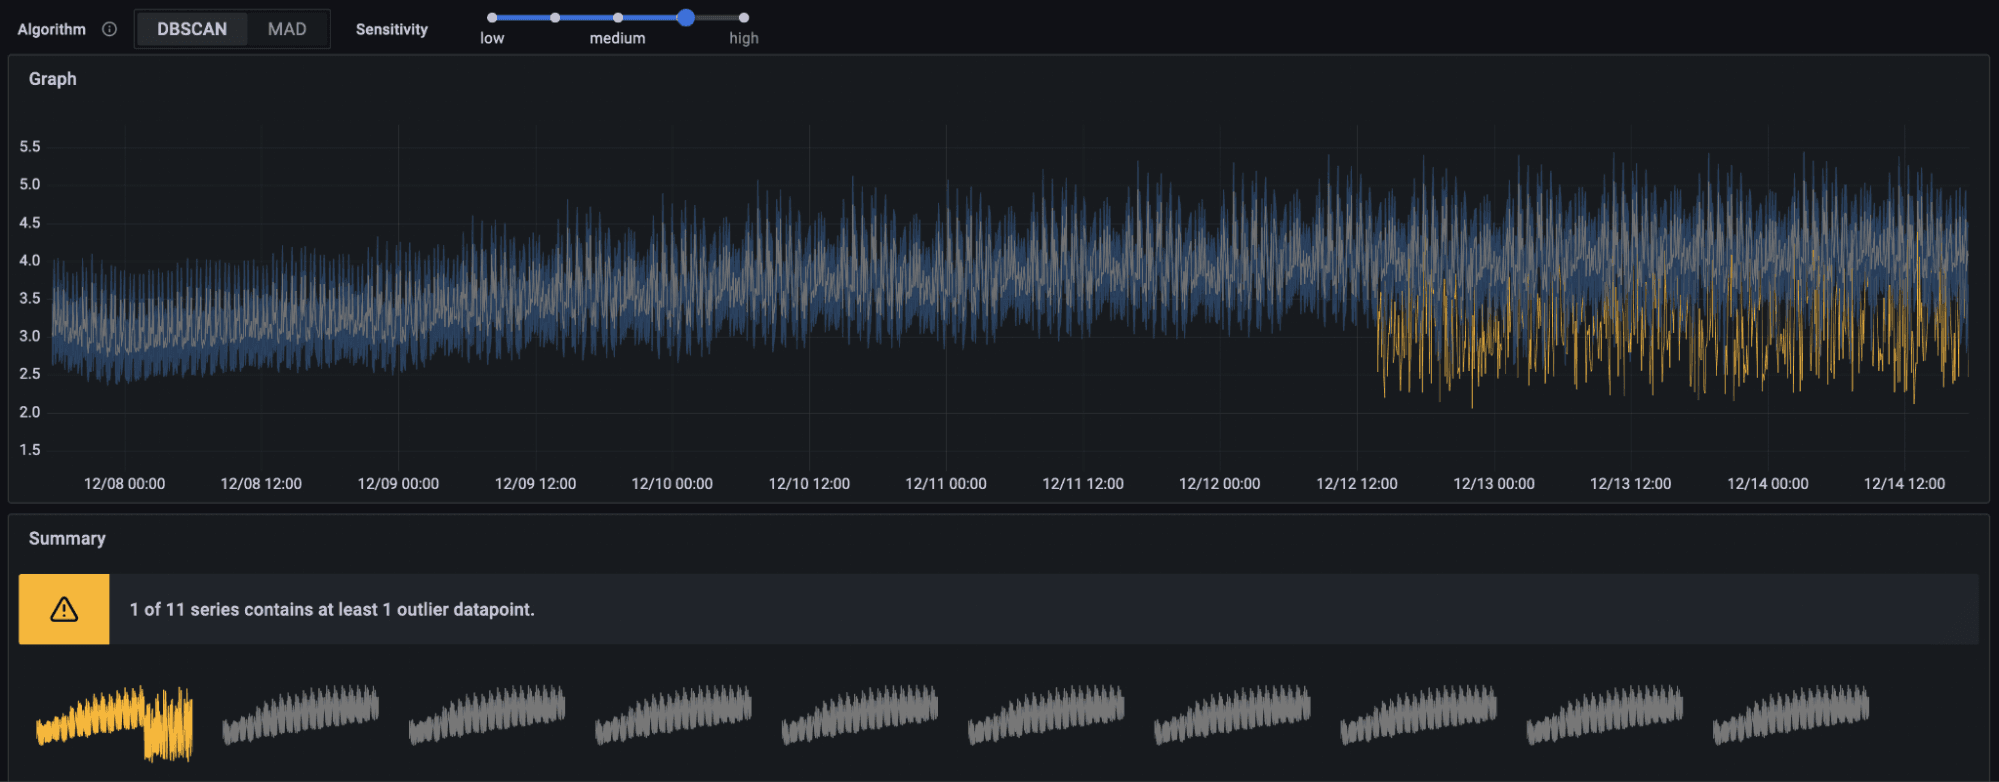
Introducing Outlier Detection in Grafana Machine Learning for Grafana CloudGrafana CloudMachine learning
Don’t miss our webinars on the Grafana Stack, Grafana Enterprise, Grafana Machine Learning, and more!Grafana EnterpriseMachine learningGrafanaEvents
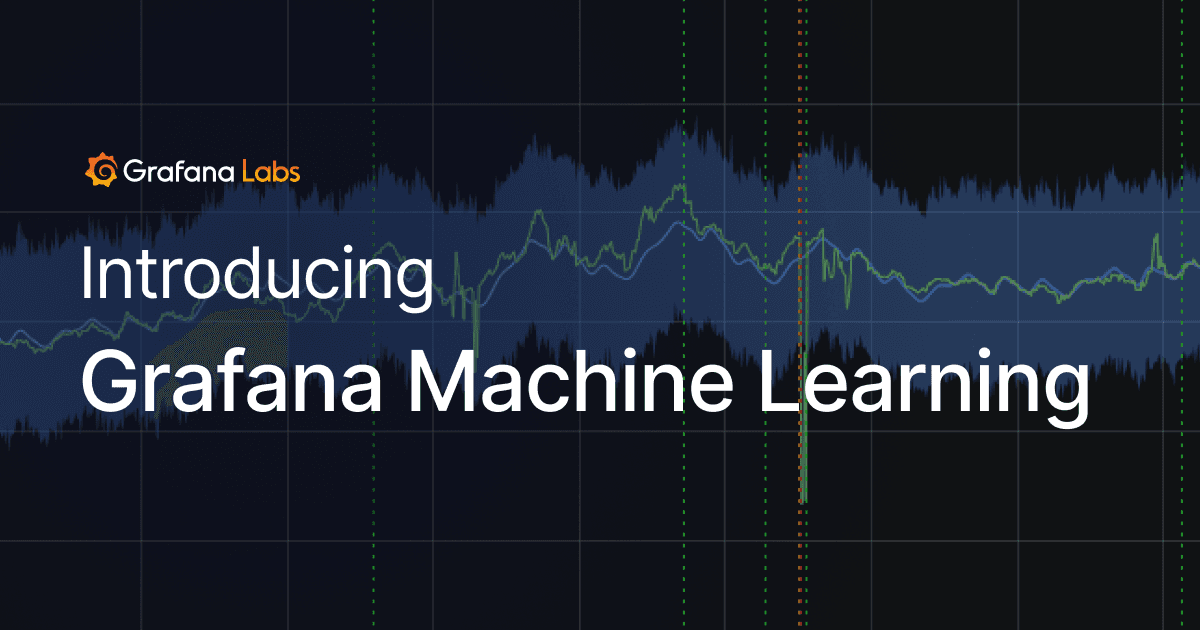
Introducing Grafana Machine Learning for Grafana Cloud, with metrics forecastingGrafana CloudMachine learning
How BasisAI uses Grafana and Prometheus to monitor model drift in machine learning workloadsGrafanaMachine learningPrometheus