Improve site reliability with Grafana Cloud
Grafana Cloud helps SRE and platform teams build reliable, high-performing systems by combining performance testing, synthetic monitoring, application observability, SLOs, and incident response in one platform.

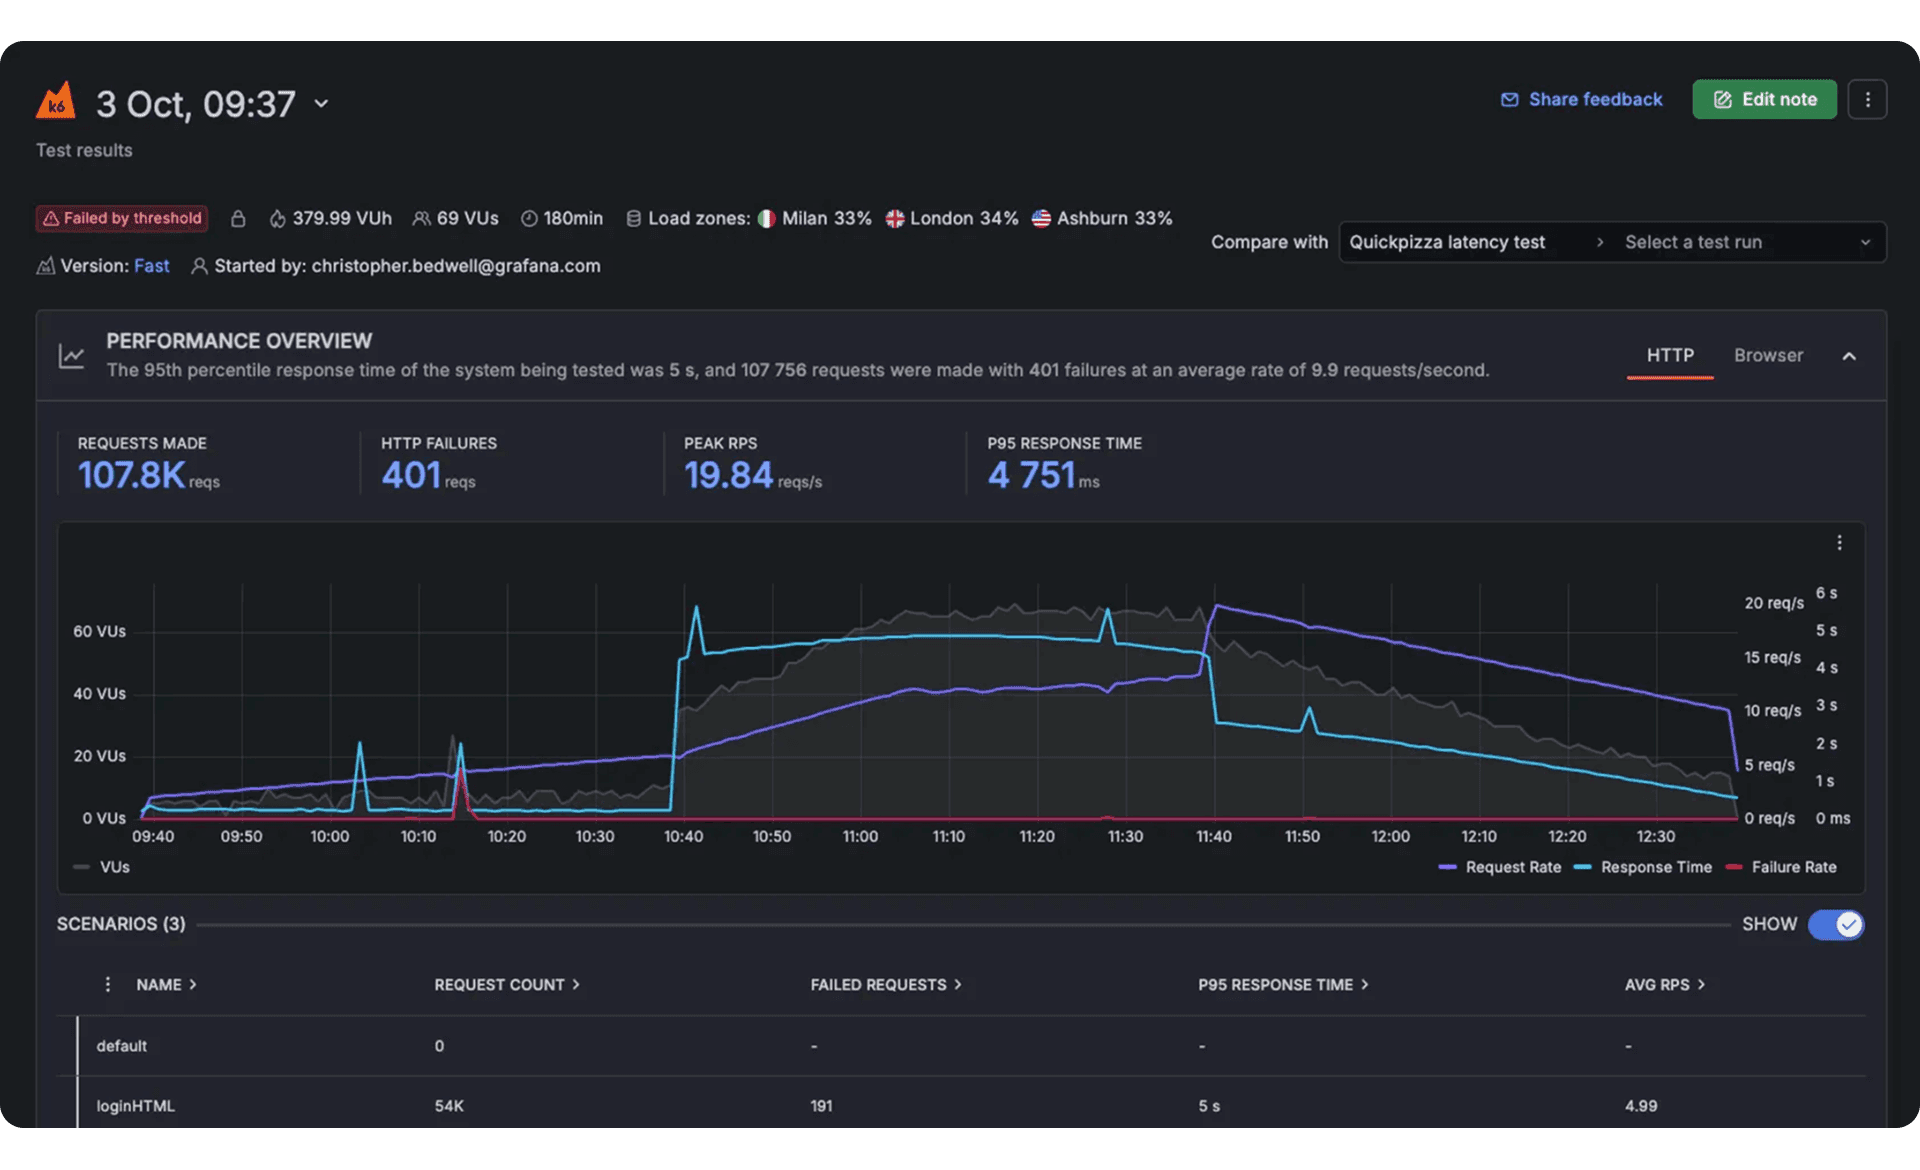
Proactively prevent outages
Test and monitor reliability before users are impacted
Ensure consistent user experiences
Continuously validate performance and availability from around the world
Empower teams with unified insights
Reduce cognitive load with end-to-end observability, AI assistance, and a centralized service center
スタートアップからフォーチュン500まで、誰からも信頼されています。
Get a unified view of service health with Service Center
Track and visualize SLOs, alerts, incidents, and on-call data in a single, centralized hub
Identify and act on reliability risks faster by surfacing performance trends and insights for every service
Prevent on-call overload and burnout by tracking alert patterns and workload distribution across engineering teams

Ensure global availability with continuous synthetic monitoring
Simulate real user journeys with API and browser checks
Detect outages and latency issues from global locations
Validate uptime and routing behavior before customers notice
Troubleshoot faster with end-to-end application observability
Get instant visibility across your services with auto-instrumentation via OpenTelemetry or Grafana agents
Find root causes faster by correlating all telemetry signals in one workflow
Speed investigations with AI as Grafana Assistant summarizes anomalies
Measure what matters with service-level objectives (SLOs)
Define SLOs aligned to key user journeys
Track error budgets and burn rate to understand risk
Cut noise with SLO-based alerts focused on user impact


Real stories from real customers

“After this three-year journey that started by realizing we couldn’t detect some basic failures, introducing the FCI, and then adding in Grafana Cloud IRM and Grafana SLO, we’re in a much better place to detect and fix customer-facing issues. In fact, our time to detect was reduced more than 80%, meaning our customers were seeing fewer errors and a better overall experience.”
Carlos Hernandez SaavedraHead of Cloud & SRE, LATAM Airlines
個人プロジェクト、新しいアイデアの探求、初期段階のスタートアップに最適です。料金は一切かかりません。
使用制限付きのすべてのGrafana Cloudサービス
適応型テレメトリー、AIアシスタント、その他多くの機能
コミュニティサポート
メトリクス、ログ、トレース、プロファイル、k6パフォーマンステストの保持期間は14日間
より多くのリテンション、基本的なサポート、および使用量ベースの価格設定でスケーリングの準備ができました。
すべてのGrafana Cloudサービスへの無制限アクセス。無料枠を超えた分は使った分だけ支払うだけです。
適応型テレメトリー、AIアシスタント、その他多数
8X5メールサポート
メトリクスの保持期間は13ヶ月です。ログ、トレース、プロファイル、及びk6パフォーマンステストの保持期間は30日です。
セキュリティ、コンプライアンス、デプロイメントの要件を持つ企業向けのフルサービス提供。
プレミアムサポート
カスタムリテンション
導入の柔軟性(パブリッククラウド、フェデラルクラウド、または独自のクラウド)


なぜGrafana Cloudを選ぶのか
オープンで統合されたプラットフォーム
OpenTelemetryネイティブの可観測性とロックインなしで、Kubernetesモニタリング、アプリケーション可観測性、Grafana SLO、RUMのような即時使用可能なソリューションを1つの統合された体験で提供します。
コスト効率
未使用のデータを除外するAdaptive Telemetryで、洞察力を犠牲にすることなくコストを最適化し、実際に価値を生み出すものに予算を振り向けましょう。支出の監視、制御、調整をサポートするコスト管理ツールと組み合わせて使用してください。
AIと自動化
Grafanaアシスタントは、エージェント的なワークフロー、事前に構築されたダッシュボード、インテリジェントフィルター、およびカスタマイズされたアラートを強化し、より迅速で効率的なインシデント対応のために必要なデータを提示します。


