
TraceHouse for Grafana


Monitor ClickHouse merges, queries, parts, replication, and storage from Grafana.
What is TraceHouse?
TraceHouse queries ClickHouse system.* tables (parts, merges, queries, replication queue, etc.) through the Grafana ClickHouse datasource. No external agents needed.
Features
Database Explorer
Browse databases, tables, columns, and storage details.
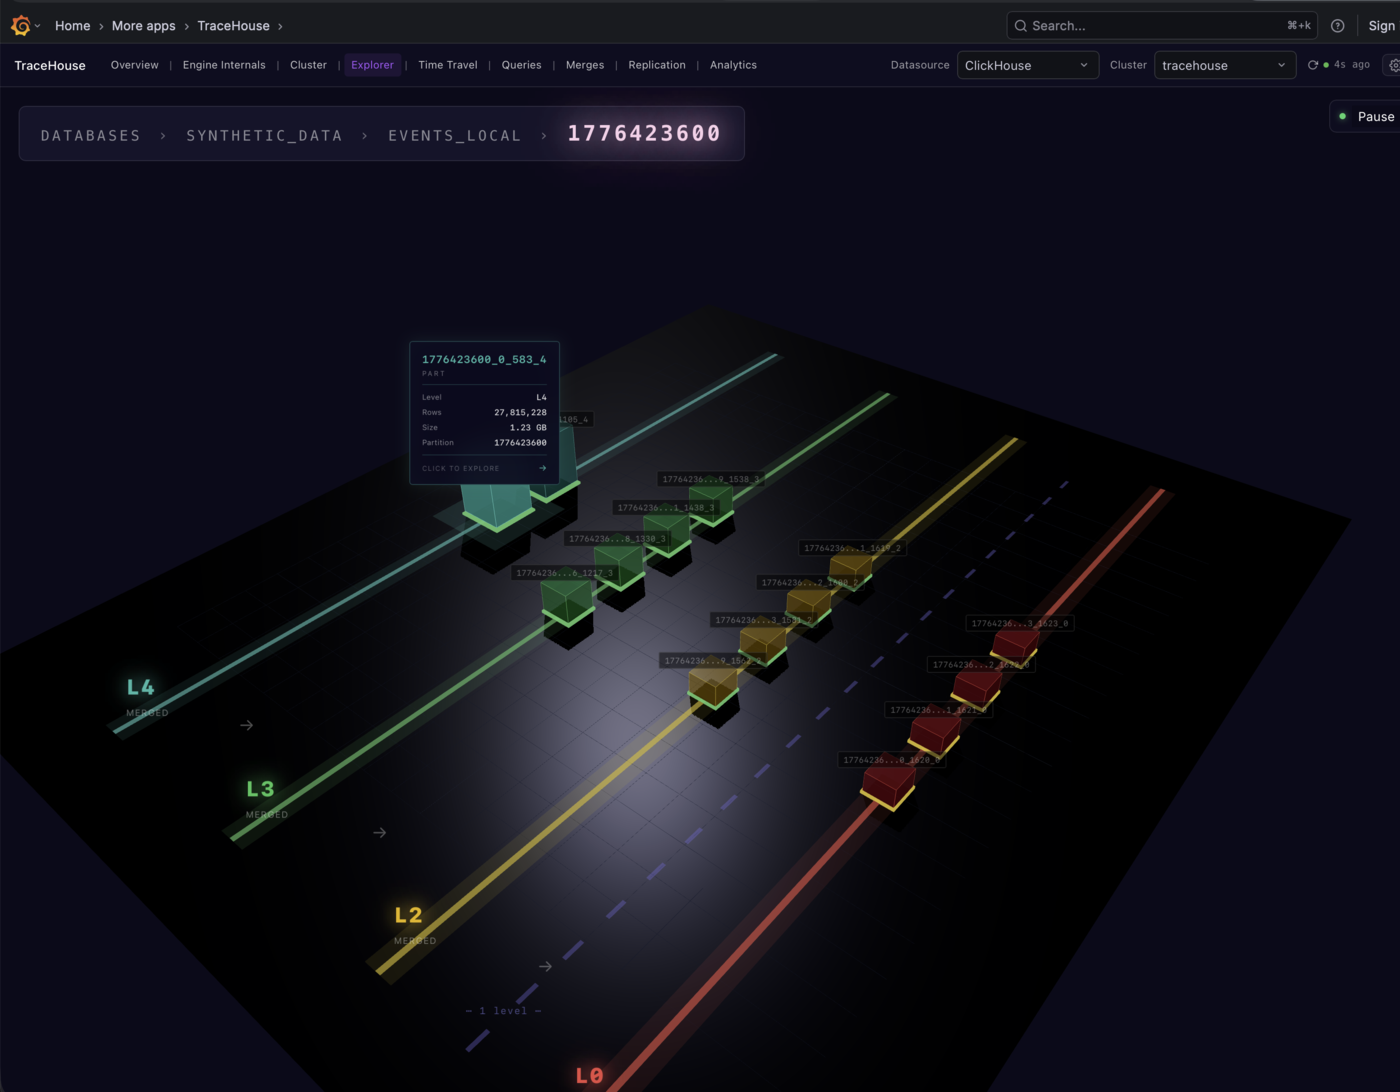
Time Travel
Replay how tables, parts, and merges evolved over any time window. See when parts were created, merged, or moved.
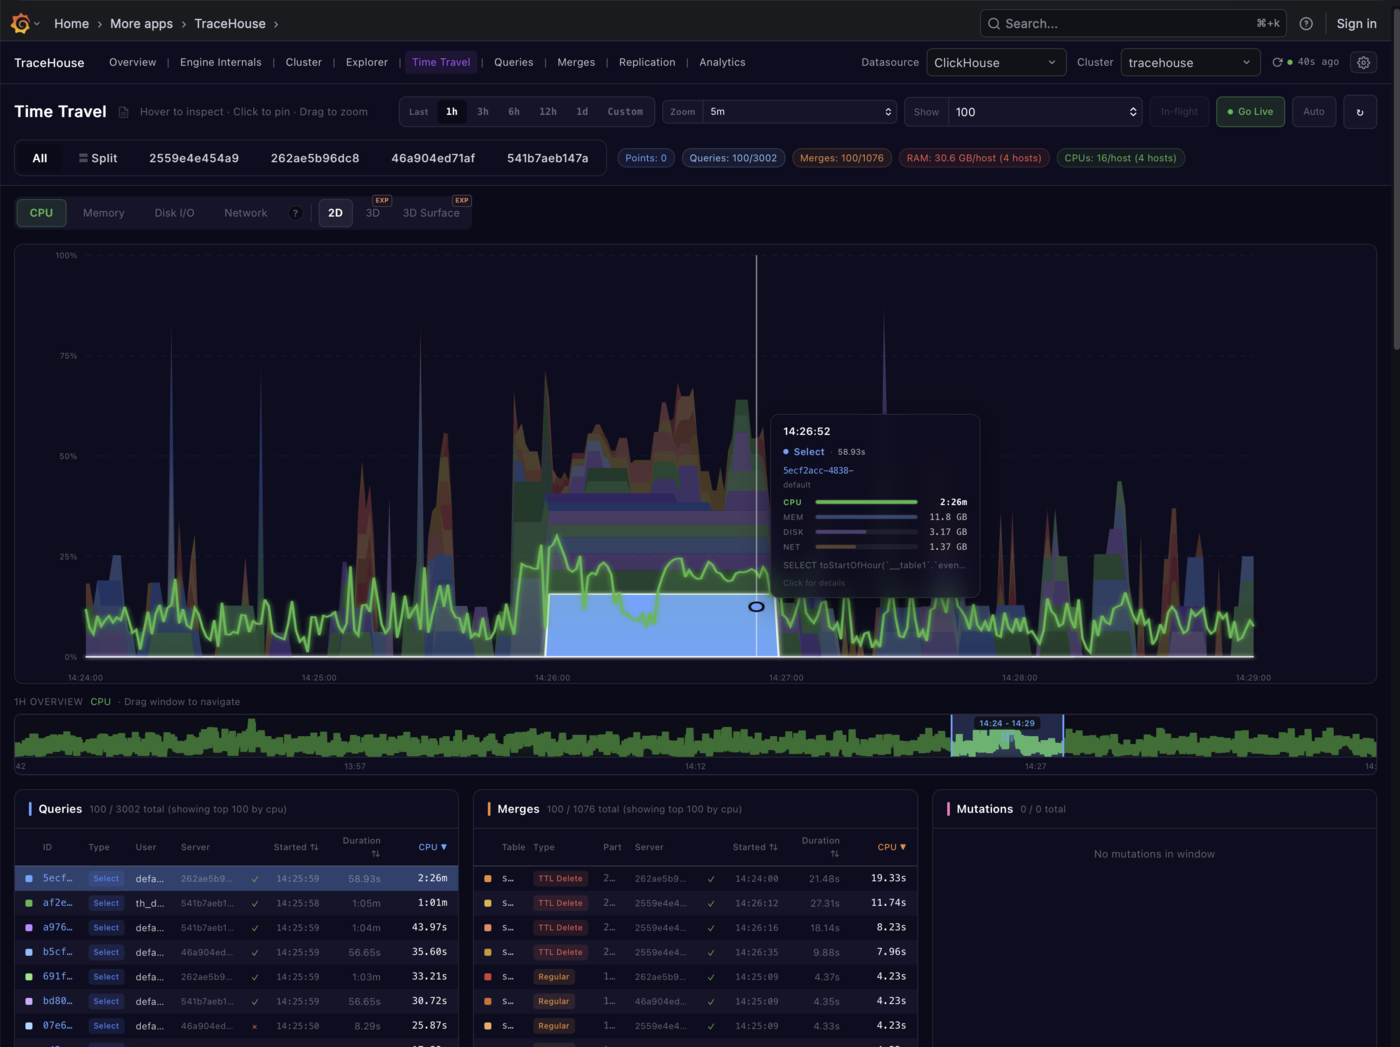
Query History
Query breakdown by user, query kind, and status. Identify slow queries, see normalized query patterns, and link from query history to time-travel views.
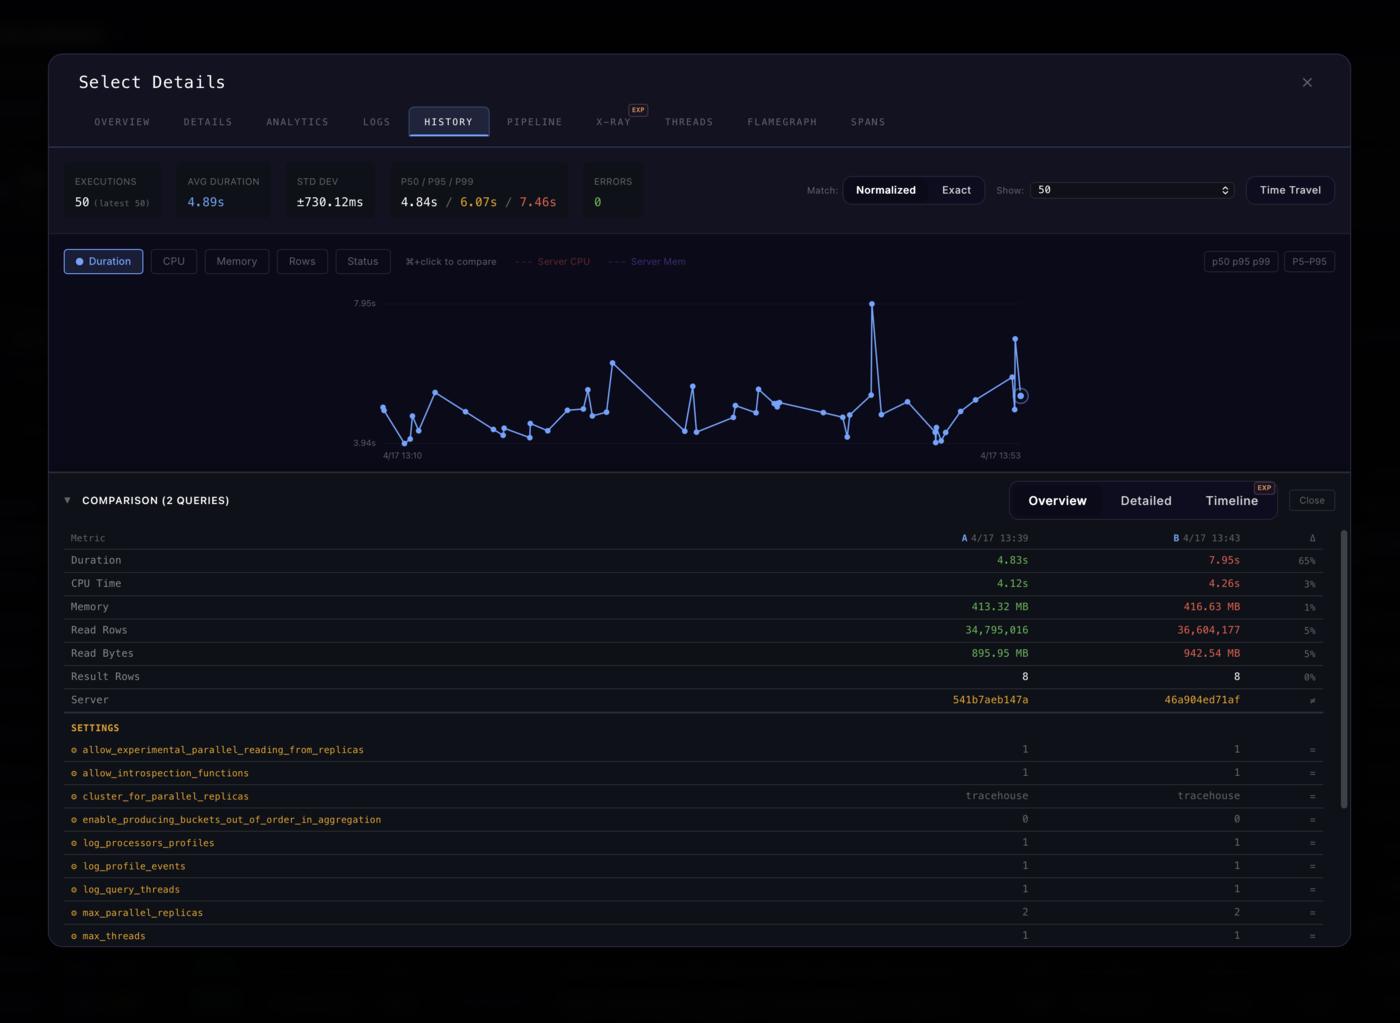
Query Flow Map
See how a distributed query ran across the initiator and its shards.
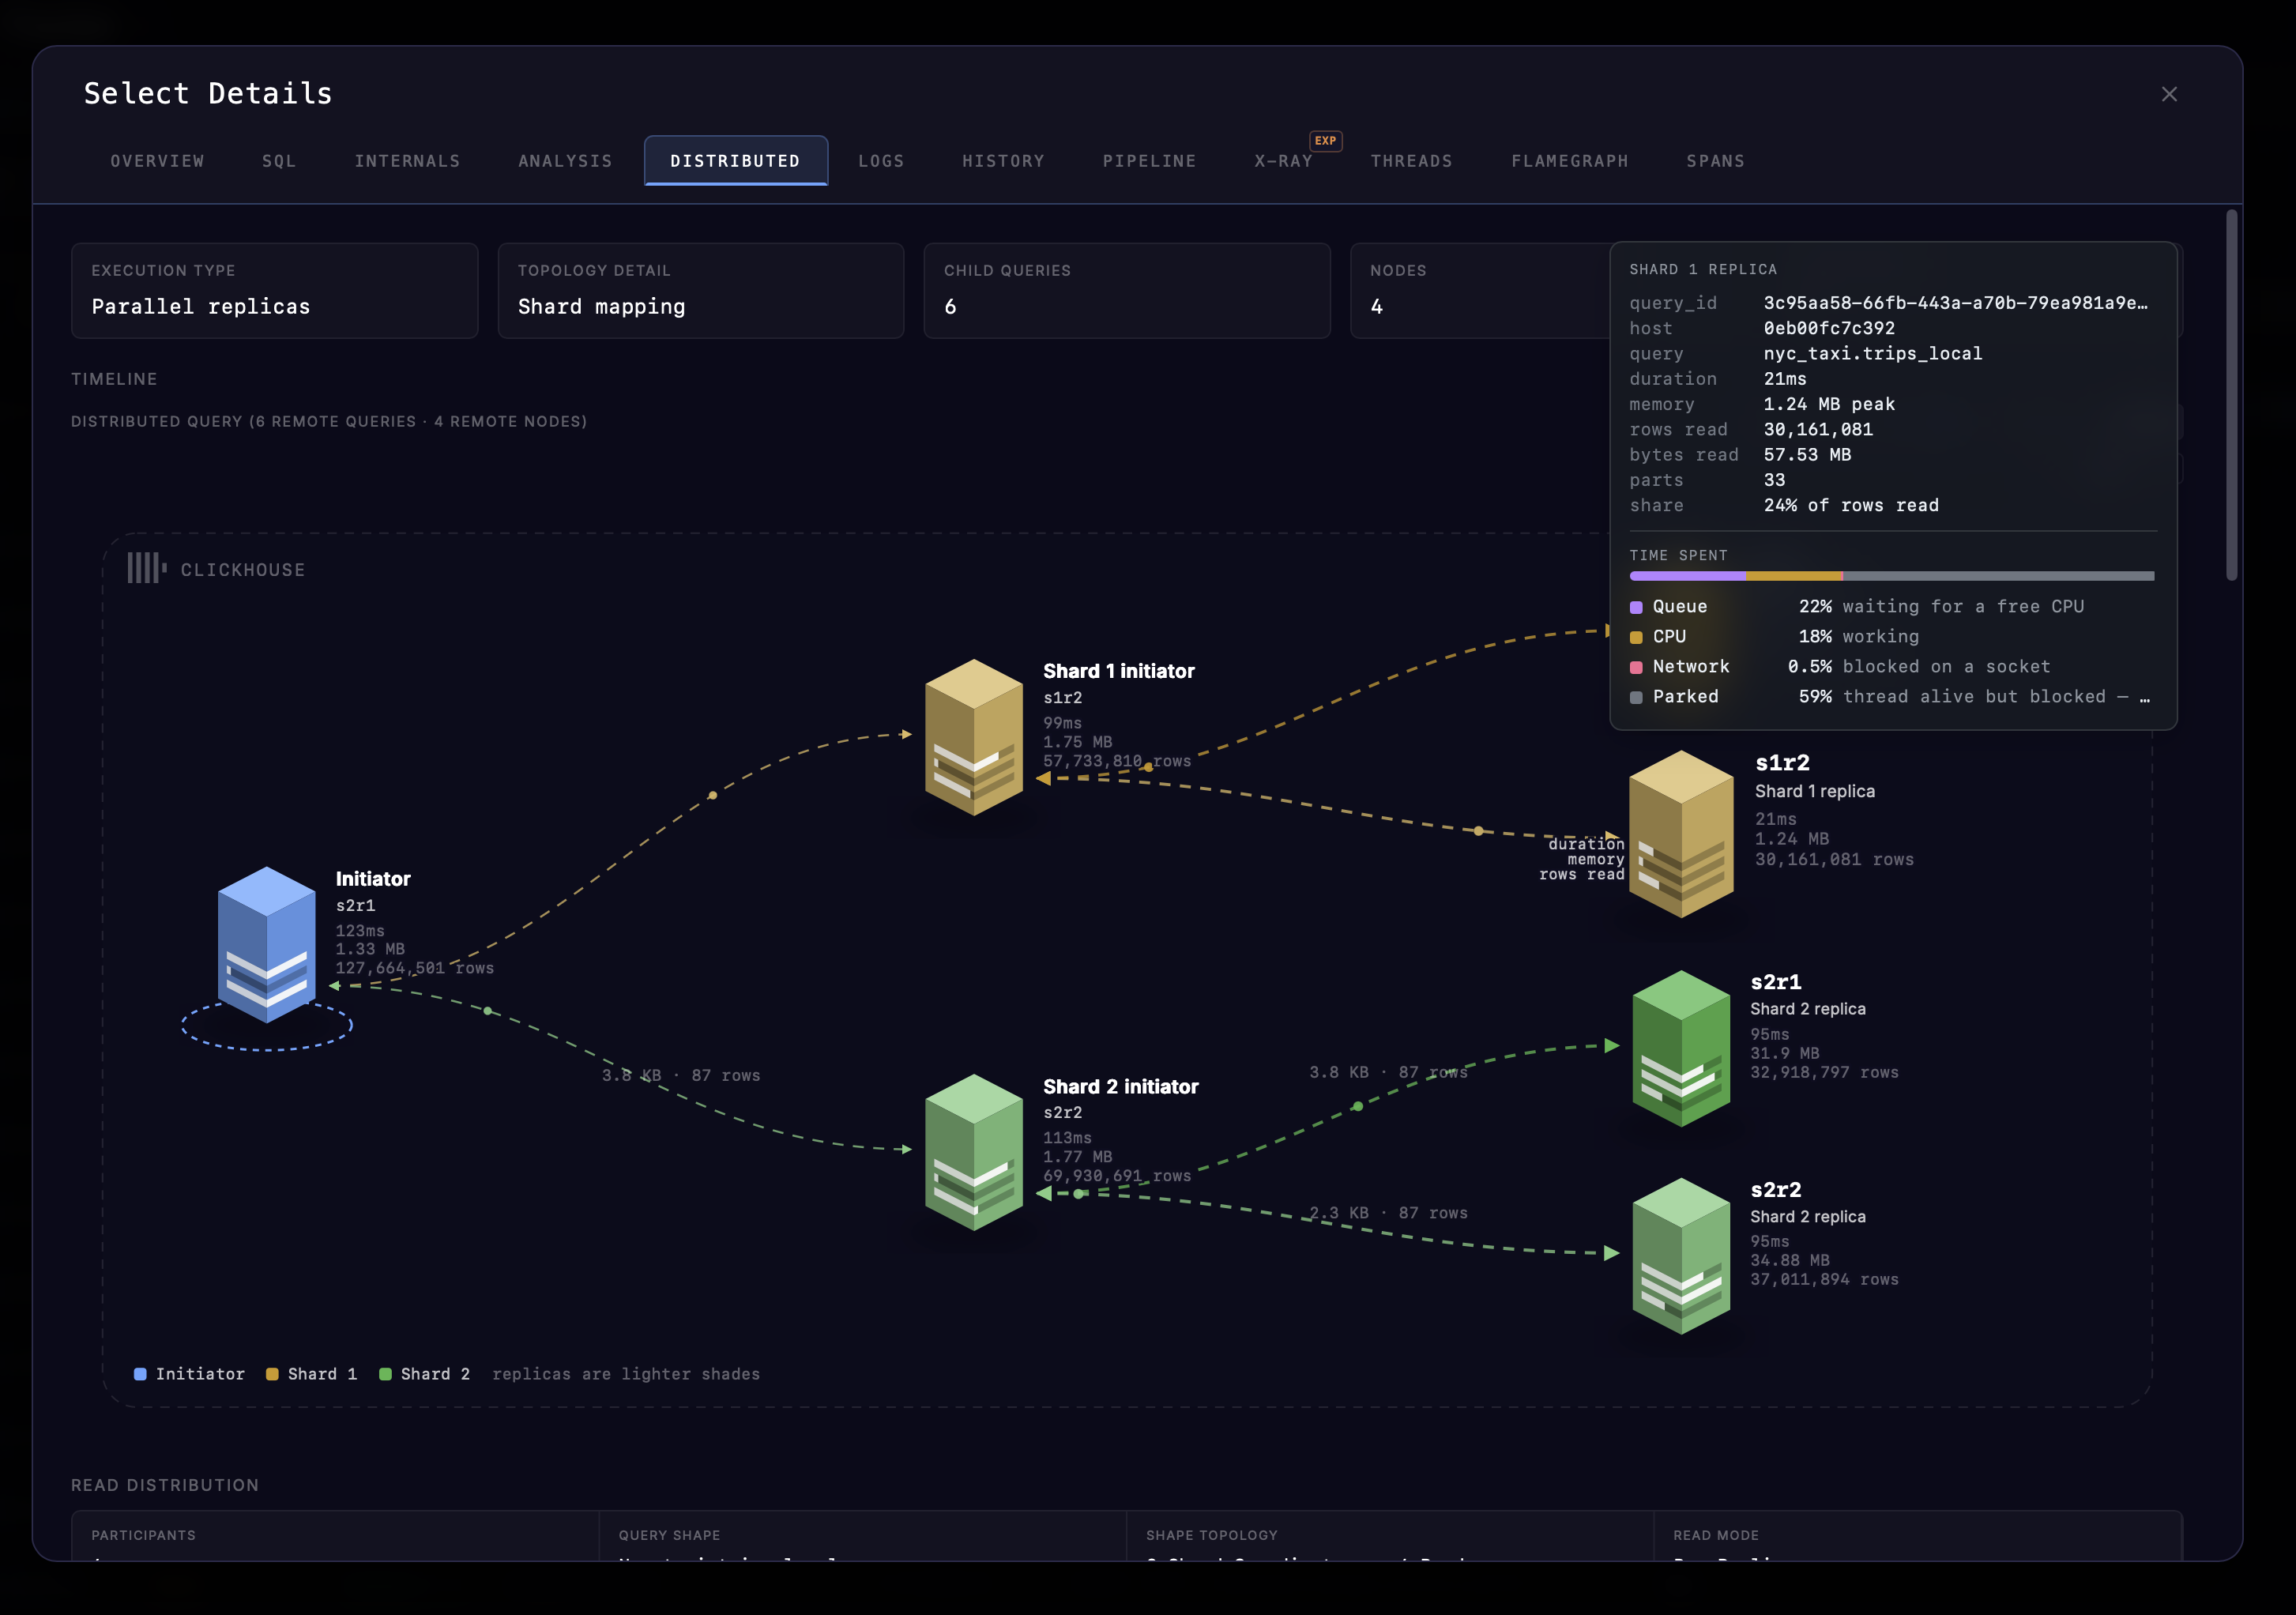
3D Analytics
3D surface visualizations for query and merge patterns over time.
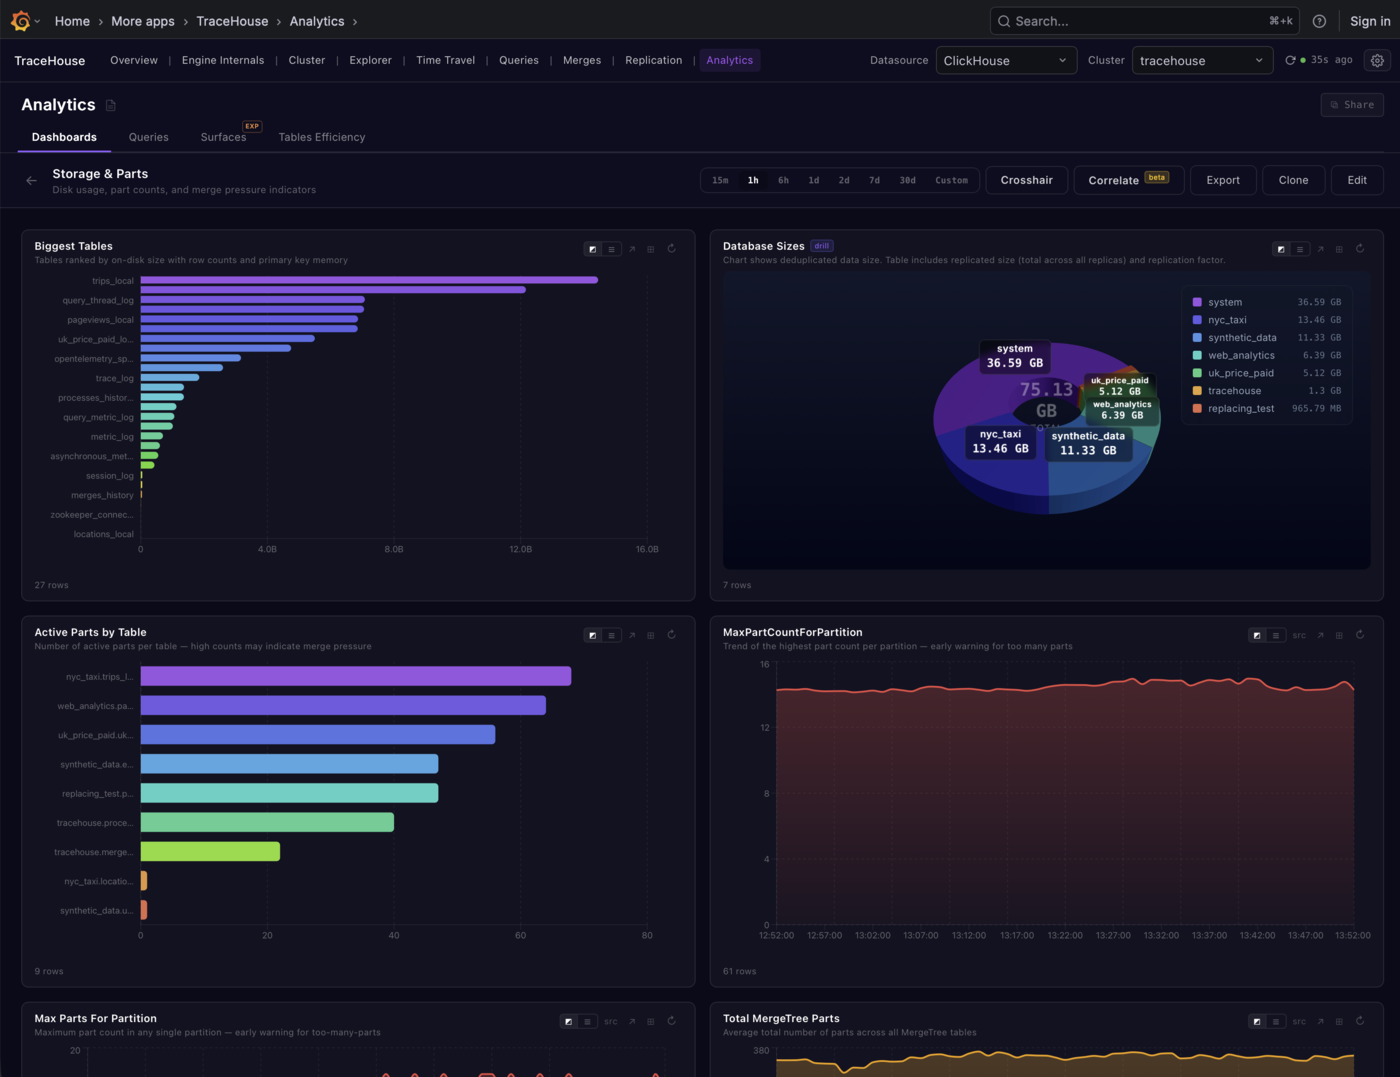
Grafana Panel Export
Export TraceHouse analytics views as native Grafana panels for dashboards and ongoing monitoring.
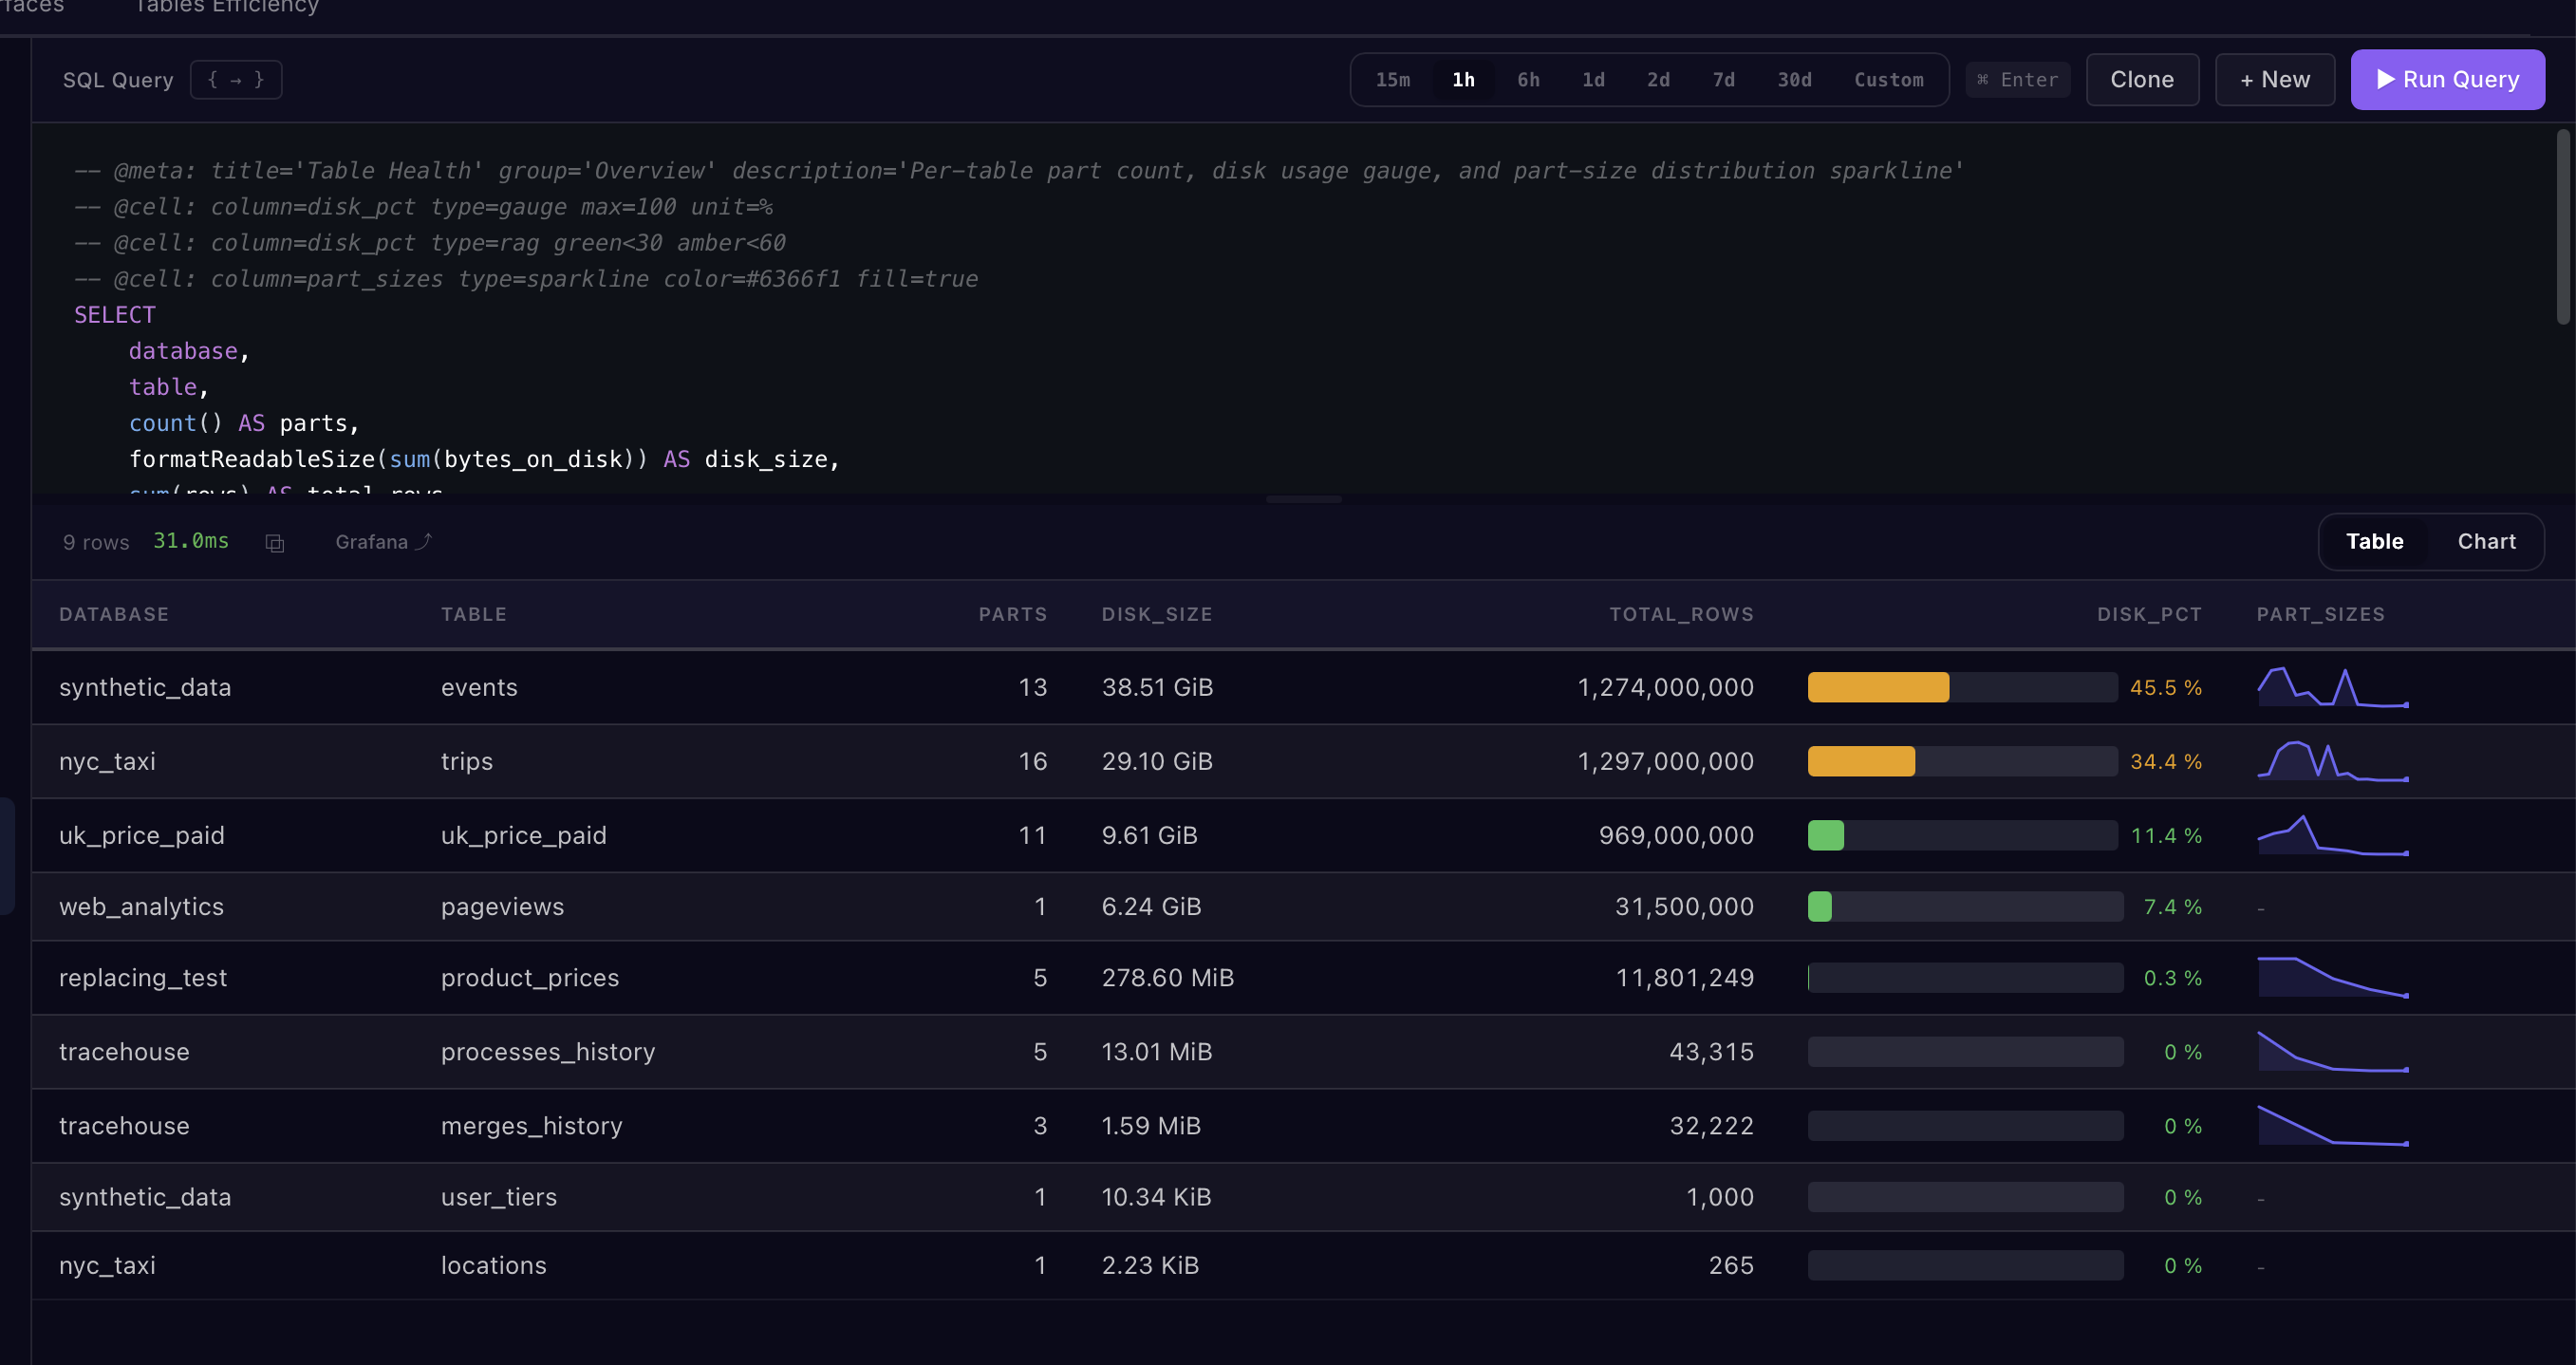
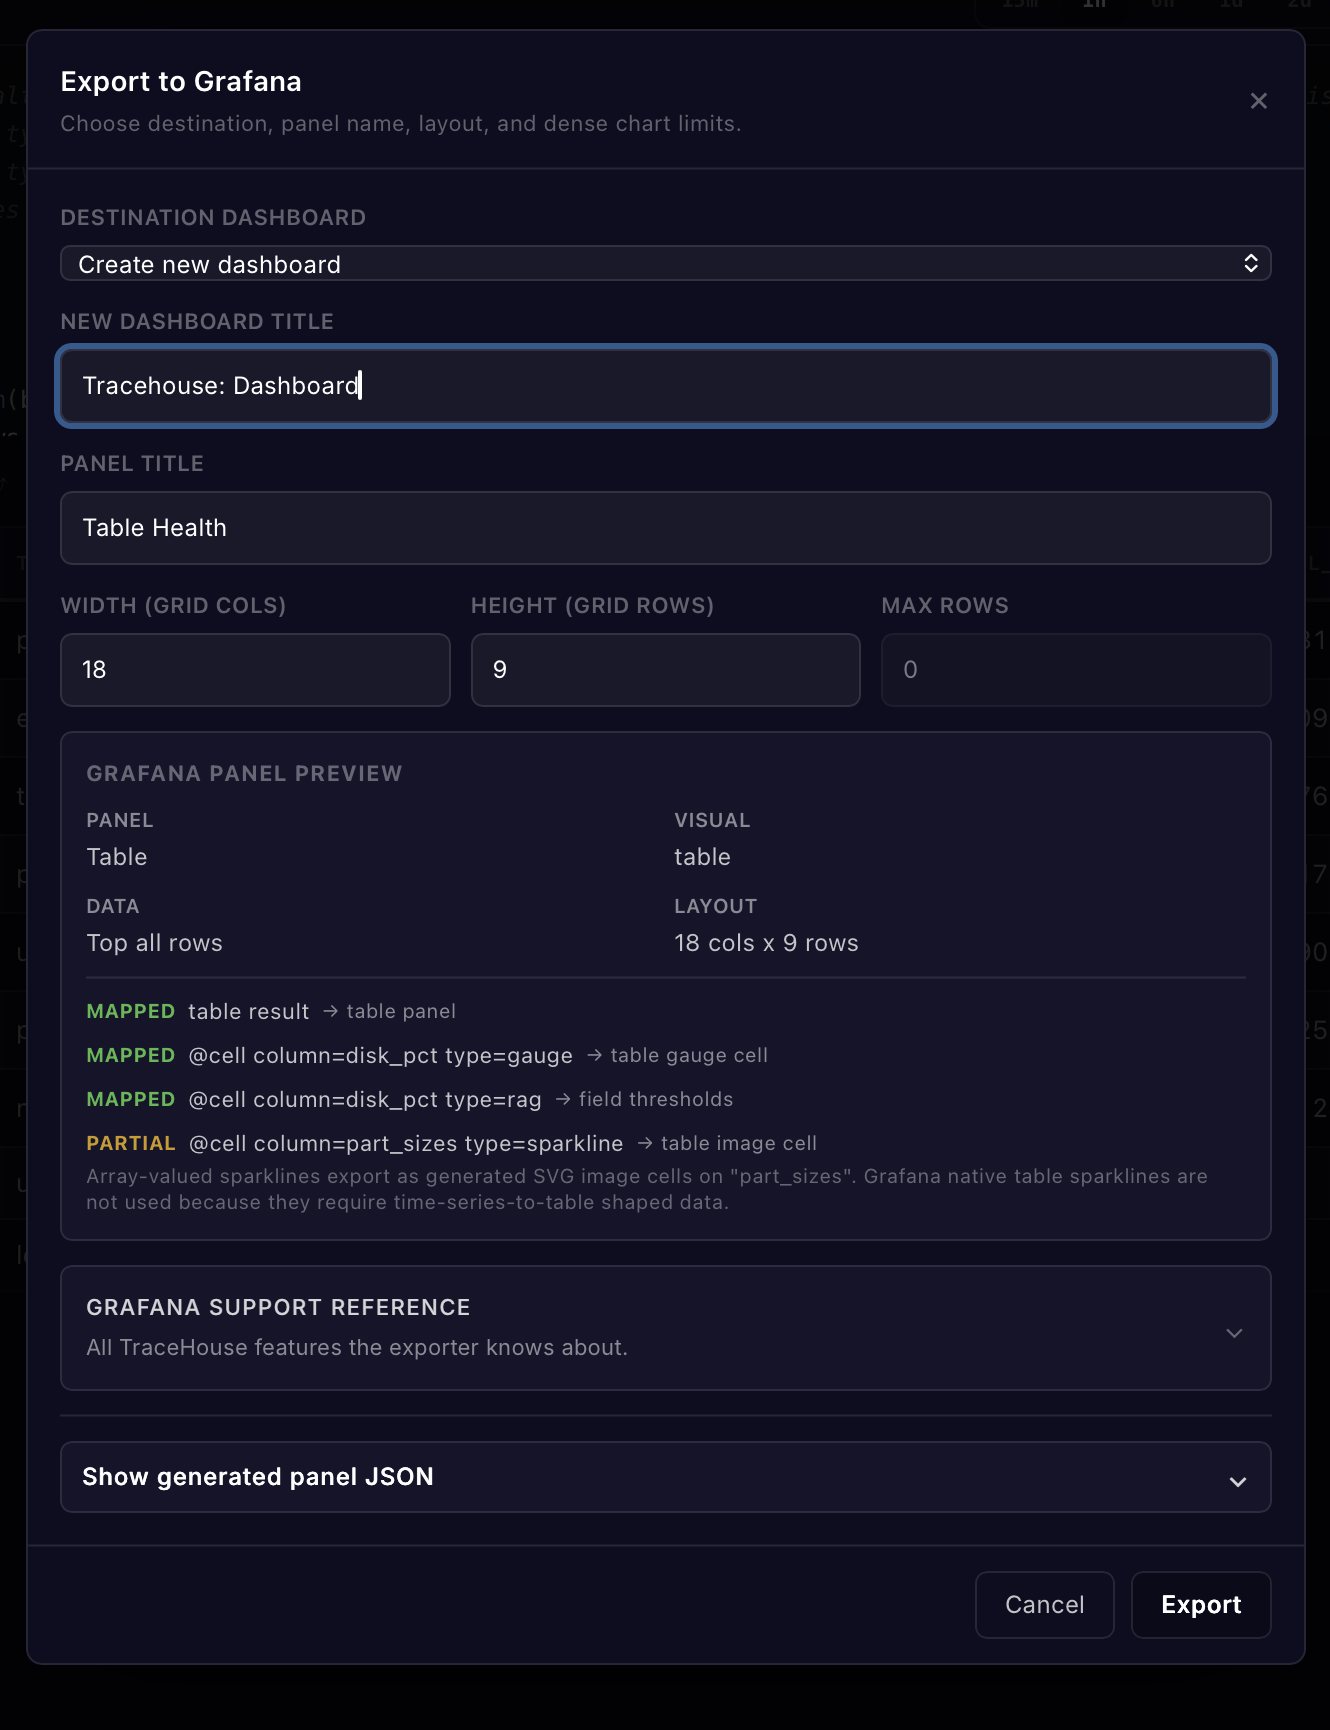
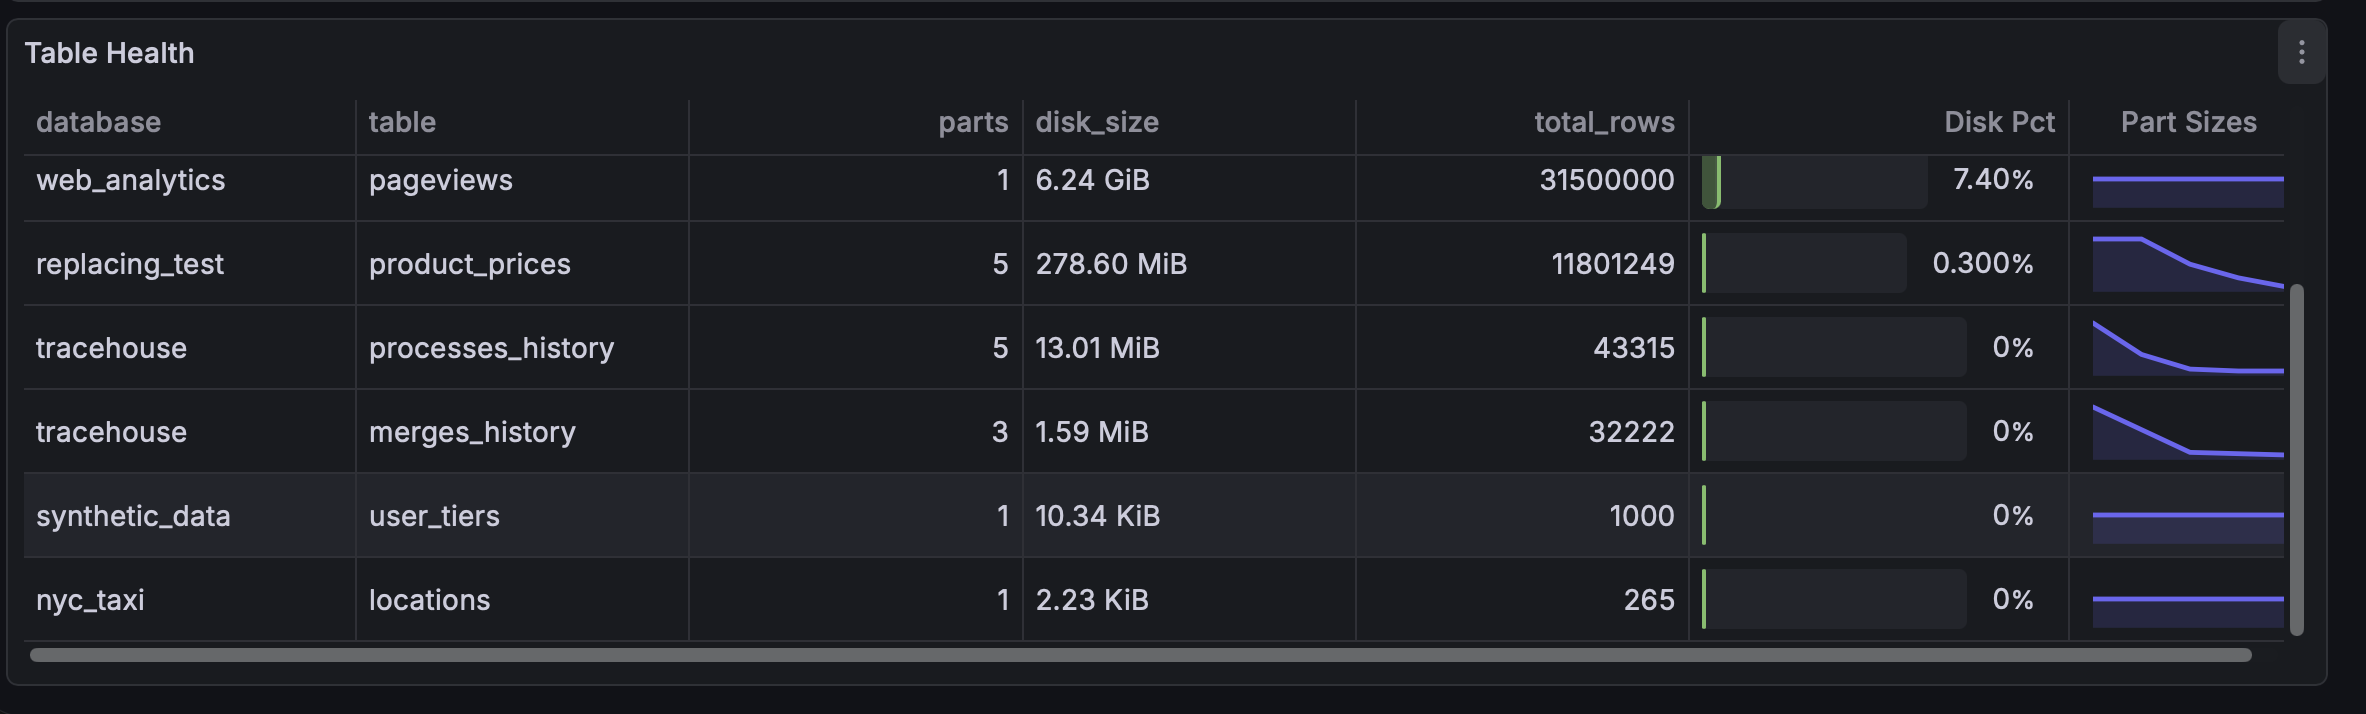
Learn more about Grafana panel export
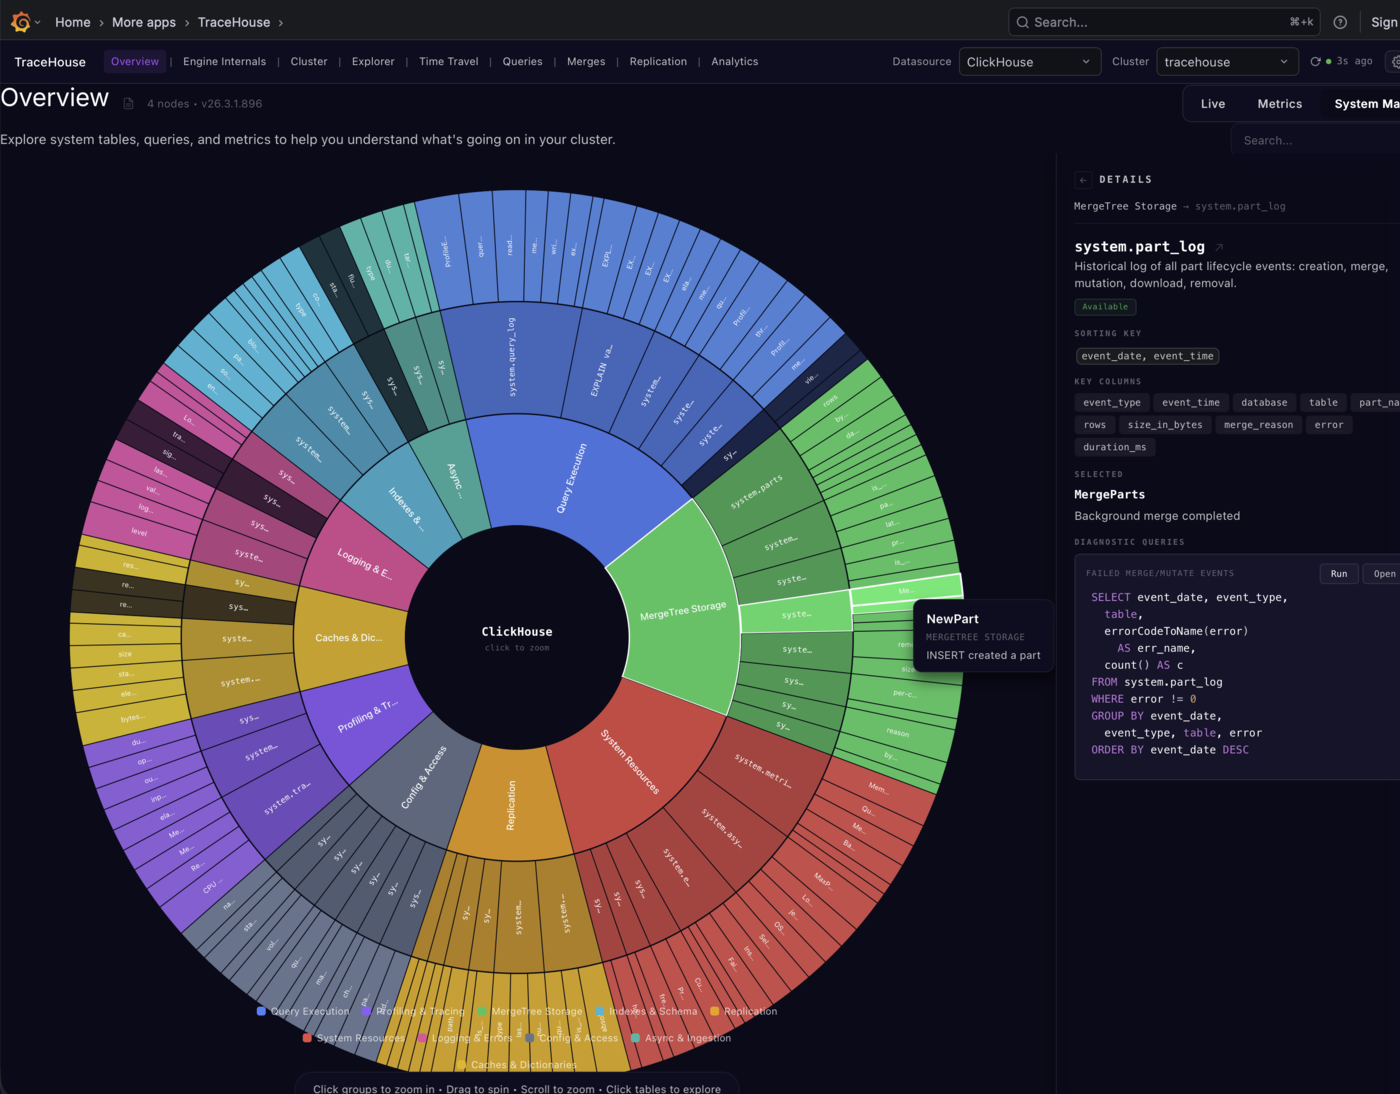
System Map
Visual overview of table sizes, part counts, and storage distribution across your cluster.
Overview Dashboard
Cluster health at a glance: CPU, memory, active queries, running merges, and replication lag across all nodes.
Merge Tracker
Real-time merge monitoring with per-merge progress bars, throughput, elapsed/remaining time, and X-ray detail view.
Engine Internals
Inspect MergeTree parts, partitions, storage policies, and data distribution.
Cluster Topology
Multi-node view with shard/replica status and per-node resource utilization.
Replication
Replication queue depth, log lag, and inter-replica sync status.
Requirements
- Grafana >= 11.6.11 <12, >=12.0.10 <12.1, >=12.1.7 <12.2, or >=12.2.5
- ClickHouse 21.8+ with
system.*tables accessible - Grafana ClickHouse datasource plugin installed and configured
Getting Started
- Install the plugin from the Grafana plugin catalog or side-load the signed zip
- Enable the plugin under Administration > Plugins > TraceHouse
- Ensure you have a ClickHouse datasource configured pointing to your cluster
- Open TraceHouse from the sidebar and start exploring
Configuration
Go to the TraceHouse Configuration page to set:
- Allowed Refresh Rates — Control which auto-refresh intervals are available. Disabling aggressive rates (1s, 2s) reduces load on your ClickHouse cluster.
- Default Refresh Rate — The refresh interval applied when a user first opens any TraceHouse page.
Documentation
License
Apache 2.0 — see LICENSE for details.
Grafana Cloud
Connect any plugin in Grafana Cloud.
- 150+ data source integrations
- Grafana Assistant - AI that correlates your data, builds queries, and answers questions
- 10k Prometheus metrics + 50 GB logs, traces, and profiles on the free tier
- ...and more
Insights
- Adoption
Running on 73 active Grafana instances.
- Activity
Last updated 15 Sep 2026.
5 releases in the past year.
- Version
- 0.19.1
- Dependencies
- Grafana >=11.6.11 <12 || >=12.0.10 <12.1 || >=12.1.7 <12.2 || >=12.2.5
- Developer
- tracehouse
Grafana Cloud
Connect any plugin in Grafana Cloud.
- 150+ data source integrations
- Grafana Assistant - AI that correlates your data, builds queries, and answers questions
- 10k Prometheus metrics + 50 GB logs, traces, and profiles on the free tier
- ...and more