Plugins 〉Network Weathermap NG

Panel
community

Network Weathermap NG

  • Overview
  • Installation
  • Change log
  • Related content

Network Weathermap NG

Draw your network as a live map: nodes for your sites and devices, links for the circuits between them, and colors that change with real traffic. Network Weathermap NG turns any Grafana time series — interface throughput, utilization, error rates — into a classic network weathermap, built and edited entirely inside the Grafana panel editor.

If you have used PHP Network Weathermap, the concepts (nodes, links, color scales) will feel immediately familiar.
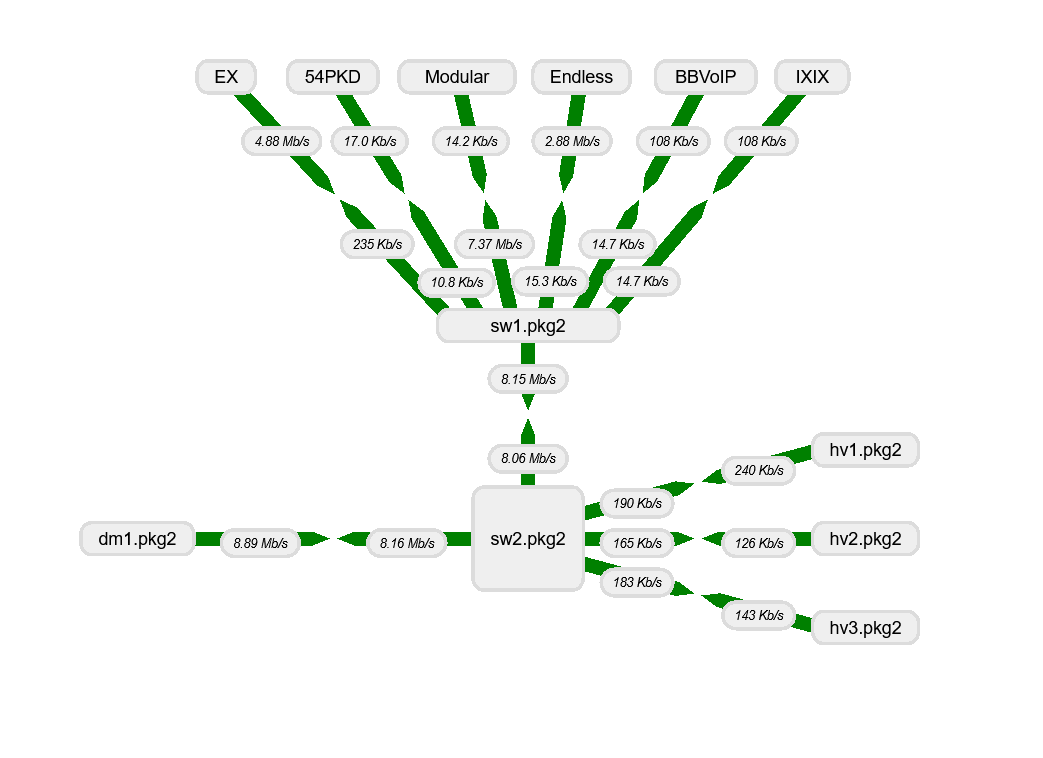
Network weathermap overview

What you can do with it

  • NOC wall displays — a single at-a-glance map of your backbone, WAN, or campus network, colored by live utilization.
  • WAN and backbone monitoring — see both directions of every circuit independently, so an asymmetric saturation stands out.
  • Capacity planning — color links by percentage of provisioned bandwidth and spot the circuits trending toward saturation.
  • Incident triage — node status coloring flags down devices, and per-link dashboard links jump straight to the detailed dashboard for that circuit.
  • Historical review — scrub the timeline slider to replay link values across the selected time range and see when traffic shifted.
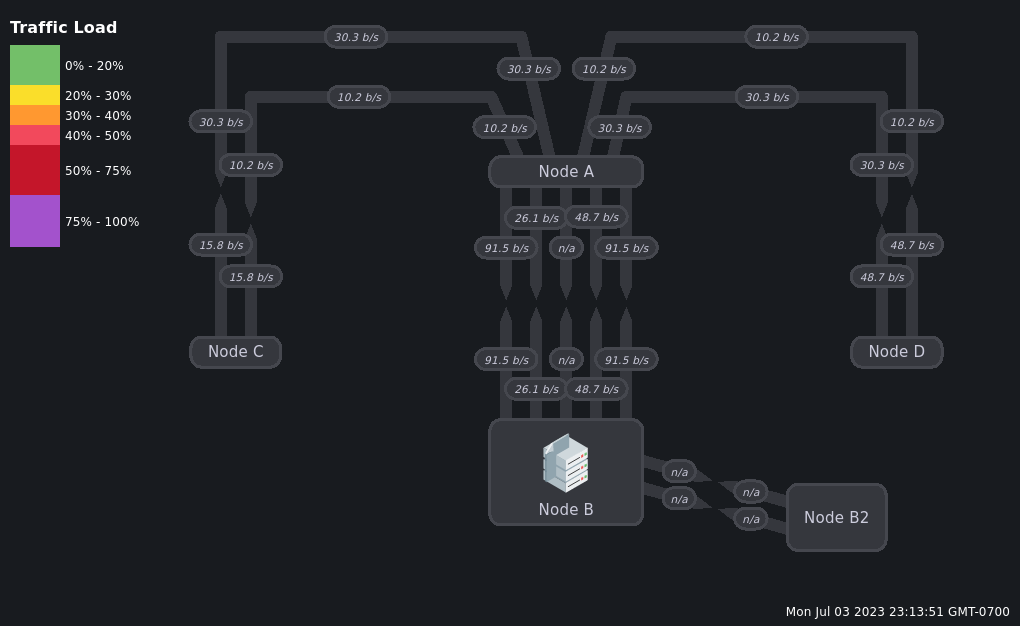
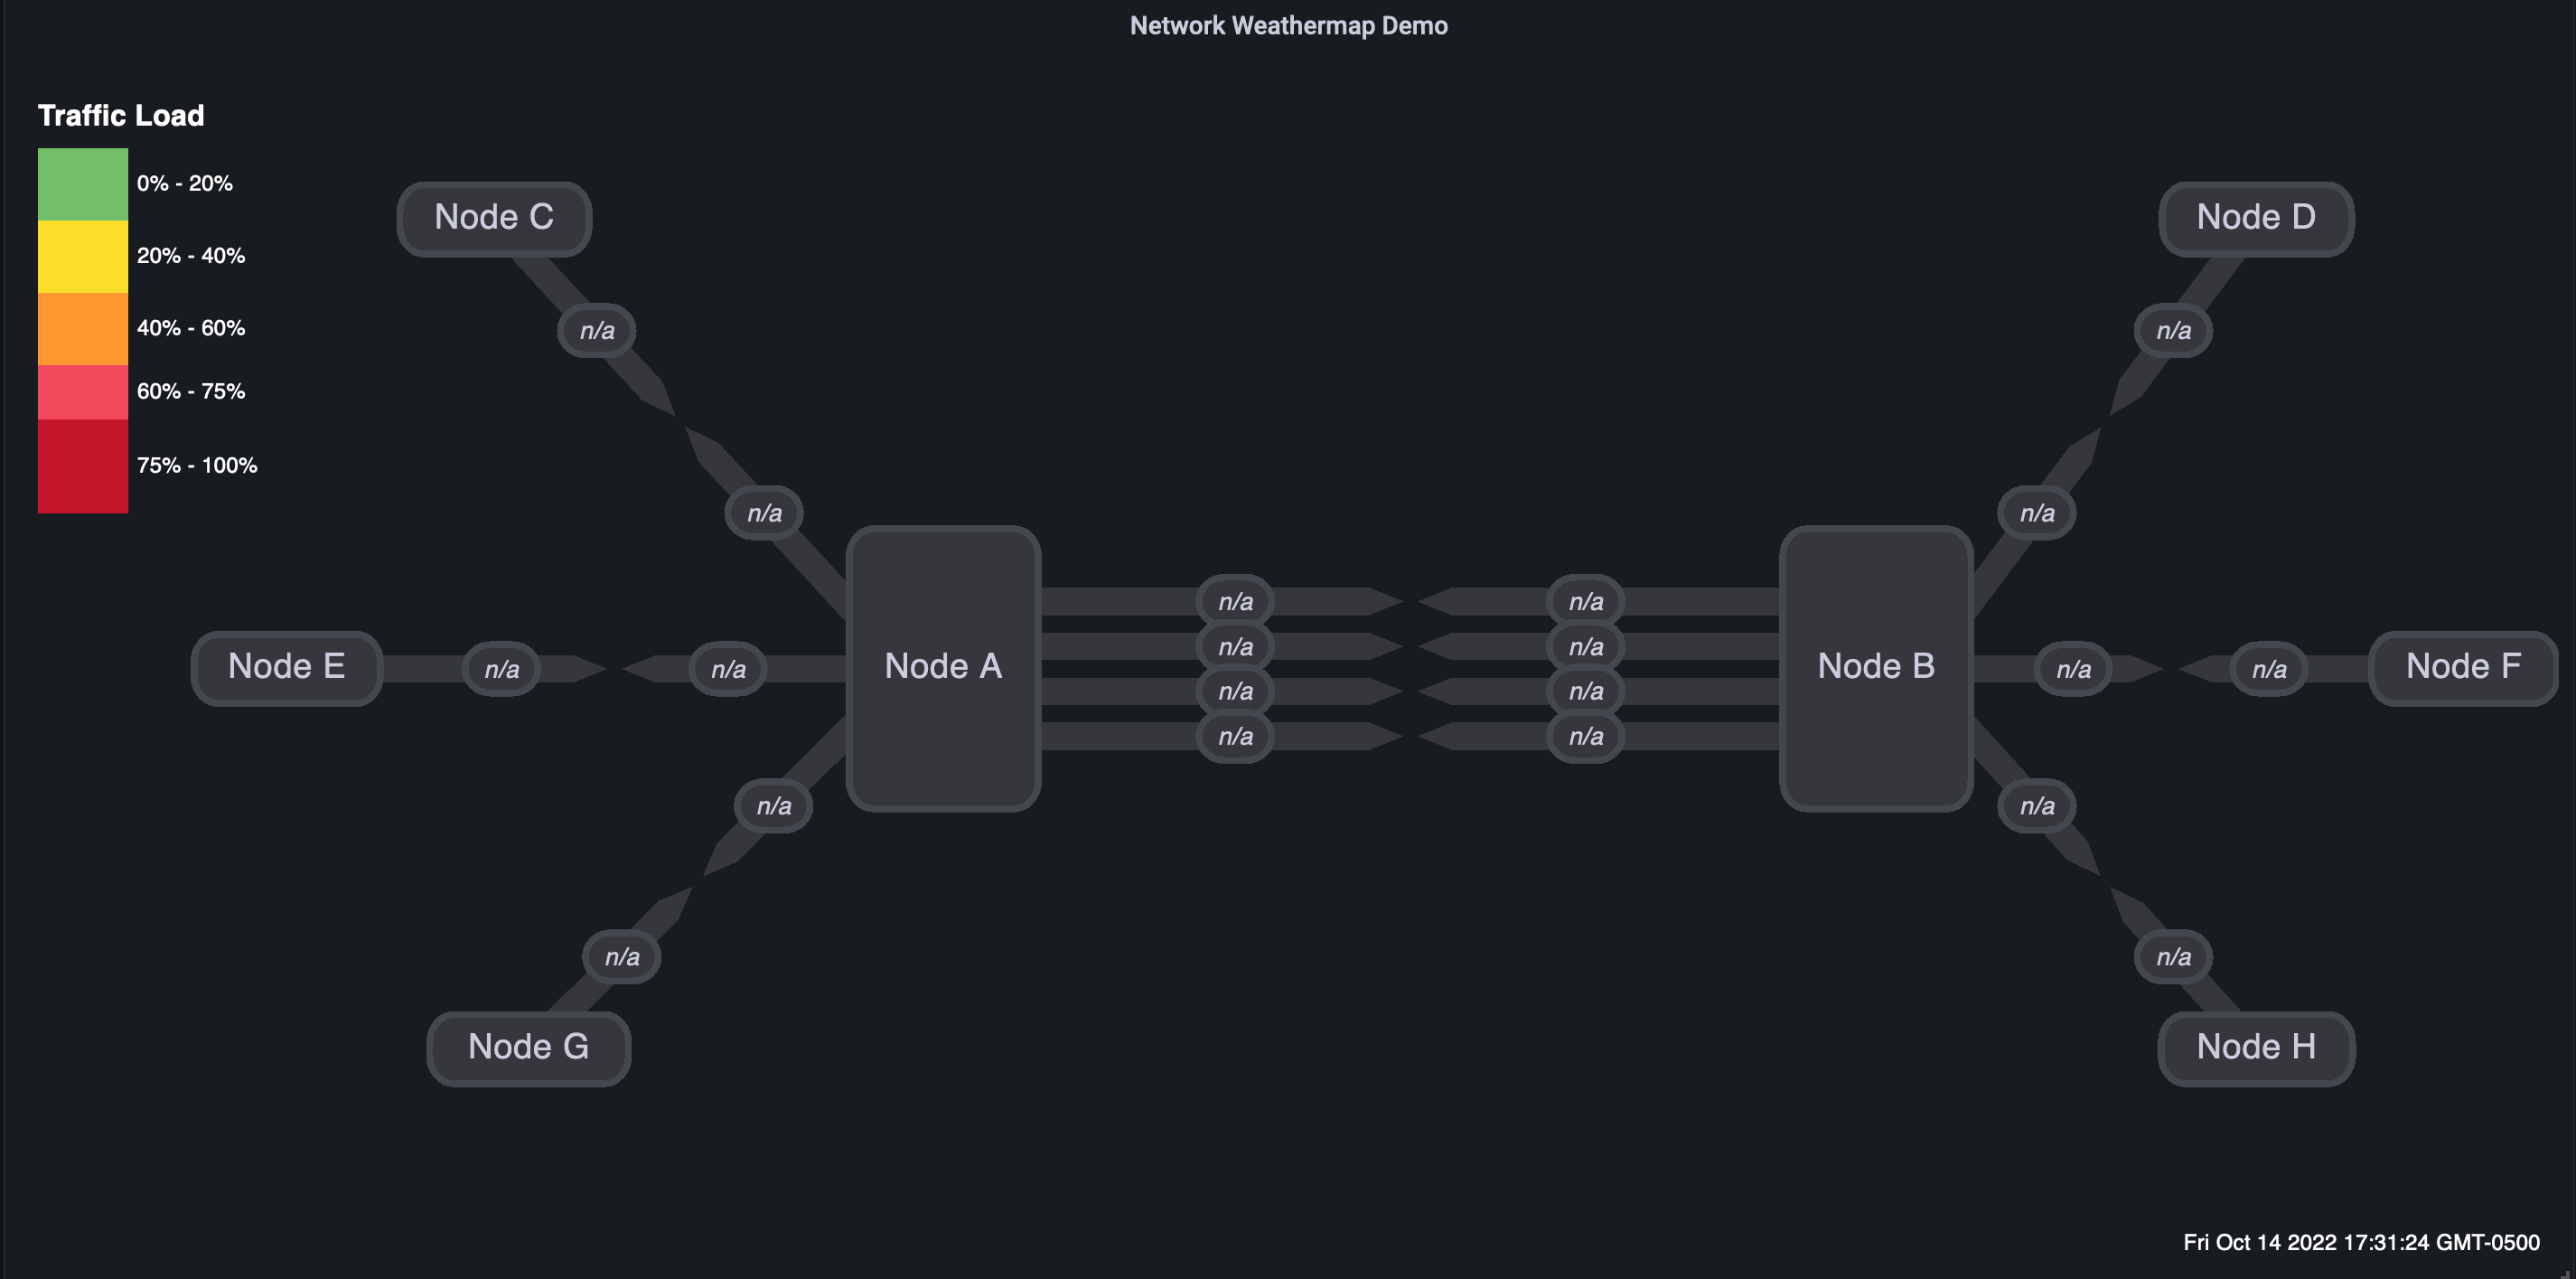
Example map Example map

How it works

Each link has two sides, A and Z, and each side is driven by one query from the panel:

  • A side shows traffic flowing A → Z (for example, bits sent on the A device's interface).
  • Z side shows traffic flowing Z → A (for example, bits received on the A device's interface).

Every side gets a bandwidth (a fixed number or another query), and the link segment is colored by the color scale — either percentage of bandwidth or absolute thresholds.

Nodes are the endpoints: label them, give them icons (networking, server, database, and computer icon sets are bundled), and optionally color them from a status metric.

Setting up a map

  1. Add the panel to a dashboard and add one query per link direction. Give each query a clear name or legend — you pick queries by name in the editor.
  2. Open the panel options and expand Edit Weathermap.
  3. Under Nodes, add your nodes, then drag them into position on the canvas (a snappable grid with alignment guides is available).
  4. Under Links, add a link, choose its A and Z nodes, and assign each side its query and bandwidth.
  5. Under Color Scale, define your thresholds — green/yellow/red utilization bands, or absolute values.
  6. Save the dashboard. The map updates with every dashboard refresh.

Feature highlights

  • Independent A/Z sides with per-side queries, bandwidth, labels, and direction labels (for example Inbound / Outbound).
  • Multiple parallel links between the same two nodes.
  • Curved routing with VIA points — double-click a link on the canvas to add one, right-click to remove.
  • Value display modes: last, average, minimum, maximum, or 95th percentile over the dashboard time range, with configurable decimal places and units.
  • Optional dynamic stroke width, animated traffic flow, and gradient coloring.
  • Port/interface labels so the physical circuit is visible on the map.

Nodes

  • Icons with adjustable size, padding, and constant spacing.
  • Status coloring from a metric: color the node border, background, or both, with configurable value-to-color threshold mappings.
  • Per-node dashboard links (open in the same or a new tab) for drill-down.

Tooltips

  • Hovering a link shows both directions with inbound/outbound graphs.
  • Add extra metric rows to link and node tooltips — errors, discards, latency, packet loss, or anything else you can query.

Panel

  • Pan, zoom, and multi-select with mouse or trackpad (macOS-compatible controls).
  • Timeline slider to replay link values across the selected time range.
  • Custom background color or image, adjustable fonts, and a movable, resizable color-scale legend.
  • One-click SVG export of the map.

Data sources

The panel reads standard Grafana data frames, so it works with Prometheus, InfluxDB, Graphite, Zabbix, MySQL/PostgreSQL, and any other data source that returns time series. Each link side expects a single numeric series.

Requirements

Grafana 11.0.0 or later.

Learn more

This plugin continues the archived knightss27 weathermap panel, modernized for current Grafana releases and licensed under Apache-2.0.

Install on Grafana Cloud

Plugins can be installed directly from within your Grafana instance or automated using the Cloud API or Terraform.

Learn more about plugin installation

For more information, visit the docs on plugin installation.

Changelog

All notable changes to this project will be documented in this file. See standard-version for commit guidelines.

1.6.0 (2026-07-09)

Features

  • metric-driven traffic animation — links can animate small moving dots showing traffic direction and intensity, derived entirely from the A/Z values and bandwidths you already query (no new queries, no packet capture). Utilization drives dot speed (20 + √u·100 px/s) and density (1 + round(u·7) dots); dots inherit the link's threshold color. Dots are native SVG animateMotion (compositor-only — no per-frame React re-render, no requestAnimationFrame). Off by default. Panel-level controls: master switch, respect OS reduced-motion (on), pause in edit mode (on), max animated links (100), and a built-in legend shown only while animation is active. Per-link Traffic Animation override (inherit / enabled / disabled). Timeline scrubbing pauses animation (live = animated). A down link (via its Status Query) replaces dots with static badges. New Traffic Animation guide, demo dashboard (WAN Demo — Animated Traffic Flow), and E2E coverage (#264, #273, PR #291)

Changed

  • down-link labels (only when animation is enabled) — when traffic animation is active for a link, a down status now labels both sides DOWN instead of showing a stale throughput number (the hover tooltip still exposes the real series and its history). This is scoped to the animation feature: maps that never enable animation render down links exactly as before (dashed line + last value), so existing status-query dashboards upgrade with no visible change (#273, PR #291)

Tooling

  • Grafana dashboard backup/restore utility (tools/grafana-backup.py) — a dependency-free (Python stdlib only) safety net for backing up your existing dashboards before installing this plugin or upgrading Grafana. Exports every dashboard as JSON with its queries and datasource references preserved, plus all data sources and folders and a manifest; idempotent restore writes them back. Works with token, basic-auth, or open/anonymous Grafana, and handles dashboards across mixed data sources (Prometheus/InfluxDB/Elasticsearch/Zabbix) (#293, PR #292)

Chores (not part of the plugin archive)

  • plugin-catalog validation — the demo exporter's Go directive is pinned to go 1.25.12 (patched crypto/tls line for GO-2026-5856) so the Grafana plugin validator's Go 1.26.4 / GOTOOLCHAIN=local scanner can load and scan the module; the Docker build uses golang:1.26-alpine (≥1.26.5, also patched). Note: the validator may still warn about GO-2026-5856 because its own scan toolchain (1.26.4) predates the 1.26-line fix (1.26.5) — that finding clears when Grafana updates their runner (#297, #298)

1.5.15 (2026-07-08)

Features

  • scale legibility: the utilization scale gets an optional explicit font color and an optional background box (subtle border, rounded corners) so it stays readable over background images or light map content; both unset by default, keeping the previous automatic contrast behavior (#278, PR #290)
  • larger nodes: the node padding sliders now go up to 200 (previously 50, which also snapped back typed values), so nodes can be sized for faceplate/background layouts (#279, PR #289)
  • node-z-index: each node now has an optional Z-Index field (next to X/Y) to control stacking order — higher values paint on top; blank keeps the default creation order, so existing maps are unchanged (#280, PR #287)

Bug Fixes

  • wide data frames bind every value field — Zabbix data alignment, Grafana join transformations, and SQL wide mode pack many named value fields into one frame; the panel previously bound only the first, leaving the rest unresolvable (n/a values, status stuck at down, missing dropdown entries). Every numeric field is now independently bindable across link values, query dropdowns, node status, and the tooltip graph; narrow frames behave byte-identically (#260, PR #263)
  • timeline-timestamp: the timeline slider no longer shows a cut-off unix timestamp — the slider is driven by a small position index and the readable, timezone-aware timestamp is shown in the label (#277, PR #285)
  • connection-label: toggling Use As Connection (BETA) no longer overwrites the node's label with C<n> — the label is preserved (#282, PR #286)
  • node-colors: a newly added node now gets its own colors object instead of sharing the first node's by reference, hardening against cross-node color edits (#281, PR #286)
  • gradient-arrow-tips: link gradient coloring now spans the full A→Z path and paints the arrow heads, removing the color break at the tips (#283, PR #284)

1.5.14 (2026-07-04)

Features

  • cloud provider icon set — 18 bundled icons (#215, PR #219): AWS, Azure, and GCP brand logos (Simple Icons, CC0) plus provider-badged device composites (cloud/aws-router, cloud/azure-firewall, ...) in a new Cloud picker group. The official architecture icon packs are not bundled for licensing reasons — scripts/fetch-cloud-icons.sh installs them onto your own Grafana, usable via a node's Custom icon URL
  • vendor icon set — 49 bundled icons (PR #190): 19 brand logos from the Simple Icons project (CC0) — Juniper, F5, Fortinet, Palo Alto Networks, MikroTik, Ubiquiti, Netgear, TP-Link, Huawei, SonicWall, Nokia, Ericsson, OPNsense, pfSense, OpenWrt, Dell, HP, Lenovo, Supermicro — plus 30 composite device icons (e.g. vendors/juniper-router, vendors/f5-load-balancer) combining Networking shapes with vendor corner badges. New Vendors group in the node icon picker; Icon Reference regenerated (1046 icons, 11 sets)

Bug Fixes

  • panel crash resilience for malformed or partial weathermap options — missing/partial options.weathermap, links referencing deleted nodes, and overlapping nodes (zero-length arrow vectors) no longer crash the panel; options are normalized before any dereference, malformed links are skipped, and SVG geometry can no longer contain NaN (#198, PR #206)
  • render purity — the options-schema migration no longer mutates the incoming saved options object, and neither the panel nor the editor calls onOptionsChange/onChange during render; migrated options are persisted from guarded effects after commit (#199, PR #210)
  • numeric inputs never store NaN — blank or mid-edit numeric fields (positions, panel size, zoom, offsets, icon sizes, thresholds, bandwidth) keep the previous valid value instead of writing NaN into saved options; 0 remains valid; the color-scale editor no longer leaks NaN into options through shared local edit state (#200, PR #211)
  • timeline and state synchronization — the pan offset resyncs when saved options change externally (dashboard reload, another session); VIA-chain data resolution no longer mutates rendered link state (multi-VIA chains included); node status now replays the timeline scrub position with raw step-hold sampling, matching link values during incident replay (#201, PR #212)
  • self-link anchor accounting — removing a self-link now decrements its shared anchor by 2 (mirroring add) and clamps at 0, so link spacing no longer drifts on affected nodes (#202, PR #209)
  • SVG export hardening — relative, root-relative, and absolute icon URLs resolve correctly; data:/blob: hrefs (any scheme casing) are left untouched; a failed or CORS-blocked icon fetch keeps the original href instead of aborting the whole export (#203, PR #207)
  • current-version partial configs no longer crash — a hand-edited or provisioned map with version: 14 but missing nested settings (or missing renderer-required leaves like panel.backgroundColor, panel.zoomScale, stroke/label colors) now repairs through the defaults deep-merge in both the panel and the editor (#224, #232, PRs #228, #234)
  • all editor and interaction updates are immutable — pan/drag persistence, node selection state, VIA insert/remove, and every form handler (116 sites) now deliver new object references instead of mutating the saved options in place; the form test harnesses deep-freeze props.value so the class stays closed (#238, PR #239) (#225, #233, PRs #229, #235)
  • no more React NaN warnings from blanked threshold fields — non-finite drafts render as an empty input (#226, PR #230)
  • deterministic mapping for duplicate display names — when two series share a display name, link values now resolve from the first frame, consistently with the query dropdown and node status, instead of silently taking whichever duplicate arrived last (#204, PR #213)

Chores (not part of the plugin archive)

  • E2E now also runs on pull requests that touch the E2E surface (tests/**, Playwright config, the workflow) while staying weekly/manual for ordinary PRs (#227, PR #231)
  • E2E baseline tests (#38, PR #216): Playwright/@grafana/plugin-e2e coverage for the core editor workflow — panel renders, add node, add link between two nodes, threshold change updates the color-scale legend — verified in CI against Grafana 11.0.0 and latest; version-tolerant visualization-picker driving, GRAFANA_URL/PW_CHANNEL targeting, and npm run e2e:local for the anonymous-admin testing stack. Includes stable inputIds on the link editor side selects (#167 pattern)
  • multi-datasource demo & docs — the testing/ stack now runs the same simulated WAN metrics through Prometheus, InfluxDB, Elasticsearch, and a full Zabbix 7.0 server simultaneously (one bridge, identical series names), with per-source WAN Demo — Utilization dashboards rendering the byte-identical map; a new Data Sources docs page covers per-source queries, the display-name binding rule, every deviation discovered (Influx value <series> naming, the Elasticsearch 65536-bucket limit, Zabbix data alignment and API memory/trends), and a live screenshot per source; frame-shape unit tests lock value/name resolution for each source's real frames (#253, #256, PRs #254, #255, #257, #258, #259, #261)
  • dependency security — npm audit is clean: the dompurify override tracks the patched ^3.4.11 line, js-yaml DoS advisories resolved in both dependency paths, and the transitive @opentelemetry/core/protobufjs advisories fixed without bumping the @grafana/* packages (PRs #237, #242)
  • CI hardening — dedicated E2E workflow (weekly + manual) against Grafana 11 and latest, broader push path filters (including .config/**), consistent dependency installs between test and release, and a PR-time plugin archive layout check that reads the plugin id from dist/plugin.json (#205, PR #208)

1.5.13 (2026-07-04)

Bug Fixes

  • query dropdown entries were indistinguishable when a single query returned many series — the concise refId: fieldName labels introduced for #49 collapsed to identical A: Value entries for multi-series Prometheus responses. Labels now show short display names (custom legends, label sets) verbatim, keep long unique names concise, and expand to the full label set whenever concise labels would collide; stored selections are unchanged (#191, PR #195)

Chores (not part of the plugin archive)

  • regression-hardening test suite — editor dropdown component tests, a duplicate-DOM-id guard, options-migration round-trip guarantees, a hostile-data render matrix, and a dist packaging verification step in CI and the signed release pipeline (PR #196)
  • least-privilege GITHUB_TOKEN permissions across CI workflows, resolving the open CodeQL alerts (PR #194)
  • docs site: step-by-step Getting Started/Links screenshots and the Dracula color scheme (PRs #192, #193)

1.5.12 (2026-07-03)

Features

  • dense-map rendering/UX (#179, PR #184): six opt-in, default-off options — single-direction links (one full-length line and a single arrow for one-way flows like power feeds), hover highlight (the hovered link's whole VIA chain stays bright while unrelated links fade), label collision avoidance, zoom-dependent value labels, a built-in status legend, and per-node font size/bold overrides
  • icon library — 997 bundled icons across 10 sets (PRs #181, #183): country flags in circle (265) and square (257) styles, rack construction parts incl. fiber LC/SC ports and panels (18), Kubernetes + Apache project logos (9), programming languages (22), aerospace symbols (5) — with a generated Icon Reference docs page listing every icon

Bug Fixes

  • empty data frame crashed the panel on maps with node status queries — the status-color lookup resolved frame names unguarded; one transient empty series (fresh exporter, scrape gap, regex matching nothing) latched the error boundary until reload. Status values now also read via the value-field helper instead of assuming field order (#178, PR #186)
  • status-legend overlay was painted over by the map SVG — missing z-index (PR #185)

Chores (not part of the plugin archive)

  • demo/testing: multi-device rack cabling with redundant power feeds (#177), the Interactive Rack View showcase for the new rendering features, docs use-cases 11–12, and the icon reference page

1.5.11 (2026-07-03)

Chores

  • plugin-metadata: the description shown in Grafana's visualization picker now credits the author — "Next-generation, actively maintained network weathermap by Tamir Suliman…" (PR #172)
  • attribution: added a NOTICE file (fork copyright, preserved upstream credit to Seth Knights, demo world-map asset provenance) that now ships inside the plugin archive per Apache-2.0 §4(d), the fork's copyright line in the LICENSE appendix, and a CITATION.cff enabling GitHub's "Cite this repository" button (PR #173)
  • testing/docs (not part of the plugin archive): simulated-WAN exporter and nine scenario demo dashboards with a step-by-step use-cases guide (#170, PR #171)

1.5.10 (2026-07-02)

Bug Fixes

  • editor-form-ids: explicit unique ids on the node/link picker Selects, the per-node icon Select, and the color-scale threshold inputs. Grafana 13's options pane assigns the options-item id to bare controls, which produced duplicate form field ids on Grafana 13; no behavior change on Grafana 11/12. Verified in-editor on Grafana 11.0.0, 12.0.0, 12.3.8, and 13.1.0 (#167, PR #168)

1.5.9 (2026-07-02)

Addresses all required changes from the Grafana plugin catalog review of v1.5.6 (#162).

Bug Fixes

  • panel-editor: opening the panel editor on dashboards saved before options schema v14 no longer throws Cannot read properties of undefined (reading 'backgroundColor') on Grafana 11.0.0 — the editor forms now render the migrated options directly instead of waiting for the migration to round-trip through onChange (#162, PR #163)
  • node-editor: the Status Color Target control keeps its selected indicator when switching between Border, Background, and Both, and the browser no longer reports duplicate form field ids — radio groups now use stable deterministic ids and immutable option updates (#162, PR #164)

Documentation

  • catalog-readme: new user-focused README at src/README.md shown in the Grafana plugin catalog — what the plugin does, use cases, setup walkthrough, and screenshots; the root README remains the GitHub-facing document (#162, PR #165)

1.5.8 (2026-07-02)

Features

  • timeline-slider: an optional timeline slider (Panel Options → Link Options → "Timeline Slider") lets viewers scrub through the selected dashboard time range and see link values as they were at that moment — for incident retrospectives, trend analysis, and capacity planning. Off by default; a "Live" button returns to the latest/aggregate value (#158, PR #159)

1.5.7 (2026-07-02)

Bug Fixes

  • macos-interactions: pan, zoom, and multi-select now work on macOS. The Cmd (⌘) key is accepted everywhere Ctrl was used (viewport pan, node-drag suppression, multi-select), and zoom uses the dominant scroll axis so macOS Shift+scroll (remapped to horizontal) and trackpad gestures still zoom. Linux/Windows behaviour (Ctrl/Shift/middle-mouse, vertical scroll) is unchanged (#57, PR #156)

1.5.6 (2026-07-02)

Features

  • via-canvas-editing: manage VIA (intermediate waypoint) points directly on the canvas in edit mode — double-click a link to insert a VIA (splitting the link and preserving each side's query data), drag the VIA like any node to reposition it, and right-click a VIA to remove it and merge the segments back together. No change to the underlying connection-node model (#67, PR #153)

Bug Fixes

  • tooltip-consistency: custom link tooltip metric rows now use the per-side direction labels instead of hardcoded "Inbound"/"Outbound" wording, and a node tooltip no longer lingers with stale data if a drag begins while it is shown; the link dashboard-link click no longer fires while inserting a VIA in edit mode (#146, #147, PR #154)

1.5.5 (2026-07-02)

Features

  • value-display-modes: the panel's "Value Display Mode" can now resolve each metric as an aggregate across the selected dashboard time range — Average, Min, Max, and 95th Percentile are available alongside the existing Last (most recent point). Useful for capacity-planning views where a single-point snapshot is misleading (#58, PR #151)

1.5.4 (2026-07-02)

Features

  • node-tooltips: nodes now support hover tooltips showing additional metric values (latency, packet loss, CPU, or any bound query) — configure per-node metrics (label, query, units) in the node editor's Tooltip section (#72, PR #146)
  • link-direction-labels: optional per-side "Direction Label" lets you explicitly name which side of a link is inbound vs outbound; the label is used in the hover tooltip, removing the implicit A/Z ambiguity (#70, PR #147)
  • arrow-meeting-point: new per-link "Arrow Meeting Point (%)" slider shifts where the two directional arrows meet along a link, instead of the fixed 50% midpoint — useful for asymmetric links and vias (#62, PR #148)
  • background-follow-map: new "Move With Map" toggle attaches the panel background image to the map canvas so it pans and zooms with the nodes and links, for backgrounds depicting buildings, zones, or floor plans (#64, PR #149)

1.5.3 (2026-07-02)

Bug Fixes

  • security: pin the transitive form-data dependency to 4.0.6 via an npm overrides entry, resolving the HIGH-severity CRLF-injection advisory GHSA-hmw2-7cc7-3qxx (affecting >=4.0.0 <4.0.6) that osv-scanner flagged in package-lock.json. form-data is a dev-only transitive dependency (via jest-environment-jsdomjsdom) and is not part of the shipped plugin bundle; npm audit now reports 0 high/critical vulnerabilities. No plugin runtime changes from 1.5.2.

1.5.2 (2026-07-01)

Features

  • node-link-tab: new per-node Open Link in Same Tab toggle (Node.openInSameTab) in the node editor — when enabled, clicking a node's dashboard link navigates in the current tab (_self) instead of opening a new one (_blank); URL sanitization is unchanged and the default (off) preserves the existing new-tab behavior (#61, PR #136)

1.5.1 (2026-07-01)

Bug Fixes

  • testing: repair the testing/ docker-compose stack — bump the exporter build image to golang:1.25-alpine to match its go.mod (the previous 1.21 image failed the build and prevented the stack from starting), and ensure the Grafana provisioning and dashboard files are readable inside the container regardless of the host checkout umask. docker compose up --build now starts Grafana with the plugin pre-loaded and sample data provisioned. No plugin runtime changes from 1.5.0.

1.5.0 (2026-07-01)

Features

  • react-19: replace the react-draggable findDOMNode fallback with an explicit nodeRef, fixing a TypeError: ReactDOM.findDOMNode is not a function crash on Grafana builds running React 19 while keeping node dragging fully functional on older versions.

Bug Fixes

  • security: validate and sanitize all user-provided URLs before use — dashboard links, custom node icon URLs, and the panel background image URL. Only safe relative Grafana paths and http:///https:// absolute URLs are accepted; unsafe schemes (javascript:, data:, file:, vbscript:, blob:, protocol-relative //, and any other scheme) are rejected at input time and again at navigation/render time, preventing script execution via window.open or image sources.
  • export: guard against a missing SVG element in the SVG export path so the panel editor no longer crashes when the expected element is not present.

Metadata

  • rename the plugin display name to Network Weathermap NG and clarify the description as the actively maintained next-generation continuation, distinguishing it from the deprecated knightss27-weathermap-panel plugin.

1.4.7 (2026-06-10)

Features

  • node-color-metric: nodes can now be colored dynamically based on a metric query value — threshold mappings in the node Status section assign colors when the query value meets or exceeds a threshold (highest matching threshold wins), replacing the previous exact-value match; a new Color Target toggle (Border / Background / Both) controls which part of the node is colored, enabling full background fill coloring for CPU utilization, temperature, availability score, and similar metrics; all changes are backward compatible (existing status queries and StatusDown color behavior unchanged) (#68)

1.4.6 (2026-06-10)

Features

  • tooltip-metrics: link tooltip now supports additional metric rows (errors, discards, drops, latency, or any metric) — a new "Tooltip Extra Metrics" section in the link editor lets operators add any number of named metrics, each with an optional inbound query, outbound query, and independent unit formatter; added metrics appear as extra rows in the hover tooltip below the throughput section, resolved live from the panel's data frames (#73)

1.4.5 (2026-06-10)

Features

  • parallel-links: support multiple links between the same two nodes with independent visual paths — a per-link "Link Offset" field (in the link editor, Link Options section) shifts the line perpendicularly to the A→Z direction; set positive/negative values on each parallel link to spread them apart; arrows, labels, and gradient coloring all follow the offset line correctly; zero or blank offset (default) preserves current straight-line behavior (#63)

1.4.4 (2026-06-10)

Features

  • link-decimals: new global "Link Value Decimal Places" setting in Panel Options → Link Options — sets the number of decimal places for all link throughput labels (value text, bandwidth text, and percentage text); leave blank for automatic precision (existing behavior unchanged) (#66, PR #127)

1.4.3 (2026-06-10)

Features

  • oversubscribed-scale: color scale thresholds above 100% now work correctly for oversubscribed links — legend band sizing uses a dynamic ceiling (max(101, highest_threshold + 1)) instead of a hardcoded 101, fixing broken proportions when any threshold exceeds 100%; top-band label now shows X%+ to indicate the color applies at or above that threshold (#65, PR #125)

1.4.2 (2026-06-10)

Features

  • template-variables: Grafana dashboard variables ($var, ${var}) are now resolved at draw time across all user-entered string fields — node labels, node/link status queries, node/link dashboard links, link A/Z throughput queries, and link A/Z bandwidth queries; enables dynamic multi-site maps, variable-driven queries, and variable-based dashboard links without duplicating panels (#77, PR #123)

1.4.1 (2026-06-10)

Features

  • link-port-labels: configurable A-side and Z-side port/interface labels on links — enter interface names (e.g. ge-0/0/0) per side in the link editor; labels render adjacent to the link line at 25% from each endpoint, rotated to follow the link direction (#71, PR #119)
  • link-status: per-link up/down status indicator — assign a status query to any link; when the value is 0 or absent the link renders in a configurable down color with a dashed stroke; optional blink animation draws attention to down links; overrides gradient/flow-animation rendering while down (#56, PR #120)
  • absolute-scale: color scale mode toggle (Percentage / Absolute Value) — in absolute mode, threshold values are compared directly against raw metric values instead of percentage of max bandwidth, enabling dBm, SNR, latency, and other non-percentage scales; the color scale legend adapts to show value ranges; backward-compatible (existing configs default to percentage mode) (#60, PR #121)

1.4.0 (2026-06-10)

Features

  • node-status: configurable status value mappings per node — map any query value to a border color (e.g. Mikrotik: 1=UP/green, 2=DOWN/red, 3=Testing/yellow); replaces the binary <1 = down rule when mappings are configured; existing nodes with no mappings are unaffected (#75, PR #116)
  • link-icon-boundary: new per-node "Attach Links to Icon Boundary" toggle (useIconBoundaryForLinks) — when enabled, link attachment points shift to the icon edge instead of the label-rectangle edge for nodes with external icons (drawInside: false), eliminating visual pass-through on large icons (#78, PR #115)
  • link-visualization: three new link display options — dynamic stroke width (scales with bandwidth utilization), flow animation (animated dashes showing traffic direction), and gradient coloring (per-link SVG gradient blending A-side and Z-side scale colors) (#79, PR #114)
  • node-enhancements: label visibility toggle (show/hide node label independently of node), duplicate node button (copies node with offset position and cleared anchors), icon aspect-ratio lock toggle in node editor (#80, PR #113)

1.3.1 (2026-06-10)

Bug Fixes

  • plugin.json: lower minimum Grafana dependency from >=12.0.0 to >=11.0.0 — levitate API compatibility checks pass for Grafana 11.0.0 and above; the >=12.0.0 restriction was overly conservative

1.3.0 (2026-06-10)

Chores

  • ci: switch release workflow to grafana/plugin-actions/build-plugin with provenance attestation (attestation: true) and GRAFANA_ACCESS_POLICY_TOKEN; drop deprecated GRAFANA_API_KEY; fixes no-provenance-attestation Grafana validator warning
  • plugin.json: add sponsor link; fixes sponsorshiplink Grafana validator warning
  • testing/exporter: upgrade golang.org/x/sys to v0.44.0; fixes GO-2026-5024 (govulncheck module-level finding, Windows integer overflow)

1.2.0 (2026-06-09)

Bug Fixes

  • query-matching: links intermittently showed n/a despite valid query data — getDataFrameName was not passing allFrames to getFieldDisplayName, so Grafana could not disambiguate multiple series sharing the same field name; frame ordering (non-deterministic between refreshes) determined which series matched (#54, PR #102)
  • performance: panel editor lag and slow re-render on large weathermaps — generateDrawnLink rebuilt the full data-frame value array from scratch for every link, O(links × frames) per refresh; replaced with a useMemo-cached Map<name, value> computed once per data change, reducing to O(frames) total (#47, #48, PR #103)
  • tooltip-graph: mini graph in link tooltip showed flat line or incorrect time axis — two root causes: (1) let copy = frame was a reference copy that permanently mutated field configs in data.series; (2) tweakScale/tweakAxis ran on the time field as well as value fields, distorting the x-axis range and applying the bps formatter to time labels (#55, PR #104)

1.1.3 (2026-06-09)

Chores

  • replace nodejs.org badge link in README.md with CONTRIBUTING.md link
  • upgrade testing/exporter Go dependencies to resolve govulncheck CVEs (GO-2022-0322, GO-2026-5037, GO-2026-5039)

1.1.2 (2026-06-09)

Bug Fixes

  • security: add noopener,noreferrer to all window.open() calls — prevents tab-nabbing vulnerability on dashboard link clicks (#98)
  • api: replace direct window.location access with locationService.getSearch() from @grafana/runtime (#98)

Chores

  • remove debug console.log calls from utils.ts and WeathermapBuilder.tsx
  • move developer setup docs to CONTRIBUTING.md; fix relative LICENSE link in README.md

1.1.1 (2026-06-09)

Security

  • resolve all npm audit CVEs — 0 vulnerabilities remaining (#96)
    • form-data critical — resolved via npm audit fix
    • protobufjs critical — resolved via npm audit fix
    • serialize-javascript high (build-time) — pinned to 7.0.5 via npm overrides
    • dompurify high (Grafana peer dep) — pinned to 3.4.8 via npm overrides
    • js-cookie high (Grafana peer dep) — pinned to 3.0.8 via npm overrides
    • uuid moderate — bumped direct dep to ^11.1.1; scoped override for @grafana/ui

1.1.0 (2026-06-09)

Bug Fixes

  • color-scale: threshold labels overlapped when thresholds were close together due to hardcoded line-height: 0px — now uses line-height: normal with white-space: nowrap (#44)
  • export: JSON export button was commented out and unavailable — restored with full-config export using JSON.stringify (#52)
  • link-editor: query dropdown showed only 2 entries due to missing fields.length < 2 guard causing frames to be silently skipped; added deduplication and menuShouldPortal (#42, #46)
  • link-editor: query dropdown labels showed full Grafana metadata strings (refId + frame name + all labels) — now displays concise refId: fieldName format while preserving the full name as the stored value (#49)
  • value-extraction: Prometheus rate() and increase() queries produced NaN or negative values — added backwards scan for last valid value and clamped negatives to 0 in both last-value and average modes (#51)
  • tooltip: tooltip appeared directly on top of hovered link with no cursor offset and could overflow panel edges — now offsets 14px right/10px up from cursor and flips direction near panel edges (#43)
  • strokes: link stroke lines randomly disappeared after zoom, pan, or time range change — two root causes fixed: Math.max(...[]) returning -Infinity for empty anchor arrays (producing non-finite SVG coordinates), and zoom handler mutating options.weathermap in-place bypassing React change detection (#45, #50)
  • datasource-compat: metrics from Check MK and other non-standard datasources showed n/a because the plugin hardcoded fields[1] for value extraction; now finds the first FieldType.number field with fallback to index 1 (#53)

CI / Infrastructure

  • upgraded all GitHub Actions workflows from Node.js 20 to Node.js 24 ahead of the GitHub Actions forced cutover on 2026-06-16
  • switched GitHub Pages deployment from peaceiris/actions-gh-pages to official actions/deploy-pages — surfaces live site URL in the repo sidebar Deployments section
  • added FORCE_JAVASCRIPT_ACTIONS_TO_NODE24: true to all four workflows

1.0.0 (2025-02-25)

Modernized fork of the original knightss27-weathermap-panel, now maintained by Tamir Suliman.

Features

  • Grafana 10–12.x support: upgraded all @grafana/* dependencies to v11, tested on Grafana 12.0.0
  • React 18: migrated from React 17 to React 18
  • TypeScript 5.x: upgraded from TypeScript 4.x
  • Node 20+: minimum Node.js version raised from 14 to 20
  • Playwright E2E: replaced Cypress with @grafana/plugin-e2e + Playwright
  • Provisioned test environment: docker-compose setup with Prometheus + exporter for reviewers

Code Modernization

  • migrated emotion@emotion/css across all components
  • replaced deprecated stylesFactoryuseStyles2 in all 8 component files
  • replaced deprecated Vector.get() API → direct array indexing
  • removed all @ts-ignore comments, added proper type assertions
  • updated plugin identity to tamirsuliman-weathermap-panel
  • modernized GitHub Actions release workflow

0.4.3 (2023-07-18)

Bug Fixes

  • add try-catch calls to get series names (#46) (192dc26)

0.4.2 (2023-07-05)

Features

Bug Fixes

  • display all data on connection links (580206b)
  • link labels now hoverable (f6d1ea3)
  • temp changes no longer written to state (#61) (cb6d3e3)
  • update grafana dependency (323eaec)

0.4.1 (2023-07-05)

Features

Bug Fixes

  • display all data on connection links (580206b)
  • link labels now hoverable (f6d1ea3)
  • temp changes no longer written to state (#61) (cb6d3e3)

0.3.6 (2023-03-26)

Features

  • customizable tooltip graph scaling (#50) (979868b)

Bug Fixes

  • 0 values no longer treated as null (#51) (56481a3)
  • do not assume field existence (#46) (f895bea)
  • missing bandwidth queries default back to 0 (612973e)
  • overwrite last values when query is null (#47) (f34afd2)
  • timestamp uses correct end of timerange (56b8d34)

0.3.5 (2023-01-25)

Features

0.3.4 (2022-12-13)

Features

Bug Fixes

0.3.3 (2022-10-24)

Bug Fixes

  • use Grafana's dataframe display method (fecbf17)

0.3.2 (2022-10-23)

Features

Bug Fixes

0.3.1 (2022-08-20)

Bug Fixes

0.3.0 (2022-08-19)

Features

Bug Fixes

  • basic setup correctly adds link (d3fabd7)
  • clearing all links resets node height/width (809b914)

0.2.8 (2022-06-16)

Features

  • dashboard linking on link click (#9) (74005ed)

Bug Fixes

  • file upload limits (d1f5d48)
  • image upload error handling (a26ce9b)
  • state changes merged for backwards compatability (cdc8957)
  • stop zooming outside of edit mode (29a7439)

0.2.7 (2022-05-28)

Features

Bug Fixes

  • update bug report template (9729460)

0.2.6 (2022-05-10)

Bug Fixes

  • JSON export no longer breaks map state (35eac8d)

0.2.5 (2022-05-04)

Bug Fixes

  • update plugin.json grafanaDependency (6c3505e)

0.2.4 (2022-04-23)

Features

Bug Fixes

  • assume last node color for new nodes (4369bd0)
  • grid guides consistently viewable (ab8ae51)
  • place new nodes at center of view (94d702e)

0.2.3 (2022-03-12)

Bug Fixes

0.2.2 (2022-02-27)

Features

Bug Fixes