
NetBox data source for Grafana
Enrich your observability data with infrastructure context from NetBox.
Most network and infrastructure telemetry arrives as bare identifiers: a device name, an
interface, an IP. NetBox knows what those identifiers mean: which site and rack a device
lives in, its role, platform, tenant, serial, lifecycle, the cable on the other end. This
data source brings that context into Grafana so you can join it onto metrics and logs
from Prometheus, Loki, Mimir, InfluxDB or anything else, turning device="leaf1" into
"leaf1, an Arista switch in DM-Akron, rack R-12, owned by the NetEng team."
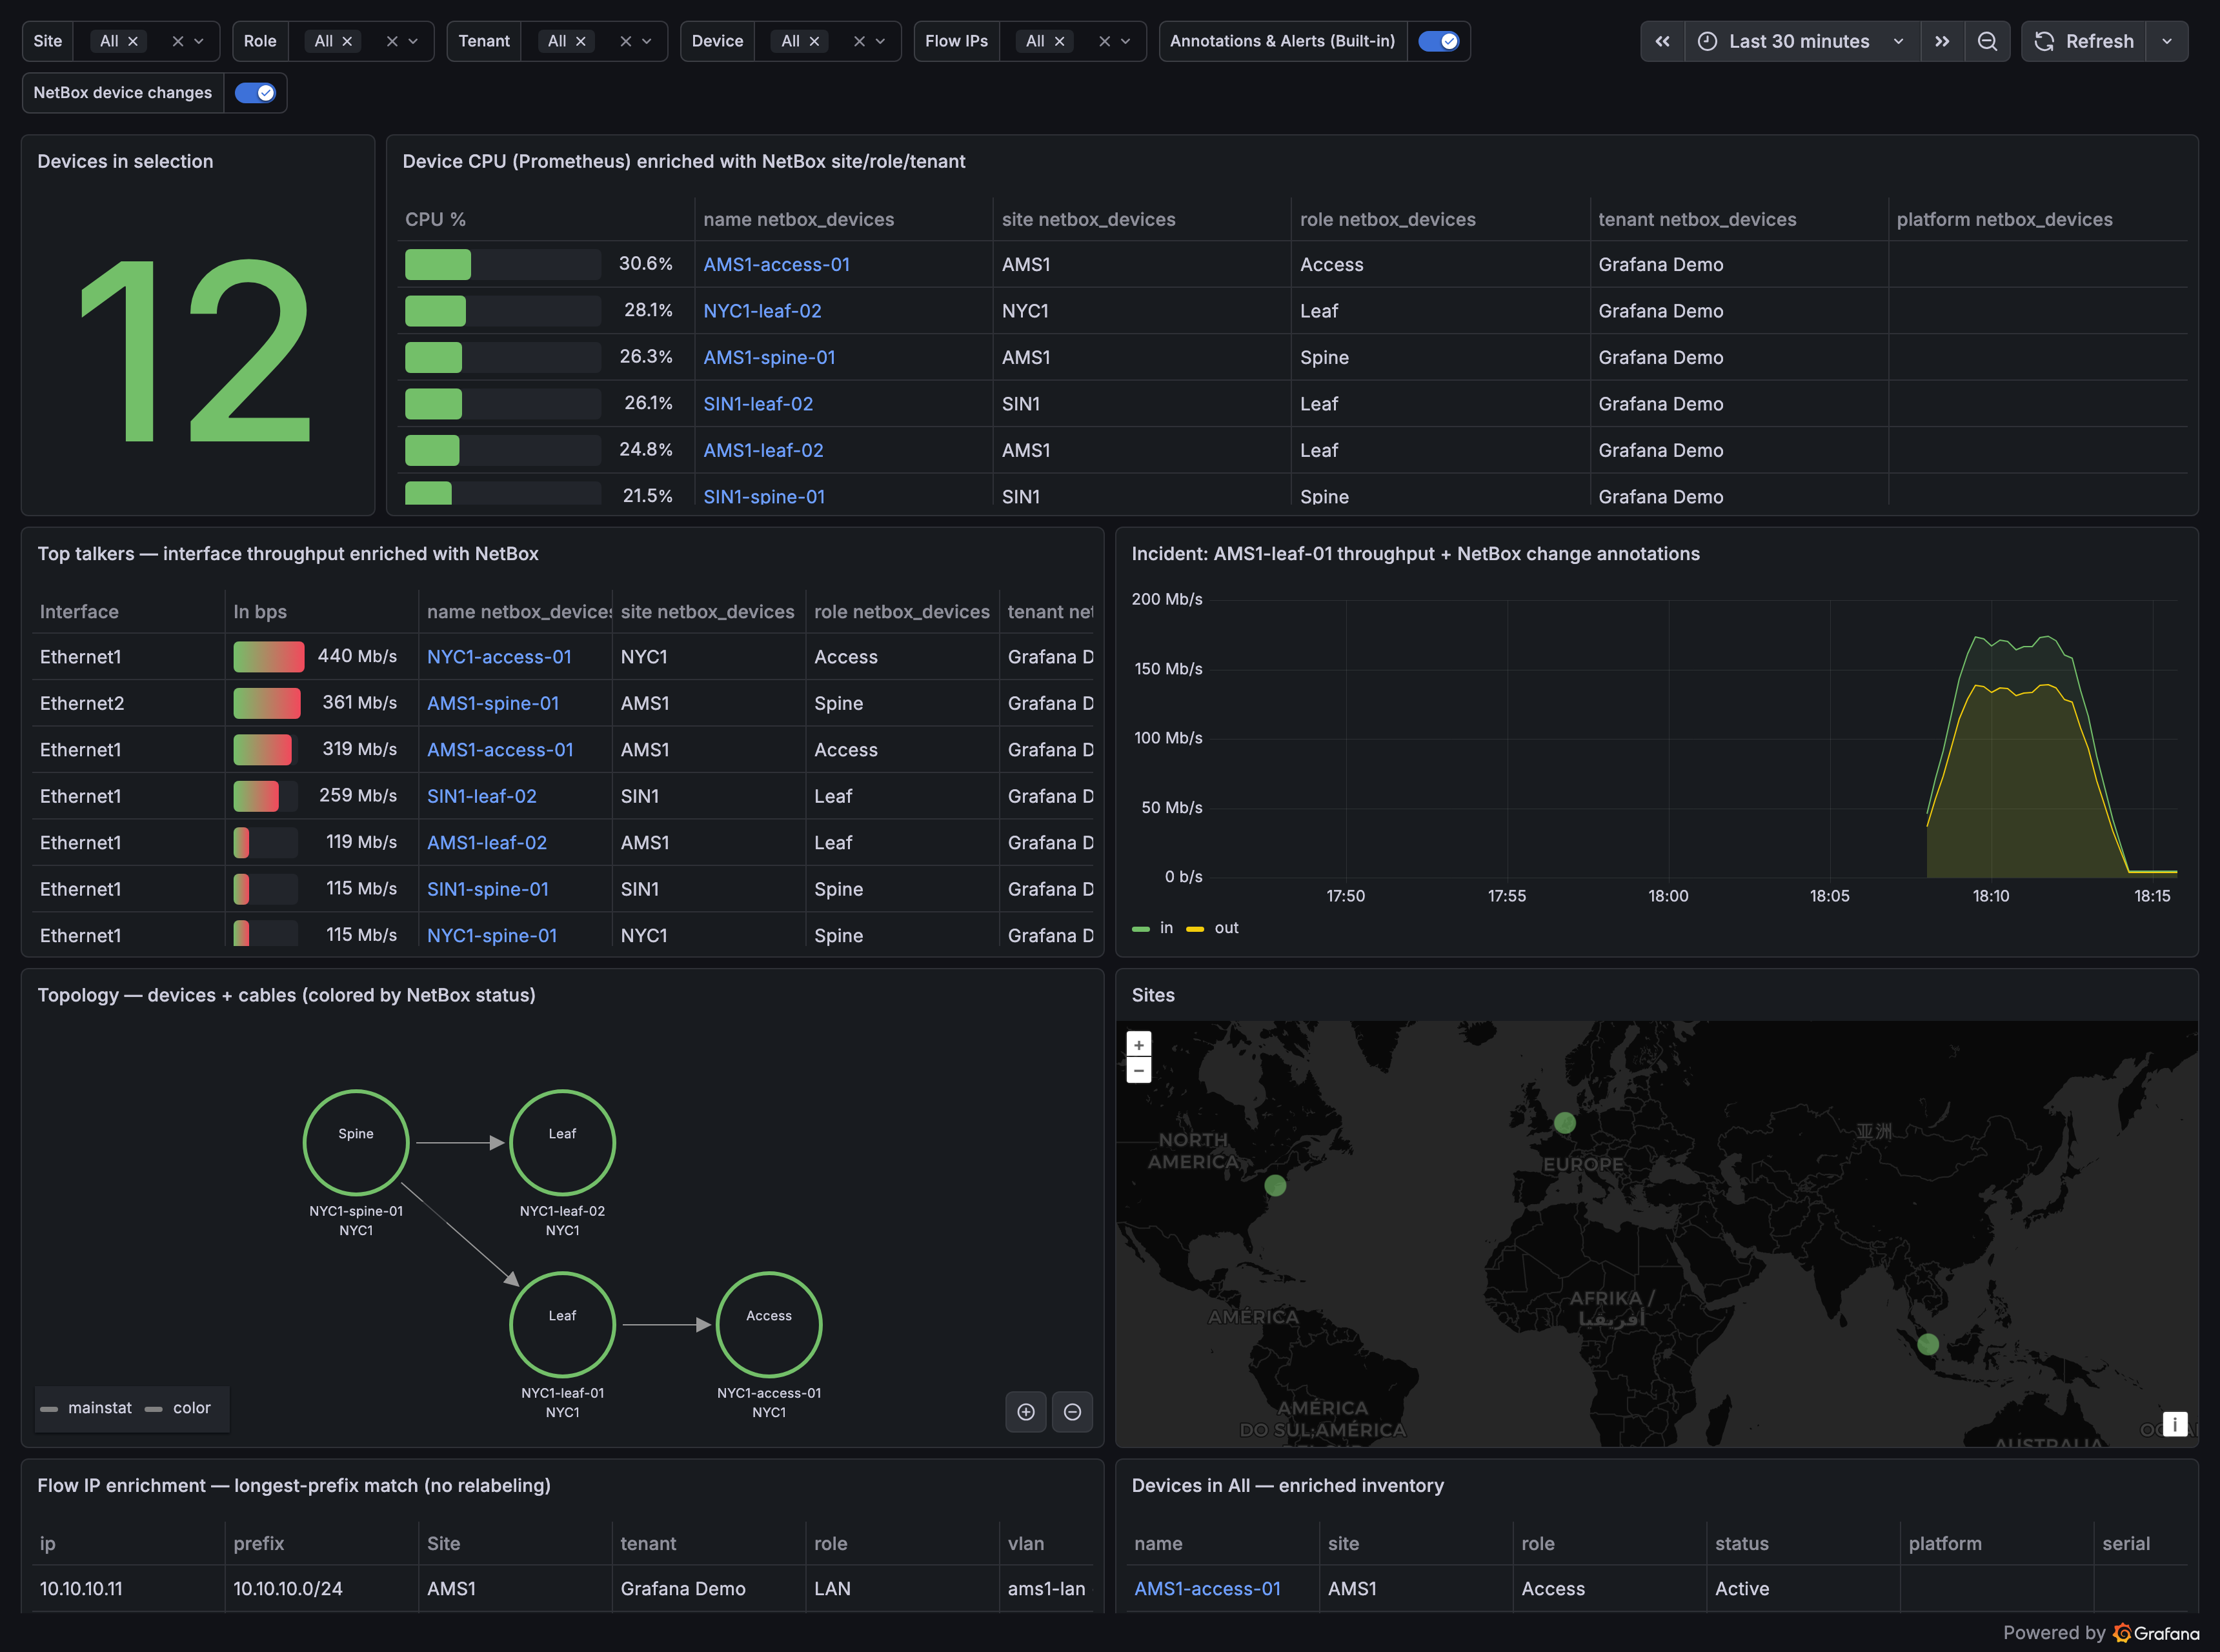
Features
- Joinable context tables. Query any NetBox object type and get a flat, table-shaped
result keyed on
name/address/deviceso Grafana's Outer join transformation lines NetBox columns up against your metric series. - Configurable join keys. Per query, derive extra key columns (rename + transform: lowercase, strip-domain, IP-host, interface-short-name, regex) so a NetBox field matches your metric label with no extra Grafana transforms. Add several to reuse one query different ways. See docs/JOIN-KEYS.md.
- IP enrichment (address, device and longest-prefix match). Resolve arbitrary observed IPs to their NetBox address record, the interface it's assigned to, and the owning device — including whether it's that device's primary IP — falling back to the containing prefix's site/tenant/role when the address isn't individually registered. It is the one enrichment a value-join can't do.
- Prefix/IP utilization. Opt-in
utilization(%),usedandavailablecolumns for prefixes and IP ranges, computed to match NetBox's own utilization, so you can gauge or threshold on capacity right in Grafana. See Prefix & IP utilization. - Topology node graph. Devices + links as a Grafana node graph, colored by device
status. Two edge views: logical (default: NetBox-computed cable paths, so patch
panels and circuits resolve to the far device) and physical (raw cables; panels
appear as nodes). Wireless links are always included, and every edge carries a
kinddetail (path/cable/wireless). Live-metric node coloring isn't possible panel-side. The Node Graph needs its nodes+edges frames untouched, and a transformation join collapses the edges frame (verified), so colors follow NetBox status; use correlations/data links to drill into live metrics instead. - Geomap. Plot sites from their NetBox latitude/longitude.
- Dynamic object-type discovery. Object types are discovered from the live NetBox API, both core models and plugin-provided models (e.g. BGP, custom objects), with no code changes.
- Template variables. Drive
site/device/role/tenantdropdowns from NetBox and filter every panel on the dashboard. Multi-value variables become OR filters; a Custom all value of$__allmakes All send no filter at all. - Annotations. Overlay NetBox change-log events (who changed what, when) on any
time-series panel using Grafana's
time/title/text/tagsconvention. - Deep links. Every row links straight back to the NetBox object page, and the link survives the join, so an enriched metrics table stays clickable through to NetBox.
- Correlations (Explore drill-downs). Provision links from any Prometheus/Loki series into a NetBox query, device to inventory, IP to longest-prefix context. The demo ships them; recipes in docs/CORRELATIONS.md.
- Secure & backend-based. API token stored in Grafana's encrypted secret store; all upstream calls happen server-side. Works with NetBox v1 and v2 API tokens.
Requirements
- NetBox 4.2 or later (validated against 4.2 → 4.6). The plugin depends on
display_urlon all serializers (deep links), the/api/core/object-changes/endpoint (change-log annotations), and a prefix's genericscope, returned by IP enrichment asprefix_scope. Both classic (v1) andnbt_…(v2, NetBox 4.5+) API tokens are supported and auto-detected. - Grafana 12.3 or later (the plugin's
grafanaDependency; e2e-tested against 12.3 → 13.1 and nightly in CI).
Re-verify any NetBox version locally with demo/compat-check.sh.
Configuration
Add the data source (Connections → Data sources → NetBox) and set:
| Field | Description |
|---|---|
| NetBox URL | Base URL of your NetBox instance, e.g. https://netbox.example.com (no trailing /api). |
| Browser URL | Optional. Where users' browsers reach NetBox when Grafana connects over an internal address (Docker/k8s service DNS). Deep links are rewritten to this base; leave empty if the URL above is browser-reachable. |
| API Token | A NetBox API token. Both classic 40-character (v1) tokens and nbt_… (v2) tokens are auto-detected. Stored encrypted. |
| Skip TLS verify | Accept self-signed certificates. |
| Timeout (s) | Per-request upstream timeout (default 30). |
| Fast paging | Off by default. For very large instances only — see Large NetBox instances. |
Click Save & test. A healthy data source reports the connected NetBox version.
Large NetBox instances
Most of what a broad, unfiltered table query costs is NetBox counting the
matches, not returning the rows. That cost scales with the size of the table
being counted, so it is invisible on a typical instance and becomes the dominant
term once an object type holds millions of records — dcim/interfaces on a
large network being the usual first example.
How much it costs you depends heavily on how NetBox itself is hosted: database sizing, connection latency and whether the instance is under concurrent load all move it more than anything this plugin can do from the outside. NetBox Cloud is tuned for this and is the simplest way to get predictable query performance at that scale.
Recommendations, roughly in order of effect:
- Filter. A filtered query counts only matching rows, so a site or role filter usually costs less than the same query unfiltered — often dramatically so. Dashboard template variables are the ergonomic way to do this. An unfiltered query against an object type holding more than a million objects returns an informational notice saying as much, because the largest page this data source returns is 10,000 rows: at that size a panel can only ever show a corner of the table.
- Select only the fields you use. Return fields is not just presentation — the plugin asks NetBox to serialize only those properties, so a narrow selection moves considerably less data.
- Keep limits realistic. A panel nobody scrolls past the first screen of does not need a 10,000-row limit.
- Treat
utilizationas expensive. On prefixes and IP ranges it is computed from child objects rather than read from a column, so it costs extra upstream requests per row. The frame notice tells you how many. Select it when you want it, not by default. - Prefer the enrichment query types over huge object dumps. IP enrichment resolves a specific list of addresses; it does not scan the address table.
Two things the plugin does for you:
Always on, nothing to configure. Column-projected queries also send NetBox's
?exclude=config_context, keeping its per-device config-context annotation out of the counted query set. It is only sent where the response already omits that column, so no query loses one.Fast paging (opt-in, off by default). Table panels page by object ID (NetBox 4.6 cursor pagination), and NetBox skips counting altogether.
What you give up is real, and it applies at every instance size, which is why it is off unless you turn it on:
- Rows come back in ID order, not the model's natural order. A truncated device list shows the lowest IDs, not the alphabetically first names.
- Total match counts are unavailable. A panel says "showing the first 100" rather than "showing 100 of N".
Alert rules are unaffected. Every alert evaluation — count query, alert table, or a plain object query used as a rule — asks NetBox for the real total and gets the model's natural order, whatever this setting says. An alert must never evaluate a silent zero or an arbitrary subset.
Below a few hundred thousand objects it buys nothing measurable, so leave it off unless an object type genuinely holds millions of records.
Provisioning
apiVersion: 1
datasources:
  - name: NetBox
    type: netboxlabs-netbox-datasource
    access: proxy
    jsonData:
      url: ${NETBOX_URL}
      # Browser-facing base for deep links, if url is not browser-reachable.
      publicUrl: ${NETBOX_PUBLIC_URL}
      # Very large instances only: page by ID and skip match counts.
      # Costs row order and totals — see "Large NetBox instances".
      # fastPagingNoTotals: true
    secureJsonData:
      apiToken: ${NETBOX_API_TOKEN}
Query types
| Type | Returns | Use with |
|---|---|---|
| Objects | A joinable table for any object type (with optional join keys) | Table, or Outer-join onto metrics |
| IP enrichment | Per-IP longest-prefix context, keyed on ip. Source IP list (the IPs you give, or a variable) or NetBox scope (every address under ipam/ip-addresses filters — for alert rules, which join a metric's IP against it in SQL) |
Join onto flow/log data by IP |
| Topology | Devices (nodes) + links (edges: cable paths or raw cables) | Node Graph panel |
| Annotations | Change-log events (time/title/text/tags) |
Dashboard annotations |
See Demo below for a one-command runnable stack (synthetic Prometheus + Loki labeled to match NetBox + a rich dashboard).
Filters are schema-aware: the field and operator dropdowns are derived from NetBox's OpenAPI schema (
/api/schema/), so only combinations NetBox actually supports for that object type are offered. There is no more picking an operator that the API silently ignores and returns unfiltered results for. This needs no setup (NetBox always exposes its schema); if the schema can't be read, the editor falls back to the discovered columns with all operators available.
Filter rows stack with AND, but NetBox combines repeated parameters with OR, so two rows that resolve to the same NetBox parameter (two
name containsrows, say) are OR-ed instead, and the editor warns on both. Two cases are not flagged, because there the stacked AND is already what NetBox does:tag/tag_idrows (NetBox requires every listed tag to match) and rows using a not operator (NetBox excludes every listed value, sostatus not offlineplusstatus not plannedmeans neither). A row with a field but no value is noted as not yet applied, since NetBox ignores it rather than filtering; use is empty / has any value to filter on presence instead of a value.When a result is larger than the row limit, the panel reports how many of the matching objects are shown, e.g.
Showing 100 of 104,231 matching objects., so a truncated table is never mistaken for the full answer. In Alert table mode (see Alerting below), a truncated result fails the query instead of alerting on part of the data.
Dynamic object-type discovery
The query editor's Object type list is built by walking the NetBox API
(/api/ + /api/plugins/). Any model exposed by the REST API, including plugins like
netbox-bgp, appears automatically. Columns are derived by flattening a sample object, so
nested references become readable values (site) plus their ids/slugs (site_id,
site_slug), choice fields expose both label and value, and custom fields are hoisted to
cf_* columns.
Enrichment recipes
How enrichment works. A NetBox query returns a flat table (one row per device/IP/prefix). A join key renames one NetBox field into a column that exactly matches a label on your metrics or logs, same name, same value, optionally transforming it on the way (lowercase, strip domain, drop CIDR mask, regex). A Grafana transformation, usually Join by field, then lines the two tables up, and every series row carries its NetBox context.
Step-by-step recipes for Prometheus/SNMP metrics, Loki logs, flows by IP (exact and longest-prefix match), plus variables, annotations and deep links, live in docs/RECIPES.md. The join-key transform reference is docs/JOIN-KEYS.md.
Want a sandbox with everything pre-wired? See Demo below.
./demo/run.shbrings up a real NetBox plus Prometheus, Loki and synthetic telemetry, all labeled to match.
Prefix & IP utilization
Prefixes and IP ranges expose three opt-in columns (utilization, used,
available) that the backend computes to match the figure NetBox's own UI
shows. They appear only when added to Return fields, so ordinary IPAM queries
pay nothing extra. See the Prefix & IP utilization recipe.
Alerting
Alert on NetBox state itself: object counts ("fewer than N active devices"), per-object conditions with context labels (offline devices, hot prefixes), "who do I page?" contact resolution, metric thresholds that differ by device role, read from a NetBox custom field, and suppression of devices NetBox says are being retired. The full guide, including how to put NetBox context onto alert labels, annotations and notifications, is docs/ALERTING.md.
Grafana Cloud
This is a backend datasource, so it runs on Grafana Cloud once published to the Grafana plugin catalog and signed by Grafana (Cloud cannot load private/unsigned plugins).
- Public NetBox (internet-reachable URL): the Cloud-hosted backend calls it directly.
- Private NetBox (VPC / on-prem): use Private Data Source Connect (PDC).
PDC supports backend datasource plugins, and this plugin builds its HTTP client from the
Grafana SDK (
backend/httpclient) so PDC's secure tunnel, proxy and TLS settings are honored automatically. No plugin changes are needed by the customer.
The backend ships binaries for linux/amd64 and linux/arm64 (Cloud) plus the full
catalog target matrix (darwin/windows/arm).
Branches (netbox-branching)
If your NetBox runs the netbox-branching
plugin, set a query's Branch field to a branch name or schema id to read that
branch's state instead of main (via the X-NetBox-Branch header). Leave it empty, or use
main, for the default branch.
For a branch picker, add a dashboard variable (type Query → NetBox → object type
plugins/branching/branches, value field schema_id, text field name) and put $branch
in the Branch field. The variable offers a selectable main alongside each branch labeled
name (schema_id) — branch names are not unique in NetBox, so the schema id disambiguates
them. Objects, IP enrichment, topology, and annotation queries all honor the selected
branch (annotation and variable queries each have their own Branch field), and the field /
value-autocomplete pickers reload against it. Only the object-type list is always read
from main (NetBox models are code-level and identical across branches).
The bundled demo ships the plugin already installed and a seeded demo-branch that adds a
branch-only device, AMS1-leaf-99. To see branching in action, pick the dashboard's
Branch variable (or set a query's Branch field to the branch's name or schema id) and
switch it to demo-branch: AMS1-leaf-99 appears only while that branch is selected, and
disappears again once you switch back to main.
Demo
A one-command stack that exercises the enrichment recipes and prefix/IP utilization above end to end.
Prerequisites: Docker Desktop (or an equivalent Docker daemon) running, and Node.js/npm
on PATH. mage/Go are optional; if mage isn't installed, the script builds the backend
in a golang:1.26 container instead.
Full mode (self-contained):
./demo/run.shinstalls npm dependencies and builds the plugin if needed, then brings up a real, seeded NetBox (a multi-site fabric), Prometheus, Loki, synthetic telemetry, and Grafana athttp://localhost:3001(anonymous admin) with the dashboard above pre-provisioned. First run additionally builds the frontend and both backend binaries (a few minutes, mostly Go module/image downloads); after that, NetBox seeding is the only wait, about 2-3 min.Once it is up: NetBox is at
http://localhost:8000(sign inadmin/admin), and Grafana is athttp://localhost:3001(anonymous admin, no login). The demo's pre-provisioned API token is0123456789abcdef0123456789abcdef01234567.Fast / bring-your-own-NetBox mode: point the stack at your own NetBox instead of the bundled one (same script, so the plugin gets built too):
NETBOX_URL=https://your-netbox NETBOX_TOKEN=... ./demo/run.sh(Equivalent, if the plugin is already built: the same env vars with
docker compose -f demo/docker-compose.yaml up.)Just want the dashboard? Import demo/netbox-demo-dashboard.json into any Grafana (Dashboards → Import). It prompts for your NetBox, Prometheus and Loki datasources.
Teardown. Tear the demo stack down with ./demo/run.sh down (works for both full and
bring-your-own modes, and needs no env vars or setup):
./demo/run.sh down— stop and remove the containers but keep the seeded NetBox data, so the next./demo/run.shstarts fast (no re-seed)../demo/run.sh down -v— also remove the seeded-data volume for a clean slate (the next run re-seeds, ~2-3 min)../demo/run.sh down -v --rmi local— additionally drop the built NetBox image (~1 GB) to reclaim disk. Any extra flags are passed straight through todocker compose down.
Development
The datasource never imports a NetBox client directly. It depends only on the small
provider.Provider interface. Today the only
implementation is the NetBox REST API. A second backend, a high-volume enrichment
projection of NetBox for NetBox Cloud/Enterprise, is planned, and slots in behind the
same interface as a drop-in rather than a rewrite.
# Frontend
npm install
npm run dev            # watch build
npm run test:ci        # jest
npm run typecheck
npm run lint

# Backend (Go)
mage -v build:backend  # or: GOOS=… GOARCH=… go build -o dist/gpx_netbox_<os>_<arch> ./pkg
go test ./...

# Run a dev Grafana with the plugin
NETBOX_URL=https://netbox.example.com NETBOX_API_TOKEN=… docker compose up
The Go toolchain floor follows the Grafana plugin SDK (currently Go 1.26 / SDK 0.292). If your local Go is older, build the backend in a container:
docker run --rm -v "$PWD":/src -w /src -e GOOS=linux -e GOARCH=amd64 -e CGO_ENABLED=0 \
  golang:1.26 go build -o dist/gpx_netbox_linux_amd64 ./pkg
CGO_ENABLED=0 matters here: without it you get a binary dynamically linked against
glibc, and Grafana's own image is musl-based (Alpine), so the plugin backend then fails
fork/exec with a misleading "no such file or directory" (the missing piece is the ELF
interpreter, not the binary itself).
Testing
- Go (
go test ./...): provider discovery/flattening/query/changes against a mock NetBox, frame typing & data links, QueryData, resource routes, health. - Frontend (
npm run test:ci): variable mapping, template interpolation, query gating. - E2E (
npm run e2e):@grafana/plugin-e2e(Playwright) config & query editor smoke.
Support & contributing
- Found a bug or want a feature? Open an issue using the matching template. The version and environment fields it asks for are what we need to reproduce a problem.
- Want to contribute? See CONTRIBUTING.md.
- Security issue? Report privately per SECURITY.md, not via a public issue.
License
Apache-2.0. See LICENSE.
Plugin Insights
Quality scores for version 1.0.3
- Status: PassedSecurity
All checks passed
- Status: PassedMaintenance
All checks passed
- Status: PassedDocumentation
All checks passed
Insights
- Queries
0 total queries served across all Grafana Cloud instances.
- Version
- 1.0.3
- Dependencies
- Grafana >=12.3.0
- Developer
- netboxlabs
- Last Updated
- October 8, 2026