
Solar Flow Visualisation
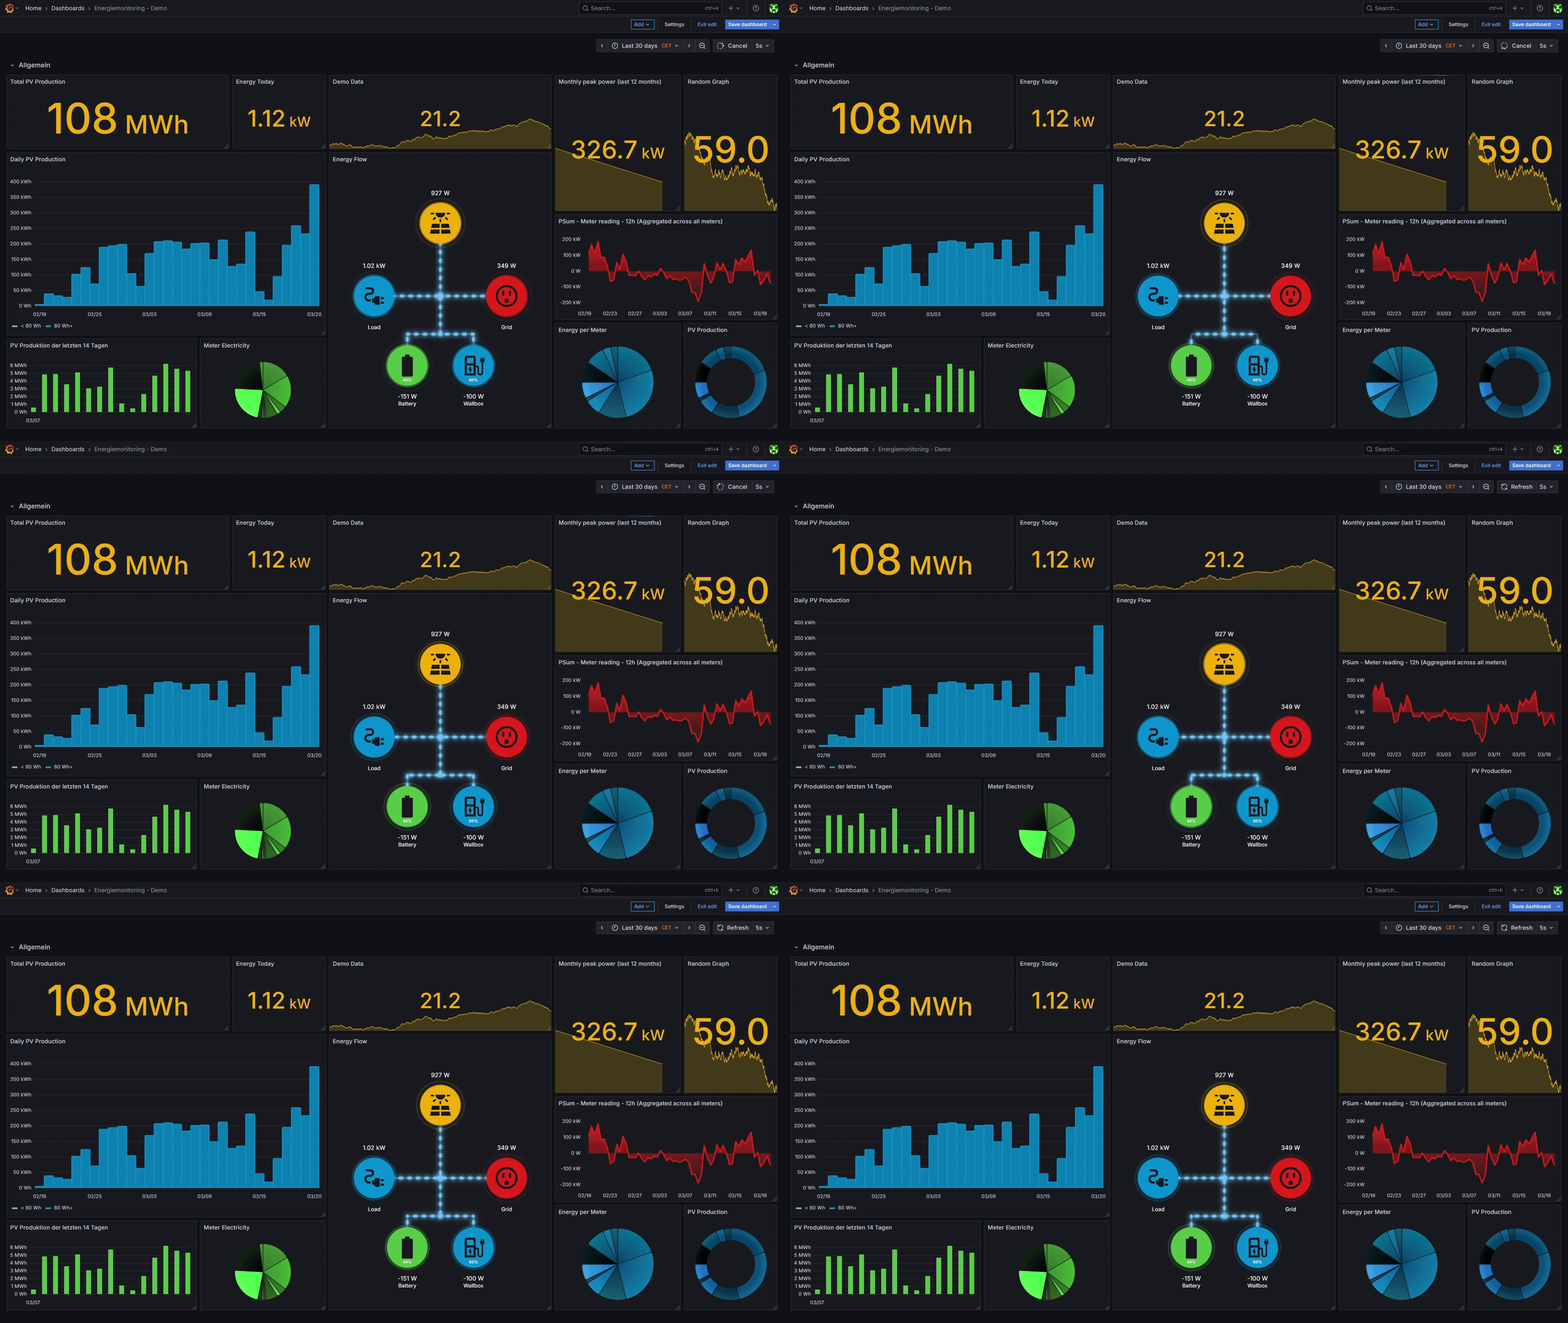
Solar Flow is an animated visualization of solar panel energy flow, designed as a Grafana panel plugin. It shows real-time energy movement between PV, Grid, Load, and up to 3 additional sources (battery, wallbox, etc.) with smooth particle-style animations.
Showcase
Installation
- Add the Solar Flow plugin to your Grafana dashboard
- Create a data source for your solar panel production data
- Provide the query for PV and Grid data in the plugin settings
- Adjust the panel options to your needs
Data Requirements
The plugin expects PV and Grid data from your data source. If your data is stored in separate tables, use Grafana's Data Transform feature to combine them into one query.
Options
Options are organized into collapsible groups in the panel editor sidebar.
Data Sources
- Solar Value — Field containing solar panel production data
- Grid Value — Field containing grid energy data
- Load Value (optional) — Direct load reading from the inverter. If set, overrides the calculated value (PV + Grid + Additional Sources)
- Measurement Unit —
Auto(W below 1000, kW above),kW, orW
Additional Sources (0–3)
Configure up to 3 additional energy sources (battery, wallbox, EV charger, etc.). Select the number of sources from the count selector — options for each source appear dynamically.
Each source has:
- Value — Energy data field
- SOC Value (optional) — State of Charge field (e.g. battery percentage)
- Label — Display name
- Icon — Battery, EV Panel, or Solar Panel
- Color — Circle color
- Always Show — Show even when value is 0
Layout adapts automatically:
- 1 source — centered below the hub
- 2 sources — side-by-side with a sub-junction
- 3 sources — row of three with a sub-junction
Animation
- Energy Line Threshold — Minimum value to show animated energy lines
- Speed Reference (W) — Power level at which animation runs at 1s/cycle. Lower = faster at low values
Layout
- Padding — Space between the diagram and panel edges
- Show Legend — Label the energy points
Colors
- Solar / Load / Grid / Lines — Color pickers for core diagram elements
Releasing
This project uses GitHub Actions for automated builds and releases.
Creating a release
- Bump the version:
npm version patch # or minor / major - Push the tag:
git push origin main --follow-tags - The release workflow builds, signs, and creates a draft GitHub release with the plugin zip
- Edit and publish the draft release on GitHub
Setup requirements
To enable plugin signing, add a GRAFANA_ACCESS_POLICY_TOKEN to your repository secrets. Refer to the Grafana sign-a-plugin docs to generate the token.
Development
npm install        # Install dependencies
npm run dev        # Start webpack in watch mode
npm run server     # Start Grafana via docker-compose
npm run build      # Production build
npm run lint       # Lint
npm run typecheck  # Type check
npm run test:ci    # Run tests
Grafana Cloud
Connect any plugin in Grafana Cloud.
- 150+ data source integrations
- Grafana Assistant - AI that correlates your data, builds queries, and answers questions
- 10k Prometheus metrics + 50 GB logs, traces, and profiles on the free tier
- ...and more
Insights
- Adoption
Running on 1,390 active Grafana instances.
- Activity
Last updated 25 Mar 2026.
1 release in the past year.
- Version
- 2.0.3
- Dependencies
- Grafana >=10.3.3
- Developer
- lehmannch
Grafana Cloud
Connect any plugin in Grafana Cloud.
- 150+ data source integrations
- Grafana Assistant - AI that correlates your data, builds queries, and answers questions
- 10k Prometheus metrics + 50 GB logs, traces, and profiles on the free tier
- ...and more