
Rack elevation panel



Front and rear views of your racks, unit by unit, drawn from your inventory data and coloured by device state or by any metric.
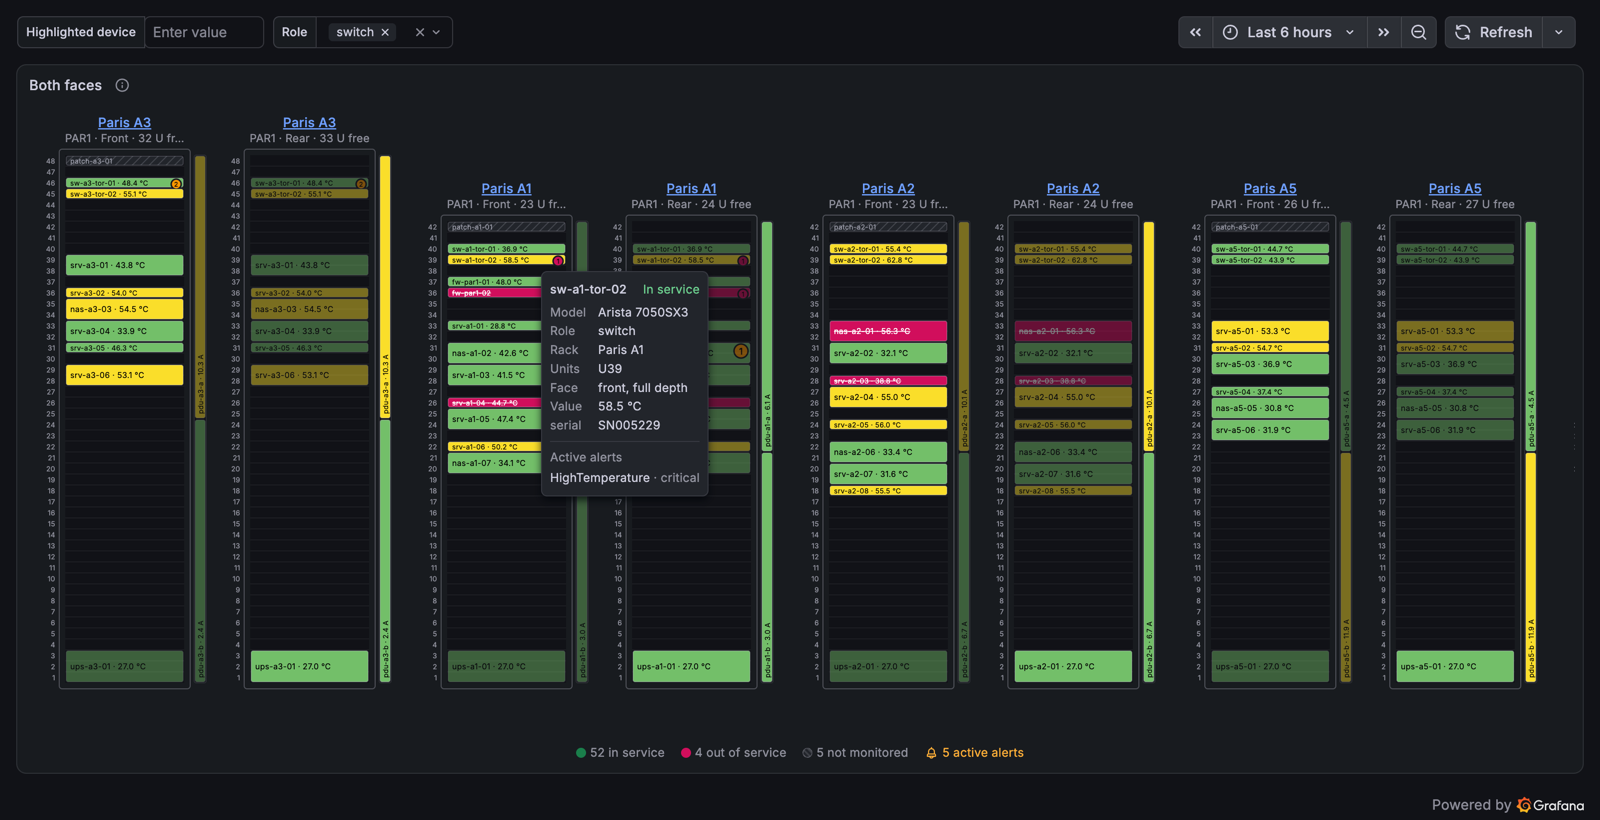
The placement comes from the data: when the inventory changes (NetBox, Nautobot, a CMDB, a SQL table, a CSV file), the view changes. The panel knows no data source; it reads tables with documented columns, so anything that can produce such a table works without extra code.
- One or several racks side by side, front, rear or both faces, 10-inch or 19-inch, sized to fill the panel.
- NetBox placement rules: lowest unit, descending numbering, full-depth devices, 0U devices.
- Colour, unit, value mappings, data links and variables come from the standard Grafana field config.
- In service, out of service and not monitored states; active alerts badge; free units of each rack; a legend with the counts.
- Device card on hover, data links on click, highlight of a device from a dashboard variable, role filter.
- Overlapping or overflowing devices are drawn and listed, never hidden.
Requirements
Grafana 13.2 or later.
Quick start
Display a rack in a few minutes, with no data source to install:
Create a dashboard and add a visualization with the TestData data source.
Set Scenario to CSV Content and paste:
device,rack,position,u_height,face,is_full_depth,role,model,status,value
patch-hq-01,RACK-HQ-01,42,1,front,false,patch-panel,Panduit CP48,,
fw-hq-01,RACK-HQ-01,40,1,front,true,firewall,FortiGate 100F,up,41
sw-hq-core-01,RACK-HQ-01,38,1,front,true,switch,Cisco C9300-48P,up,45
sw-hq-core-02,RACK-HQ-01,37,1,front,true,switch,Cisco C9300-48P,up,47
wlc-hq-01,RACK-HQ-01,35,1,front,true,wireless,Aruba 7210,up,62
wlc-hq-02,RACK-HQ-01,34,1,front,true,wireless,Aruba 7210,down,
nas-hq-01,RACK-HQ-01,24,2,front,true,storage,Synology RS1221+,up,36
srv-hq-01,RACK-HQ-01,20,2,front,true,server,Dell R760,up,38
ups-hq-01,RACK-HQ-01,1,3,rear,true,ups,APC SRT3000,up,29
pdu-hq-a,RACK-HQ-01,,0,rear,false,pdu,APC AP8853,,
Pick the Rack elevation visualization.
In Standard options, set the unit to Celsius; in Thresholds, add a step at 50 (yellow) and one at 60 (red). The devices take the colour of their temperature.
Data contract
The panel reads table frames: one row per device, one column per attribute. Columns are found by their default names, ignoring case, or mapped to other names in the Columns options.
Devices (required)
| Column | Type | Required | Meaning |
|---|---|---|---|
device |
string | yes | Unique device name, the key of the alerts frame and of the highlight variable |
rack |
string | yes | Rack of the device |
position |
number | no | Lowest-numbered unit occupied, as in NetBox. Empty for a 0U device |
u_height |
number | no | Height in units, 1 by default |
face |
string | no | front or rear, front by default |
is_full_depth |
boolean | no | Seen from both faces, true by default |
role |
string | no | Used by the role filter, the label and the card |
model |
string | no | Shown in the card and the label |
status |
string or number | no | In service when it is one of the In service values; empty: not monitored |
value |
number | no | Metric giving the colour, see Colours |
parent_device |
string | no | The row is listed in the card of its parent instead of being placed |
Any other column is shown in the device card, as it is: site, serial number, IP address...
When the frame has a time field, as with a Prometheus range query, only the latest row of each device is read.
Racks (optional)
| Column | Type | Meaning |
|---|---|---|
rack |
string | Rack, the key of the rack column of the devices |
name |
string | Name shown above the rack, rack by default |
u_height |
number | Height in units, 42 by default |
starting_unit |
number | Number of the first unit, 1 by default |
desc_units |
boolean | Units numbered from the top, false by default |
site |
string | Shown under the name |
width |
number | Width in inches as in NetBox (10, 19...), 19 by default |
Without a racks frame, each rack of the devices is drawn with these defaults and grows to fit its highest device. With a racks frame, devices outside the rack are drawn in a dashed overflow zone and listed as problems. The racks are drawn in the order of the Racks option, then of the racks frame, then of the devices.
Alerts (optional)
A frame with a device column and an alertname column, and optionally severity. Each row is an active alert:
the device gets a badge with their count, red if one is critical, and the card lists them.
Which frame is which
The frames can be picked in the Data options, by query or frame name. Otherwise the devices frame is the one with
device and position or u_height columns, the racks frame the one with rack and no device, the alerts frame
the one with alertname.
The panel does not join frames itself. Several queries that return device columns (an inventory and two metrics, for
instance) must be joined with the Join by field transformation, mode OUTER (TABULAR), on device. The panel
lists the frames it ignores.
Placement
The rules follow NetBox, so that the view matches the rack page of NetBox or Nautobot:
- A device occupies the units from
positiontoposition + u_height - 1. - With
desc_units, unit 1 (orstarting_unit) is at the top, and a device goes down from its position. - A full-depth device is drawn on both faces, faded on the opposite face.
- Devices without position, such as PDUs, go to the 0U band right of the rack.
- Two overlapping devices are both drawn; the second one in the data is hatched and takes the right half.
- Problems (overlaps, overflows, duplicates, orphan child devices, unknown racks, ignored frames) are listed under the warning icon in the top right corner. They never stop the drawing.
Colours
| State | When | Drawing |
|---|---|---|
| Colour of the value | a value, and not out of service | colour of the field config, value in the label |
| In service, no value | status in service, no value | neutral, green border |
| Out of service | status not in service | red, label struck through |
| Not monitored | no status and no value | grey, hatched |
The colour of a value is the one Grafana gives it: thresholds, colour scheme and value mappings of the Standard options, with their unit and decimals. A value mapping with a colour on the status field replaces the red of the devices out of service.
Colour fields. An override applies to a column, not to rows, so one column cannot have a threshold in °C for the
servers and in amperes for the PDUs. Put each metric in its own column (temperature, current...) and list them in
Colour fields: each device takes the first one with a value, and each column gets its own thresholds and unit with
an override Fields with name.
Interactions
- Hover a device for its card: inventory, units, state, value, extra columns, active alerts and child devices.
- Click a device to open its data links, configured in the Data links of the field config. The fields of the
row are available, for instance
https://netbox.example.com/dcim/devices/?q=${__data.fields.device}or/d/my-device-dashboard?var-device=${__data.fields.device}. With one link the click follows it directly. - Highlight: the devices named in the Highlight variable (
$deviceby default) get a thick border and the others fade. A link from an alert to the dashboard withvar-device=<name>lands on the device. A button above the racks clears the highlight. - Role filter: devices of other roles fade and stop reacting, the racks keep their shape. It accepts a variable
such as
$role. The legend counts only the devices of the filter. - Rack links: the name of a rack opens the data links of the racks frame, for instance its NetBox page. The links
of the field config defaults apply to every frame and are written for the devices, so give the racks their own with
an override Fields returned by query on the racks query, such as
https://netbox.example.com/dcim/racks/?q=${__data.fields.rack}. - Keyboard: Tab moves from device to device and shows the card, Enter opens the links, Escape closes the card and the menu.
Display
- Auto unit height (default): the tallest rack fills the panel height, and the racks scroll sideways when they do not fit in the width. Turn it off to set the unit height in pixels, or use Fit to panel to scale everything down to the panel.
- Under each rack name, the number of free units of the face, a full-depth device of the other face counting as taken.
- The legend at the bottom counts the devices in service (or with a value), out of service and not monitored, and the active alerts.
Recipes
CSV, no infrastructure
Paste the CSV of the quick start in TestData, or serve a CSV file through the Infinity data source. A second query with the racks columns adds rack heights, names and widths.
NetBox with the Infinity data source
Install the Infinity data source and set it
up for your NetBox URL, with an Authorization header holding your API token (Token <token>, or
Bearer <token> for the v2 tokens of NetBox 4.5+), kept as a secure header.
The device height and depth belong to the device type, which the REST API of devices does not return; the GraphQL
API returns them in one query. Add a query of type GraphQL, source URL, URL https://netbox.example.com/graphql/,
parser Backend, root selector data.device_list, and the query:
query {
  device_list(filters: { site: { slug: { exact: "$site" } } }) {
    name
    position
    face
    rack {
      name
    }
    role {
      name
    }
    device_type {
      model
      u_height
      is_full_depth
    }
    parent_device {
      name
    }
  }
}
with the columns:
| Selector | As | Type |
|---|---|---|
name |
device |
string |
rack.name |
rack |
string |
position |
position |
number |
device_type.u_height |
u_height |
number |
face |
face |
string |
device_type.is_full_depth |
is_full_depth |
boolean |
role.name |
role |
string |
device_type.model |
model |
string |
parent_device.name |
parent_device |
string |
A second GraphQL query, root selector data.rack_list, gives the racks frame:
query {
  rack_list(filters: { site: { slug: { exact: "$site" } } }) {
    name
    u_height
    starting_unit
    desc_units
    width
    site {
      name
    }
  }
}
with name as rack, and u_height, starting_unit, desc_units, width and site.name as site.
Filter and field names can change between NetBox versions: try the queries in the GraphiQL page of NetBox, at
/graphql/, first.
State and colour come from your monitoring (Prometheus, Zabbix, LibreNMS...): add a query that returns device and
the metric, and join it to the inventory with Join by field on device. The device names of NetBox and of the
monitoring usually match on the hostname; otherwise align them with the Rename by regex transformation or, in
PromQL, with label_replace.
Prometheus
If an exporter or recording rule publishes the inventory as an info metric, for instance
netbox_device_info{device, rack, position, u_height, face, is_full_depth, role, model} 1, three instant queries in
Table format give everything:
- A:
netbox_device_info - B:
upor any 0/1 health metric with adevicelabel - C: a metric for the colour, for instance a temperature
Join them with Join by field on device, mode OUTER (TABULAR), then map status to Value #B in the
Columns options and set Colour fields to Value #C.
A single query with group_left also works:
up * on (device) group_left (rack, position, u_height, face, is_full_depth, role, model) netbox_device_info
with status mapped to Value. This join keeps only the devices that have the left metric: patch panels and
other unmonitored devices disappear. Prefer the three joined queries to see the whole inventory.
Alerts
ALERTS{alertstate="firing", device!=""}
as an instant query in Table format gives the alerts frame. Keep it out of the Join by field transformation with its Apply to filter on the other queries.
Troubleshooting
- No rack to draw: no frame has
deviceandrackcolumns. Check the column names, or map them in Columns. - Frame "B" also has a device column and is ignored: join it to the devices frame with Join by field.
- x appears more than once: the same device is on several rows of a frame without time field; only the first one is drawn.
- x overlaps y or x is outside rack: the inventory places two devices on the same units, or past the rack height given by the racks frame.
- The highlight does not follow the variable: write the variable with its
$in Highlight variable.
Feedback and contributing
Report bugs and ask for features in the issues. To work on the code, read CONTRIBUTING.md.
License
Grafana Cloud
Connect any plugin in Grafana Cloud.
- 150+ data source integrations
- Grafana Assistant - AI that correlates your data, builds queries, and answers questions
- 10k Prometheus metrics + 50 GB logs, traces, and profiles on the free tier
- ...and more
Insights
- Adoption
Running on 15 active Grafana instances.
- Activity
Last updated 5 Nov 2026.
1 release in the past year.
- Version
- 1.0.1
- Dependencies
- Grafana >=13.2.0
- Developer
- kentrow
Grafana Cloud
Connect any plugin in Grafana Cloud.
- 150+ data source integrations
- Grafana Assistant - AI that correlates your data, builds queries, and answers questions
- 10k Prometheus metrics + 50 GB logs, traces, and profiles on the free tier
- ...and more