
Hydrolix data source for Grafana
The Hydrolix data source plugin integrates Hydrolix with Grafana, enabling seamless querying, analysis, and visualization of Hydrolix data.
Install the plugin
To install the Hydrolix data source plugin:
- Open the Grafana Plugin Catalog.
- Search for Hydrolix Data Source.
- Select the plugin and click Install Plugin.
After installation:
- In Grafana, go to Connections > Data Sources > Add new data source.
- Select Hydrolix from the list.
For more details about installation, see Grafana’s Plugin management documentation.
Configure the data source
You can configure the Hydrolix data source directly within Grafana or via configuration files.
Following is the list of Hydrolix configuration options.
- Name - The name used to reference this data source in panels and queries.
- Default - Toggle to set this Hydrolix data source as the default in panels and visualizations.
Server section:
- Server address - The IP address or hostname of your Hydrolix instance.
- Server port - The port on which your Hydrolix instance is running.
- Use default - Toggle to use the default port instead of specifying a custom one.
- Protocol - The communication protocol used: Native or HTTP.
- Secure connection - Toggle to enable a secure connection.
- HTTP URL path (optional) - Additional URL path for HTTP requests.
TLS / SSL Settings section:
- Skip TLS verify - Toggle to bypass TLS certificate verification. Not recommended, unless absolutely necessary for testing.
Credentials section:
- Credentials Type - Credentials type for connecting to your Hydrolix instance: User Account or Service Account.
- Token - Service account token.
- Username, Password - Service account credentials.
Additional Settings section:
- Default database (optional) - Used when no database is explicitly included in the query.
- Default round (optional) - Used when a query does not specify a round value. Aligns
$fromand$toto the nearest multiple of this value. For more details, see Round timestamps. - Ad hoc filter table variable name (optional) - Variable defines which table to use for retrieving ad hoc filter columns and values.
- Ad hoc filter default time range (optional) - Default time range for time filtering when dashboard time range is not available
- Ad hoc filter values query condition variable name (optional) - Name of a dashboard variable that defines query condition to filter ad hoc filter values
- Dial timeout (optional) - Connection timeout in seconds.
- Query timeout (optional) - Read timeout in seconds.
Query Settings subsection:
You can configure Hydrolix query settings that will be sent
with each query from this data source, wrapped as CustomSetting values. Note that only a subset of settings is
supported in this way.
To add a setting, select it from the dropdown list and provide a corresponding value in the field that appears.
You can include any built-in Grafana variables or dashboard template variables in the setting values. Keep in mind that some variables may not be available during interpolation - their availability depends on the query source. If a variable is not defined in the current context, it will not be interpolated and will remain as-is.
The plugin also supports several synthetic variables specific to query settings:
${__hydrolix.raw_query}- Represents the raw query text before any interpolation is applied.${__hydrolix.query_source}- Represents the query source, derived from theDataQueryRequest.appfield. This is useful to distinguish whether a query originated from Explore or elsewhere.
Error Exposure subsection:
The Error Exposure feature allows you to expose query errors to Grafana dashboard variables, enabling error tracking, monitoring, and custom error handling within your dashboards.
- Enable Error Exposure - Toggle to enable exposing query errors to dashboard variables.
- Variable Name - Name of the dashboard variable where error information will be stored (default:
hdx_query_errors). - Max Error Count - Maximum number of errors to store in the variable (default:
5). - Error TTL (seconds) - Time to live for stored errors in seconds. Errors older than this value will be automatically
removed (default:
300). - Solution Templates - Download the error solution templates in JSON format
When enabled, query errors are automatically captured and stored in the specified dashboard variable, allowing you to display error messages in error panel.
Provision the data source
To provision the Hydrolix data source using Grafana’s provisioning system, define it in a YAML configuration file.
Below are some provisioning examples.
Using HTTPS protocol
apiVersion: 1
datasources:
  - name: "Hydrolix"
    type: "hydrolix-hydrolix-datasource"
    jsonData:
      host: localhost
      port: 443
      protocol: http
      secure: true
      username: username
      path: /query
    secureJsonData:
      password: password
Using native protocol
apiVersion: 1
datasources:
  - name: "Hydrolix"
    type: "hydrolix-hydrolix-datasource"
    jsonData:
      host: localhost
      port: 9440
      protocol: native
      secure: true
      username: username
    secureJsonData:
      password: password
Using HTTPS protocol with defaults and ad hoc filters
apiVersion: 1
datasources:
  - name: "Hydrolix"
    type: "hydrolix-hydrolix-datasource"
    jsonData:
      host: localhost
      port: 443
      protocol: http
      secure: true
      username: username
      path: /query
      defaultDatabase: database
      defaultRound: 60s
      adHocTableVariable: table
    secureJsonData:
      password: password
Using HTTPS protocol with error exposure enabled
apiVersion: 1
datasources:
  - name: "Hydrolix"
    type: "hydrolix-hydrolix-datasource"
    jsonData:
      host: localhost
      port: 443
      protocol: http
      secure: true
      username: username
      path: /query
      exposeErrors:
        enables: true
        variableName: hdx_query_errors
        maxCount: 5
        ttl: 300
    secureJsonData:
      password: password
For more details about provisioning, see Grafana's Provisioning documentation.
Querying the data source
The query editor in Grafana enables powerful SQL querying with convenient syntax enhancements through macros and templates.
SQL query editor
The editor provides extensive SQL capabilities, featuring:
- Intelligent autocompletion for databases, tables, columns, and SQL syntax.
- Template variable and macro support.
- Code formatting.
Keyboard shortcuts
Cmd/Ctrl + Return- Run the query.
Macros
To simplify syntax and to allow for dynamic parts, like date range filters, the query can contain macros.
| Macro | Description | Output example |
|---|---|---|
$__dateFilter(column) |
Generates a condition to filter data (using the provided column) based on the panel's date range | date >= toDate('2022-10-21') AND date <= toDate('2022-10-23') |
$__timeFilter([column]) |
Generates a condition to filter data based on the panel's time range in seconds. Accepts an optional column name. If no column is provided, the primary key is used automatically. | time >= toDateTime(1415792726) AND time <= toDateTime(1447328726) |
$__timeFilter_ms([column]) |
Generates a condition to filter data based on the panel's time range in milliseconds. Accepts an optional column name. If no column is provided, the primary key is used automatically. | time >= fromUnixTimestamp64Milli(1415792726123) AND time <= fromUnixTimestamp64Milli(1447328726456) |
$__dateTimeFilter(dateColumn, timeColumn) |
Combines $__dateFilter() and $__timeFilter() for filtering with separate date and time columns |
$__dateFilter(dateColumn) AND $__timeFilter(timeColumn) |
$__adHocFilter |
Replaced with a condition to filter data based on the applied ad hoc filters | statusCode = '200' |
$__fromTime |
Replaced with the panel's start time, cast as DateTime |
toDateTime(1415792726) |
$__toTime |
Replaced with the panel's end time, cast as DateTime |
toDateTime(1447328726) |
$__fromTime_ms |
Replaced with the panel's start time, cast as DateTime64(3) (millisecond precision) |
fromUnixTimestamp64Milli(1415792726123) |
$__toTime_ms |
Replaced with the panel's end time, cast as DateTime64(3) (millisecond precision) |
fromUnixTimestamp64Milli(1447328726456) |
$__interval_s |
Replaced with the interval in seconds | 20 |
$__timeInterval([column]) |
Calculates intervals based on panel width, useful for grouping data in seconds. Accepts an optional column name. If no column is provided, the primary key is used automatically. | toStartOfInterval(toDateTime(column), INTERVAL 20 second) |
$__timeInterval_ms([column]) |
Calculates intervals based on panel width, useful for grouping data in milliseconds. Accepts an optional column name. If no column is provided, the primary key is used automatically. | toStartOfInterval(toDateTime64(column, 3), INTERVAL 20 millisecond) |
$__conditionalAll(condition, $templateVar) |
Includes the provided condition only if the template variable does not select all values, defaults to 1=1 otherwise |
condition or 1=1 |
Escaping macros
Sometimes you may need to include macro syntax in your query as literal text without it being evaluated. To escape a macro, prefix it with an additional dollar sign ($).
Examples:
$$__timeFilter(timestamp)→ Outputs$__timeFilter(timestamp)as literal text$$__adHocFilter()→ Outputs$__adHocFilter()as literal text
Multiple escaping:
You can escape multiple times by adding more dollar signs:
$$$__timeFilter(timestamp)→ Outputs$$__timeFilter(timestamp)as literal text$$$$__timeFilter(timestamp)→ Outputs$$$__timeFilter(timestamp)as literal text
Each additional $ at the beginning removes one level of escaping. Only the first $ is removed, and the rest of the macro text remains unchanged.
Use cases:
- Documenting macro usage in comments
- Using macro in dashboard variables queries where inner queries should not be interpolated
Below is an example of a query with the $__timeFilter macro:
SELECT $__timeInterval(log_time) AS time, avg(cpu_usage) AS value
FROM logs
WHERE $__timeFilter()
GROUP BY time
ORDER BY time
Ad hoc filters
Ad hoc filters allow flexible, column-value filtering dynamically applied across queries. These filters are injected into
queries via the $__adHocFilter macro, which must be explicitly included in the WHERE clause:
SELECT $__timeInterval(log_time) AS time, avg(cpu_usage) AS value
FROM logs
WHERE $__timeFilter() AND $__adHocFilter()
GROUP BY time
ORDER BY time
The plugin ensures filters are applied only when valid for the selected table.
Configure ad hoc filters
To enable ad hoc filters, both the data source and the dashboard must be configured properly:
In the data source settings (under Advanced Settings):
- Ad hoc filter table variable name: the name of a dashboard variable that defines the table used to retrieve column names and their values for ad hoc filters.
- Ad hoc filter default time range: a default time range to use when the dashboard time range is unavailable.
In the target dashboard, create a variables using the exact name defined in the data source settings A variable for the table name
In the ad hoc variable's own settings, enable Allow custom values (recommended — see the note below).
Note: Ad hoc filters will not work unless both the data source and the dashboard are configured correctly. Be sure to match variable names precisely.
Recommended: enable Allow custom values on the ad hoc variable. Key and value suggestions are produced by bounded, best-effort queries (see Value suggestion guardrails), so a perfectly valid key or value can be absent from the dropdown — most commonly a
Mapcolumn key or a value that last occurred outside the trailing 24-hour suggestion window. Grafana only accepts what the suggestion list offers unless Allow custom values is enabled, so without it such a filter cannot be created at all: the typed key is rejected and the filter never commits. With it enabled, a typed key or value is applied to the query exactly like a suggested one.
Limit ad hoc filter values
This plugin allows limiting ad hoc filter values based on a specified condition. For example, if a dashboard only shows data from hosts with commercial domains, you can restrict the filter values using a condition like: host like '%.com'
To apply the limit ad hoc filters, both the data source and the dashboard must be configured properly:
In the data source settings (under Advanced Settings):
- Ad hoc filter values query condition variable name: the name of a dashboard variable that defines query condition to filter ad hoc filter values.
In the target dashboard, create a const variables using the exact name defined in the data source settings Ad hoc filter values query condition variable name and add condition as a value (e.g.
host like '%.com')
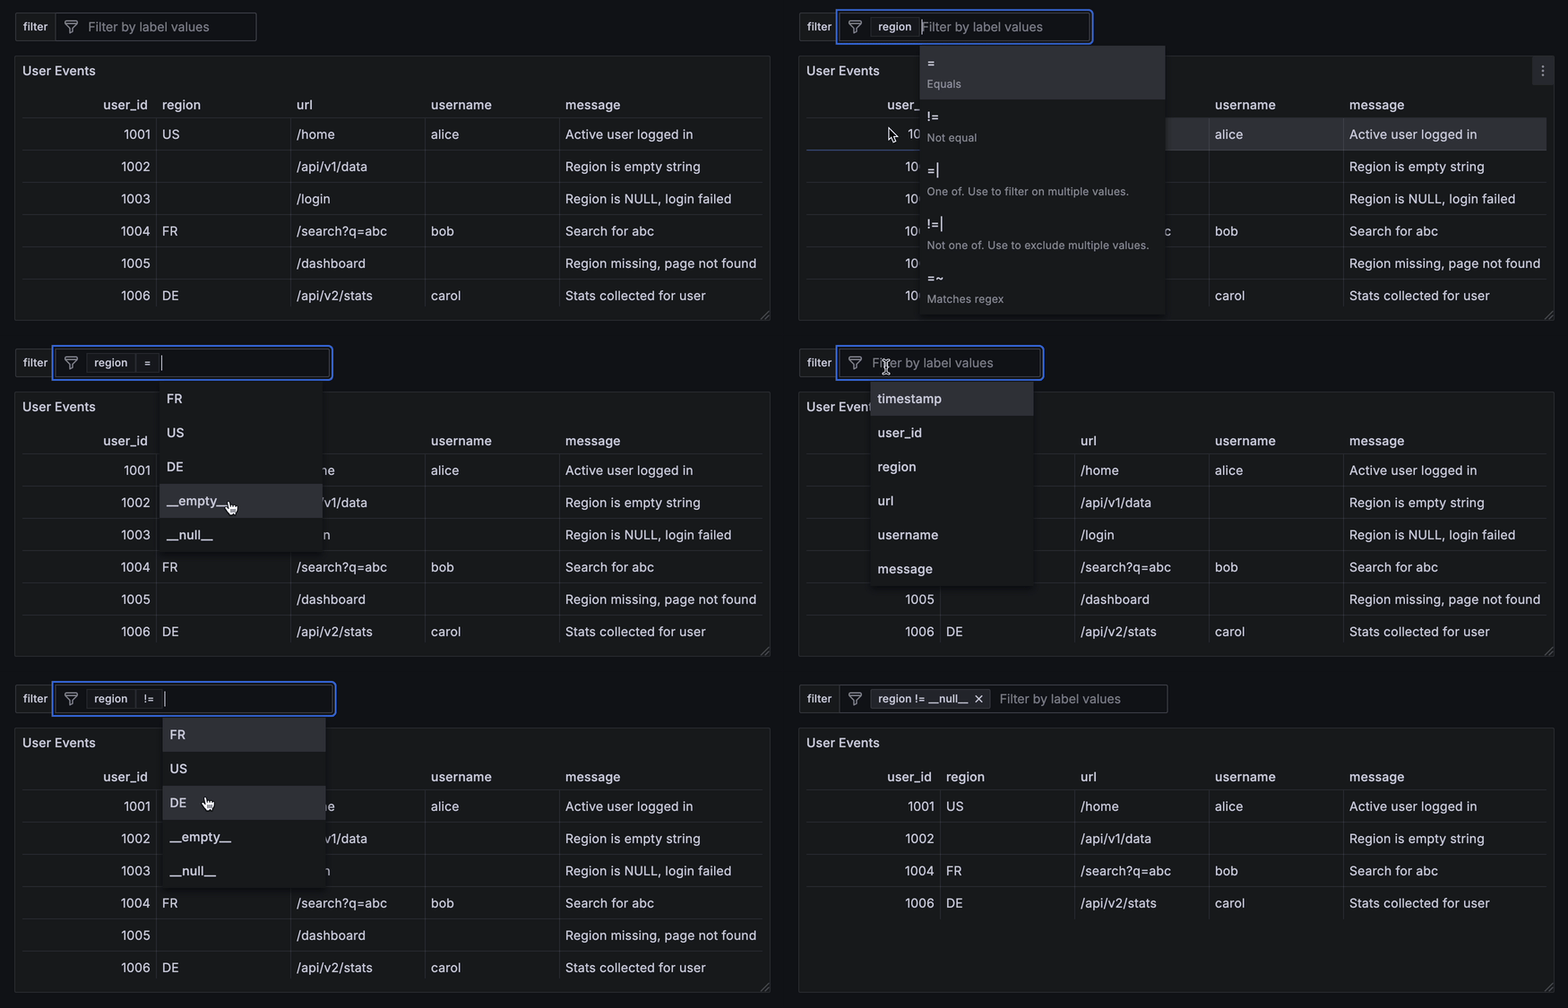
Empty and null values
Ad hoc filters support two synthetic values to help identify and query rows with missing or blank data:
__null__: matches rows where the column value isNULL.__empty__: matches rows where the column value is an empty string.
__empty__ appears in the suggestions only if the underlying data contains an empty string for the selected column
during the current dashboard time range. __null__ appears whenever the selected column's type is Nullable,
regardless of whether any NULL was actually observed in that range — aggregate queries skip NULLs, so their
presence can't be inferred from the returned values, but selecting __null__ is always a valid filter for a nullable
column.
If the data contains literal values such as __null__ or __empty__, those will also be matched by the corresponding
filters.
Value suggestion guardrails
To keep the ad hoc filter value dropdown responsive on high-cardinality columns and long dashboard time ranges, value suggestions are computed by a bounded, best-effort query rather than an exhaustive scan:
- Trailing 24h window: suggestions are computed over the trailing 24 hours of the dashboard's time range (rounded to 5-minute boundaries). A value that last occurred earlier than that window will not appear in the suggestions, but it can still be entered manually and used as a filter — the applied filter itself is unaffected.
Mapcolumn keys: for aMapcolumn the key dropdown offerscolumn['key']entries discovered by scanning the same trailing 24-hour window, so a key that did not occur in that window is not offered and must be typed in. Keys for plain (non-Map) columns come fromDESCRIBEand are always listed in full.- Approximate top values: up to 100 of the most frequent values are returned using an approximate (
topK) aggregation, so inclusion and ordering near the cutoff are approximate rather than exact. - Execution-time breaker: every metadata query the plugin issues on its own behalf (value suggestions, map-key
discovery, schema/table/column lookups) carries a Hydrolix-native
hdx_query_max_execution_time = 10query setting, so a slow lookup is cancelled after 10 seconds instead of hanging.hdx_query_max_execution_timeand Hydrolix'smax_execution_timeare the same underlying setting; if either is also set at the data source level (Query Settings subsection), the smaller of the two values wins — a data source-level value can lower the metadata timeout below 10 seconds, but can never raise it above the 10-second default (a data source-level value of0, meaning "unlimited" on Hydrolix, is ignored for this purpose). Note that a data source-level override of this setting still applies to all queries from the data source, not only metadata lookups — it is only the metadata breaker's own effective value that is capped at 10 seconds. - Partial results on timeout: the value-suggestion and map-key queries also carry
SETTINGS timeout_overflow_mode = 'break', hdx_query_max_timerange_sec = 87000in the SQL text. Where the engine honorstimeout_overflow_mode = 'break', hitting the execution-time cap returns the top values computed over the rows read so far instead of failing the query; if the cap is hit before any values are aggregated, the dropdown simply shows no suggestions.hdx_query_max_timerange_secis a server-side backstop for the trailing-24h window above and is not configurable from the data source settings.
Because of these bounds the dropdowns are a convenience, not the set of filters the plugin accepts — a key or value missing from a suggestion list still filters correctly once applied. Typing one in requires Allow custom values on the ad hoc variable (see Configure ad hoc filters); with that option off, Grafana will not commit anything the suggestion list did not offer.
Wildcards
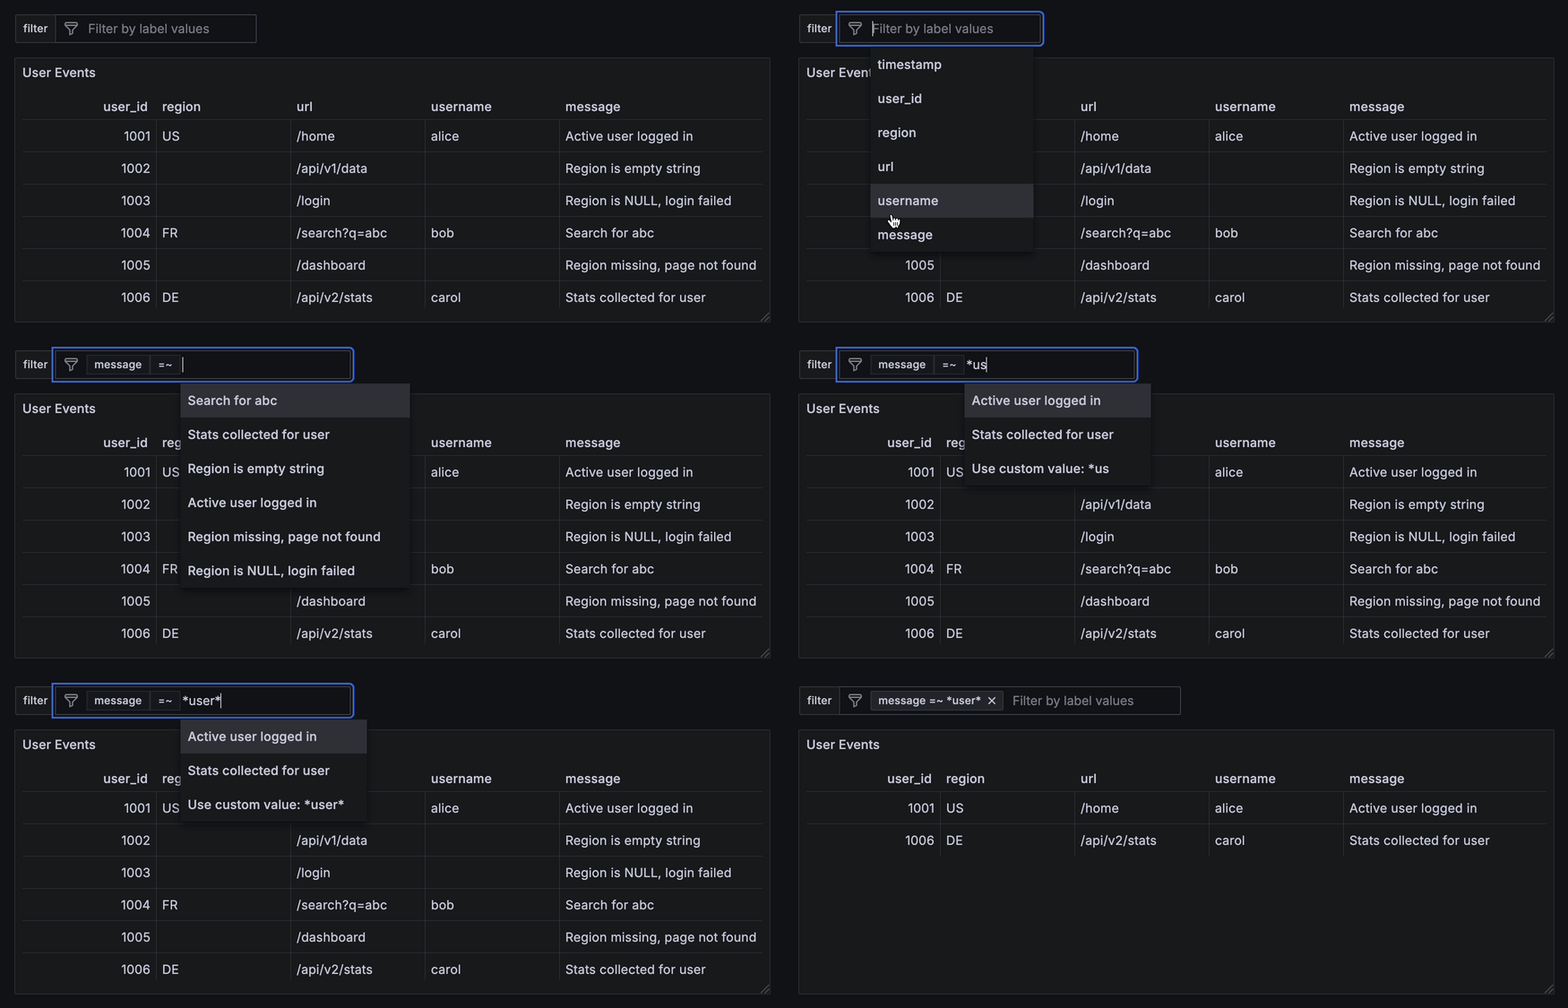
Ad hoc filters support wildcard filtering using the =~ and !~ operators. These operators allow matching or excluding
values based on simple patterns that include the * wildcard character. Full regular expressions are not supported.
The * symbol matches any sequence of characters, including an empty one. For example, *user* will match any value
that contains the substring user, regardless of what comes before or after.
To match a literal asterisk (*), escape it with a backslash (\*). For example, to search for the exact string
*debug*, enter: \*debug\*.
To apply a wildcard filter:
- On the dashboard, click inside the filter field.
- Select the column you want to filter, such as
message. - Choose the operator
=~or!~. - Type your full wildcard pattern, for example
*user*. - Do not select any of the suggested values while typing.
- As you type, an option appears at the bottom of the suggestion list:
Use custom value: *user*. - Click this option to apply the filter.
Round timestamps
To control how time ranges are aligned, $from and $to timestamps can be rounded to the nearest multiple of the round
value, set in the query editor or in the data source settings.
When a round value is set in the query editor, it takes precedence and is always used. If no round is set in the query editor,
the data source falls back to the default round, if it is configured and non-zero. If neither is set, or if the round value
in the query editor is explicitly set to 0, no rounding is applied and the original timestamps are used as-is.
The supported time units for rounding are: ms (milliseconds), s (seconds), m (minutes), and h (hours).
Examples
| Default round | Query round | Effective round | Input timestamp | Rounded timestamp |
|---|---|---|---|---|
5m |
not set | 5m |
10:07:20 |
10:05:00 |
5m |
1m |
1m |
09:02:30 |
09:03:00 |
| not set | not set | not applied | 08:01:23 |
08:01:23 |
5m |
0 |
not applied | 07:45:50 |
07:45:50 |
Template variables
Hydrolix queries fully support Grafana's template variables, allowing the creation of dynamic and reusable dashboards.
For more details about template variables, see Grafana’s Template variables documentation.
Annotations
The Hydrolix data source can be used as a Grafana annotation source. Add an annotation under Dashboard settings → Annotations, pick the Hydrolix data source, and write a SQL query that returns the rows you want to mark. The SQL editor opens blank — there is no starter template. If you leave the SQL empty the query is skipped silently and no markers are rendered (no error toast).
Binding result columns to annotation fields (time, time end, title, text, tags) is handled by Grafana's built-in annotation field-mapping UI — the plugin imposes no column-name convention. Any column from your SELECT can be mapped to any field via that UI.
Instant annotations
A query that returns rows with a single time column will render instant markers — one vertical line per row.
SELECT
  event_time,
  event_type,
  message
FROM events
WHERE $__timeFilter(event_time)
ORDER BY event_time
Map event_time → Time, message → Text, and event_type → Tags in the annotation field-mapping UI.
Region annotations
To render a region (a shaded interval rather than an instant), return both a start and an end timestamp, then map the second one to Time end.
SELECT
  started_at,
  ended_at,
  incident_name,
  severity
FROM incidents
WHERE $__timeFilter(started_at)
ORDER BY started_at
Map started_at → Time, ended_at → Time end, incident_name → Text, severity → Tags.
Ad hoc filters set on the dashboard apply to your panel queries; they do not affect annotation queries (annotation queries are intentionally insulated from the panel filter cache so refreshing one does not clobber the other).
Grafana Assistant
Grafana Assistant cannot query Hydrolix through its built-in SQL tools — they match datasources against a hard-coded allowlist that does not include this plugin. Assistant support is provided instead by registering the Hydrolix MCP server as a custom MCP server and installing the Hydrolix skill.
The plugin contributes query context — the datasource, cluster, SQL, time range, and the table's schema and primary time column — plus an Assistant button in the query editor. Without the MCP server, Assistant can write and explain Hydrolix SQL but cannot execute it.
The skill document to install is docs/assistant-skill.md. Before registering the MCP server, note two things: queries through it bypass Grafana datasource permissions and per-user OAuth forwarding (the server authenticates with its own Hydrolix credential), and the server must be network-reachable from your Grafana instance — check that first by curling its /mcp endpoint, where an authentication failure is the expected reachable-server response.
For the full procedure — reachability and same-cluster checks, the "Just me" versus "Everybody" scope trade-off, and provisioning the skill with the read-only tools auto-approved — see docs/grafana-assistant.md.
Grafana Cloud
Connect any plugin in Grafana Cloud.
- 150+ data source integrations
- Grafana Assistant - AI that correlates your data, builds queries, and answers questions
- 10k Prometheus metrics + 50 GB logs, traces, and profiles on the free tier
- ...and more
Insights
- Adoption
Running on 613 active Grafana instances.
- Activity
Last updated 16 Sep 2026.
4 releases in the past year.
- Queries
621,462 total queries served across all Grafana Cloud instances.
- Version
- 0.12.2
- Dependencies
- Grafana >=10.4.0
- Developer
- hydrolix.io
Grafana Cloud
Connect any plugin in Grafana Cloud.
- 150+ data source integrations
- Grafana Assistant - AI that correlates your data, builds queries, and answers questions
- 10k Prometheus metrics + 50 GB logs, traces, and profiles on the free tier
- ...and more