
Helin Connect Data Hub Datasource



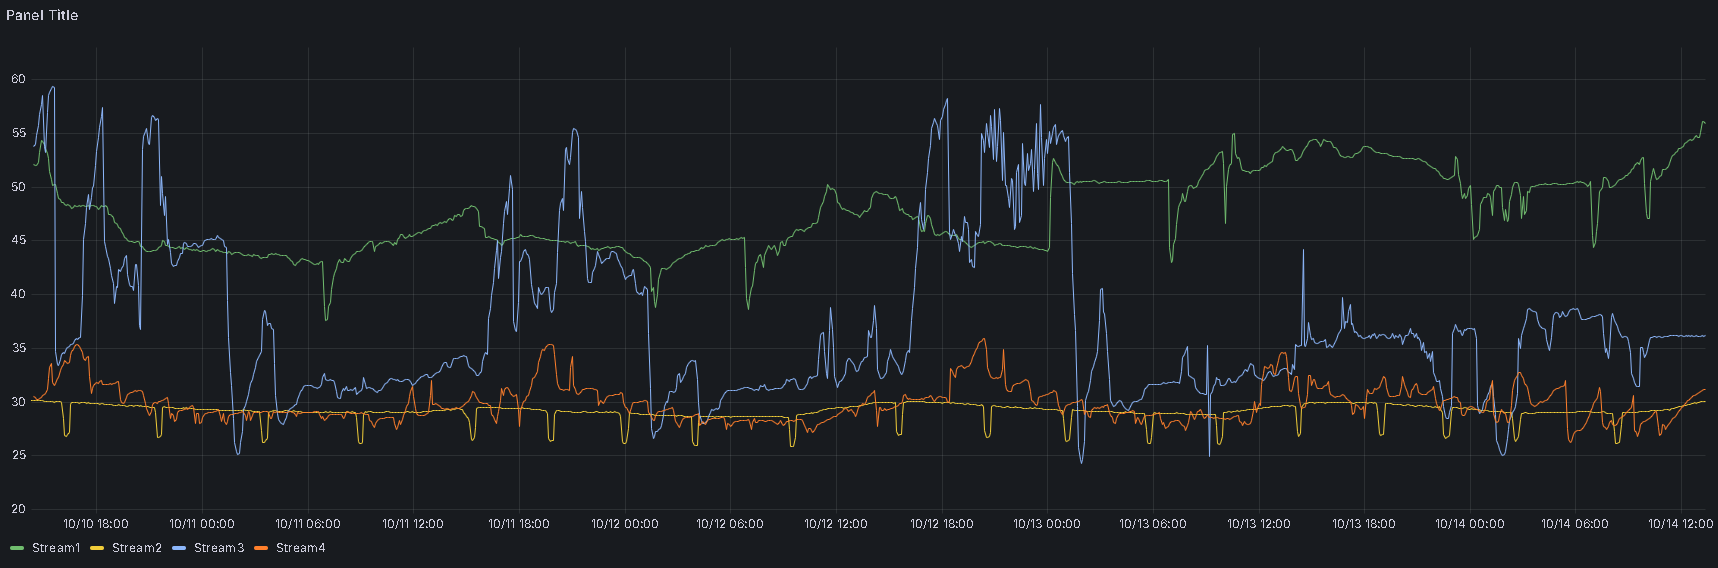
Helin data source for Connect Data Hub databases. This custom plugin builds on top of the AVEVA Sequential Data Store (SAMPLE) plugin, extending its features.
With this plugin, you can:
Build Grafana dashboards for Connect Data Hub streams
Visualize large time ranges using smart batching and paging
Retrieve data as raw, interpolated, or auto-optimized for the dashboard
Automatically balance performance and clarity with adaptive datapoint limits
Getting Started
Install new Helin Connect Data Hub data source from the Grafana plugins library.
To configure the plugin start by setting the Connect Data Hub URL. For most customers, the default URL is
https://euno.datahub.connect.aveva.com. You can confirm the correct URL for your account by logging in to Connect Data Hub. Next, provide the required credentials: Tenant ID, Namespace ID, Client ID, and Client Secret. Follow the instructions in this guide to learn how to obtain these values from Connect Data Hub. In addition to the required fields, the plugin also allows optional configuration. You can specify the API version, toggle the use of an OAuth Token and adjust performance-related settings such as Data Batch Size and Auto Max Datapoints.
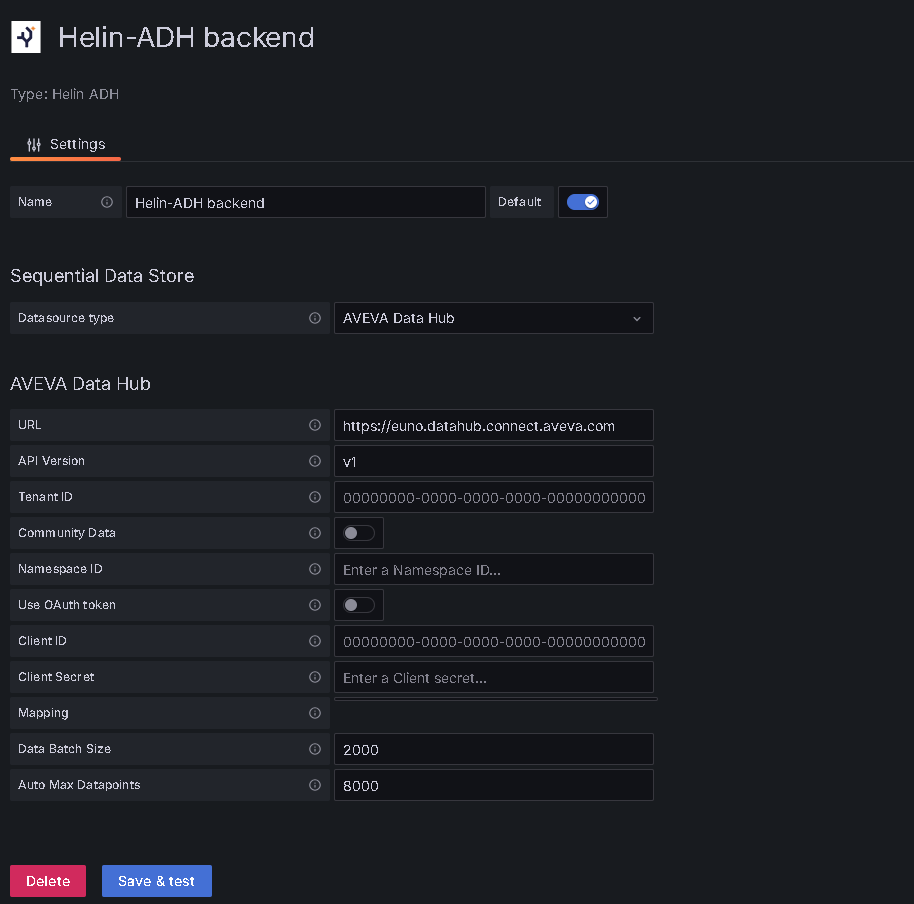
- Click Save & Test. The file contents will be encrypted and saved in the Grafana database.
Creating Helin Connect Data Hub Based Panels
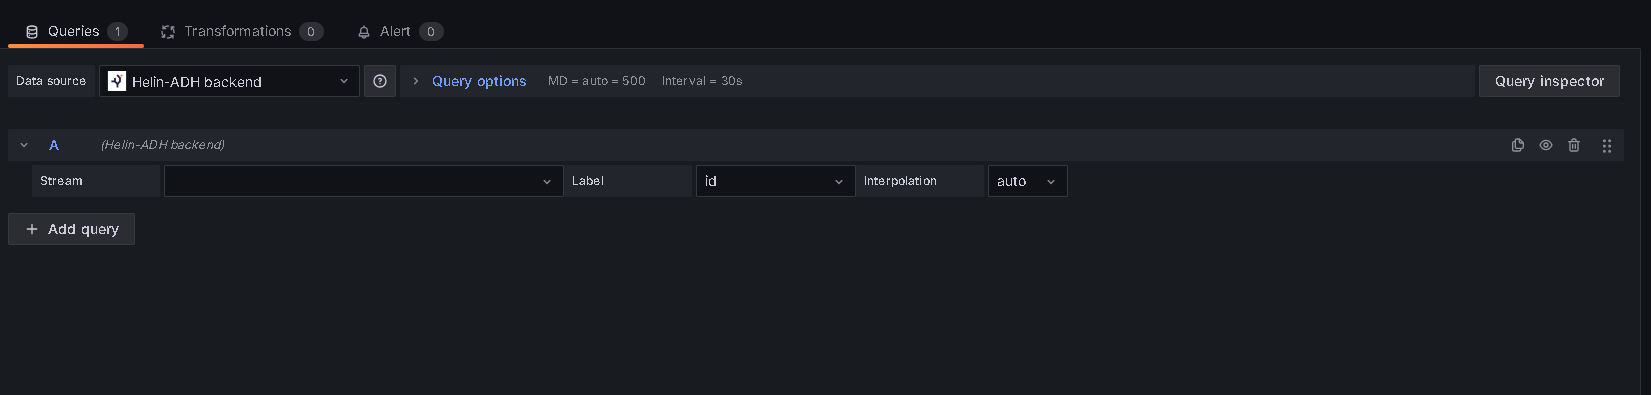
Once you have configured the data source, you can start creating Helin Connect Data Hub based panels. Go to the Queries tab and select the Helin Connect Data Hub data source you defined earlier.
Key Features
1. Query setup
Stream: Select the stream name.
Label: Choose which labels to display alongside the data points. Options include: id, name and description.
Interpolation: auto, true or false.
2. Interpolation Modes
false: Returns raw data. Note that can overload your browser tab and result in unmanageable datasets for larger time windows. Consider using auto mode to avoid such issues.
true: When selected, a new field appears which allows to choose a time interval. It returns interpolated data within the selected time interval. Data points are interpolated from raw data and are equally spaced.
auto: The system estimates the number of data points and retrieves either raw or interpolated data within a time interval. Note that the size of the dataset is determined at run time such that it is manageable and detailed enough for meaningful visualization in the dashboard.
3. How Data is Loaded
Options provided by Grafana for setting max datapints, etc. are not integrated with our datasource. Instead data loading depends on two configuration parameters available in the data source settings:
batchSize determines the size of each data batch loaded. The default value is 2000, but it can be adjusted. Larger batch sizes may speed up data retrieval but could increase memory usage.
autoMaxDatapoints is used in auto mode to decide whether raw or interpolated data should be loaded. The default value is 8000, chosen based on typical screen resolutions. Generally, between 3000 and 8000 data points can be rendered clearly on most screens, but visual clarity decreases sharply beyond that range.
4. Handling multi-field query results
Single queries, returning streams with multiple fields will be returned with name "StreamId + (FieldName_i)", to prevent buggy behaviour with non-unique named returned items.
5. Filtering out unnecesary fields
It’s possible to filter out unnecessary fields so that data you don’t need won’t be visualized.
To do this in Grafana go to Transformations → Add transformation → Rename fields by regex. In the Identifier field, enter a regex that includes everything except the unwanted fields. For example, the following regex will include all fields except those whose names contain “quality” or “Quality”: ^(?!.*(quality|Quality)).*$.

6. Improved Search Bar
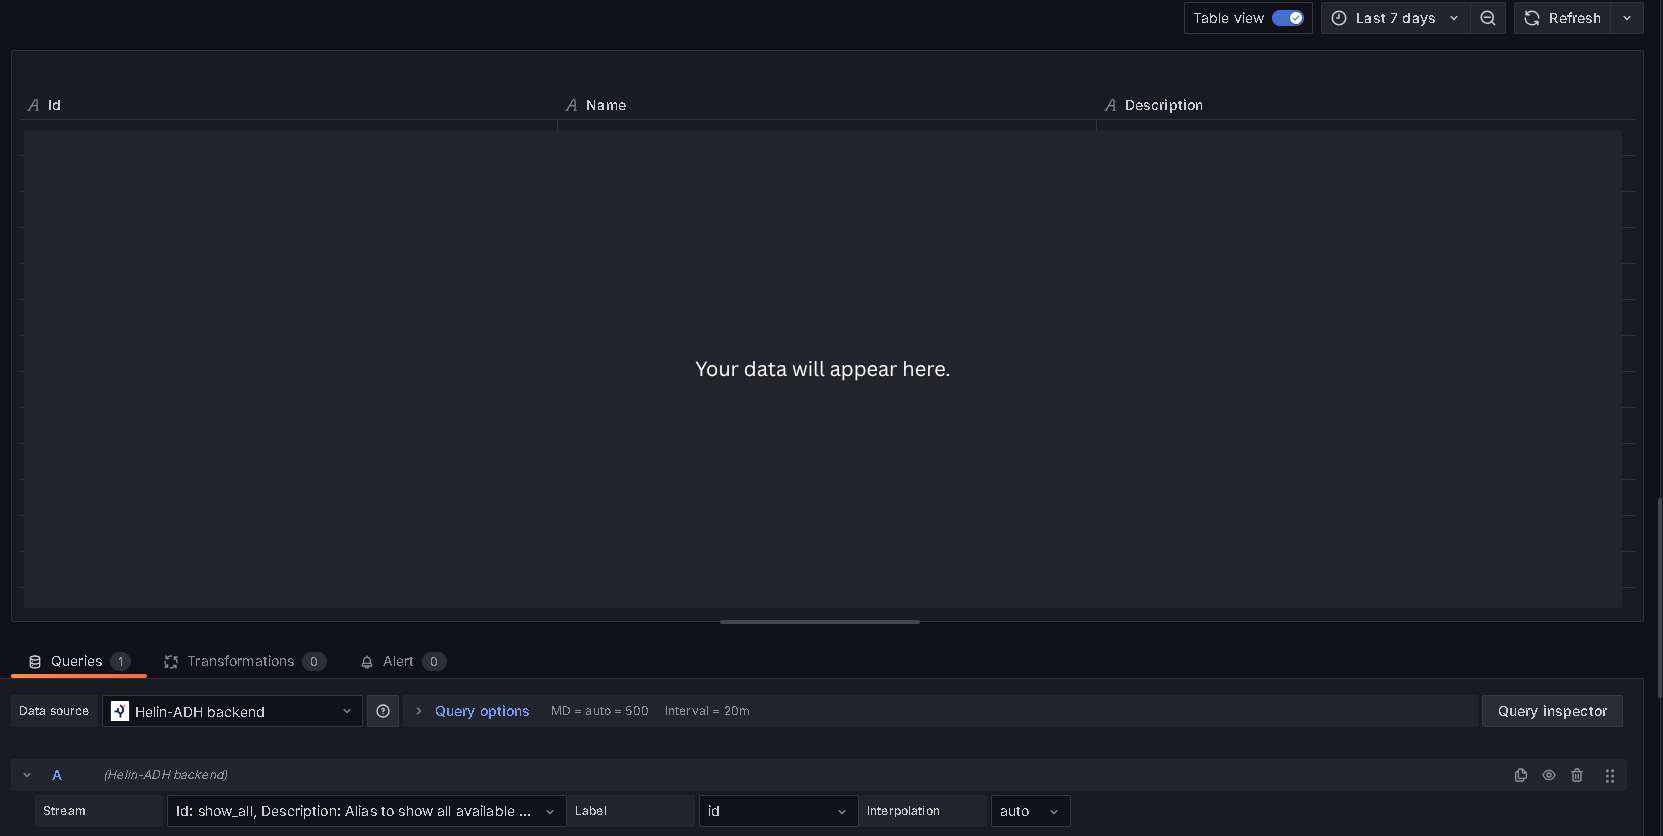
The updated search bar queries all available information for every stream, including
Id,Name, andDescription. As a result, a searched keyword will return any streams that partially match these parameters.A new magic keyword ("Show All") has been introduced to serve as an alias for querying all available streams in the database. The results of this query are not time-series, so they will only appear correctly if the Grafana panel type is set to
Table.
License
This plugin is proprietary software. Use is governed by the End User License Agreement (EULA).
Copyright © 2025 Helin Data B.V. All rights reserved.
Grafana Cloud
Connect any plugin in Grafana Cloud.
- 150+ data source integrations
- Grafana Assistant - AI that correlates your data, builds queries, and answers questions
- 10k Prometheus metrics + 50 GB logs, traces, and profiles on the free tier
- ...and more
Insights
- Activity
Last updated 1 Oct 2026.
1 release in the past year.
- Queries
0 total queries served across all Grafana Cloud instances.
- Version
- 1.0.0
- Dependencies
- Grafana >=11.5.1
- Developer
- Helin
Grafana Cloud
Connect any plugin in Grafana Cloud.
- 150+ data source integrations
- Grafana Assistant - AI that correlates your data, builds queries, and answers questions
- 10k Prometheus metrics + 50 GB logs, traces, and profiles on the free tier
- ...and more