
Graphviz Panel


ℹ️ Private Preview: This plugin is currently in Private Preview release status. It is not intended for production environments. Support from Grafana is limited, and no SLA is provided.
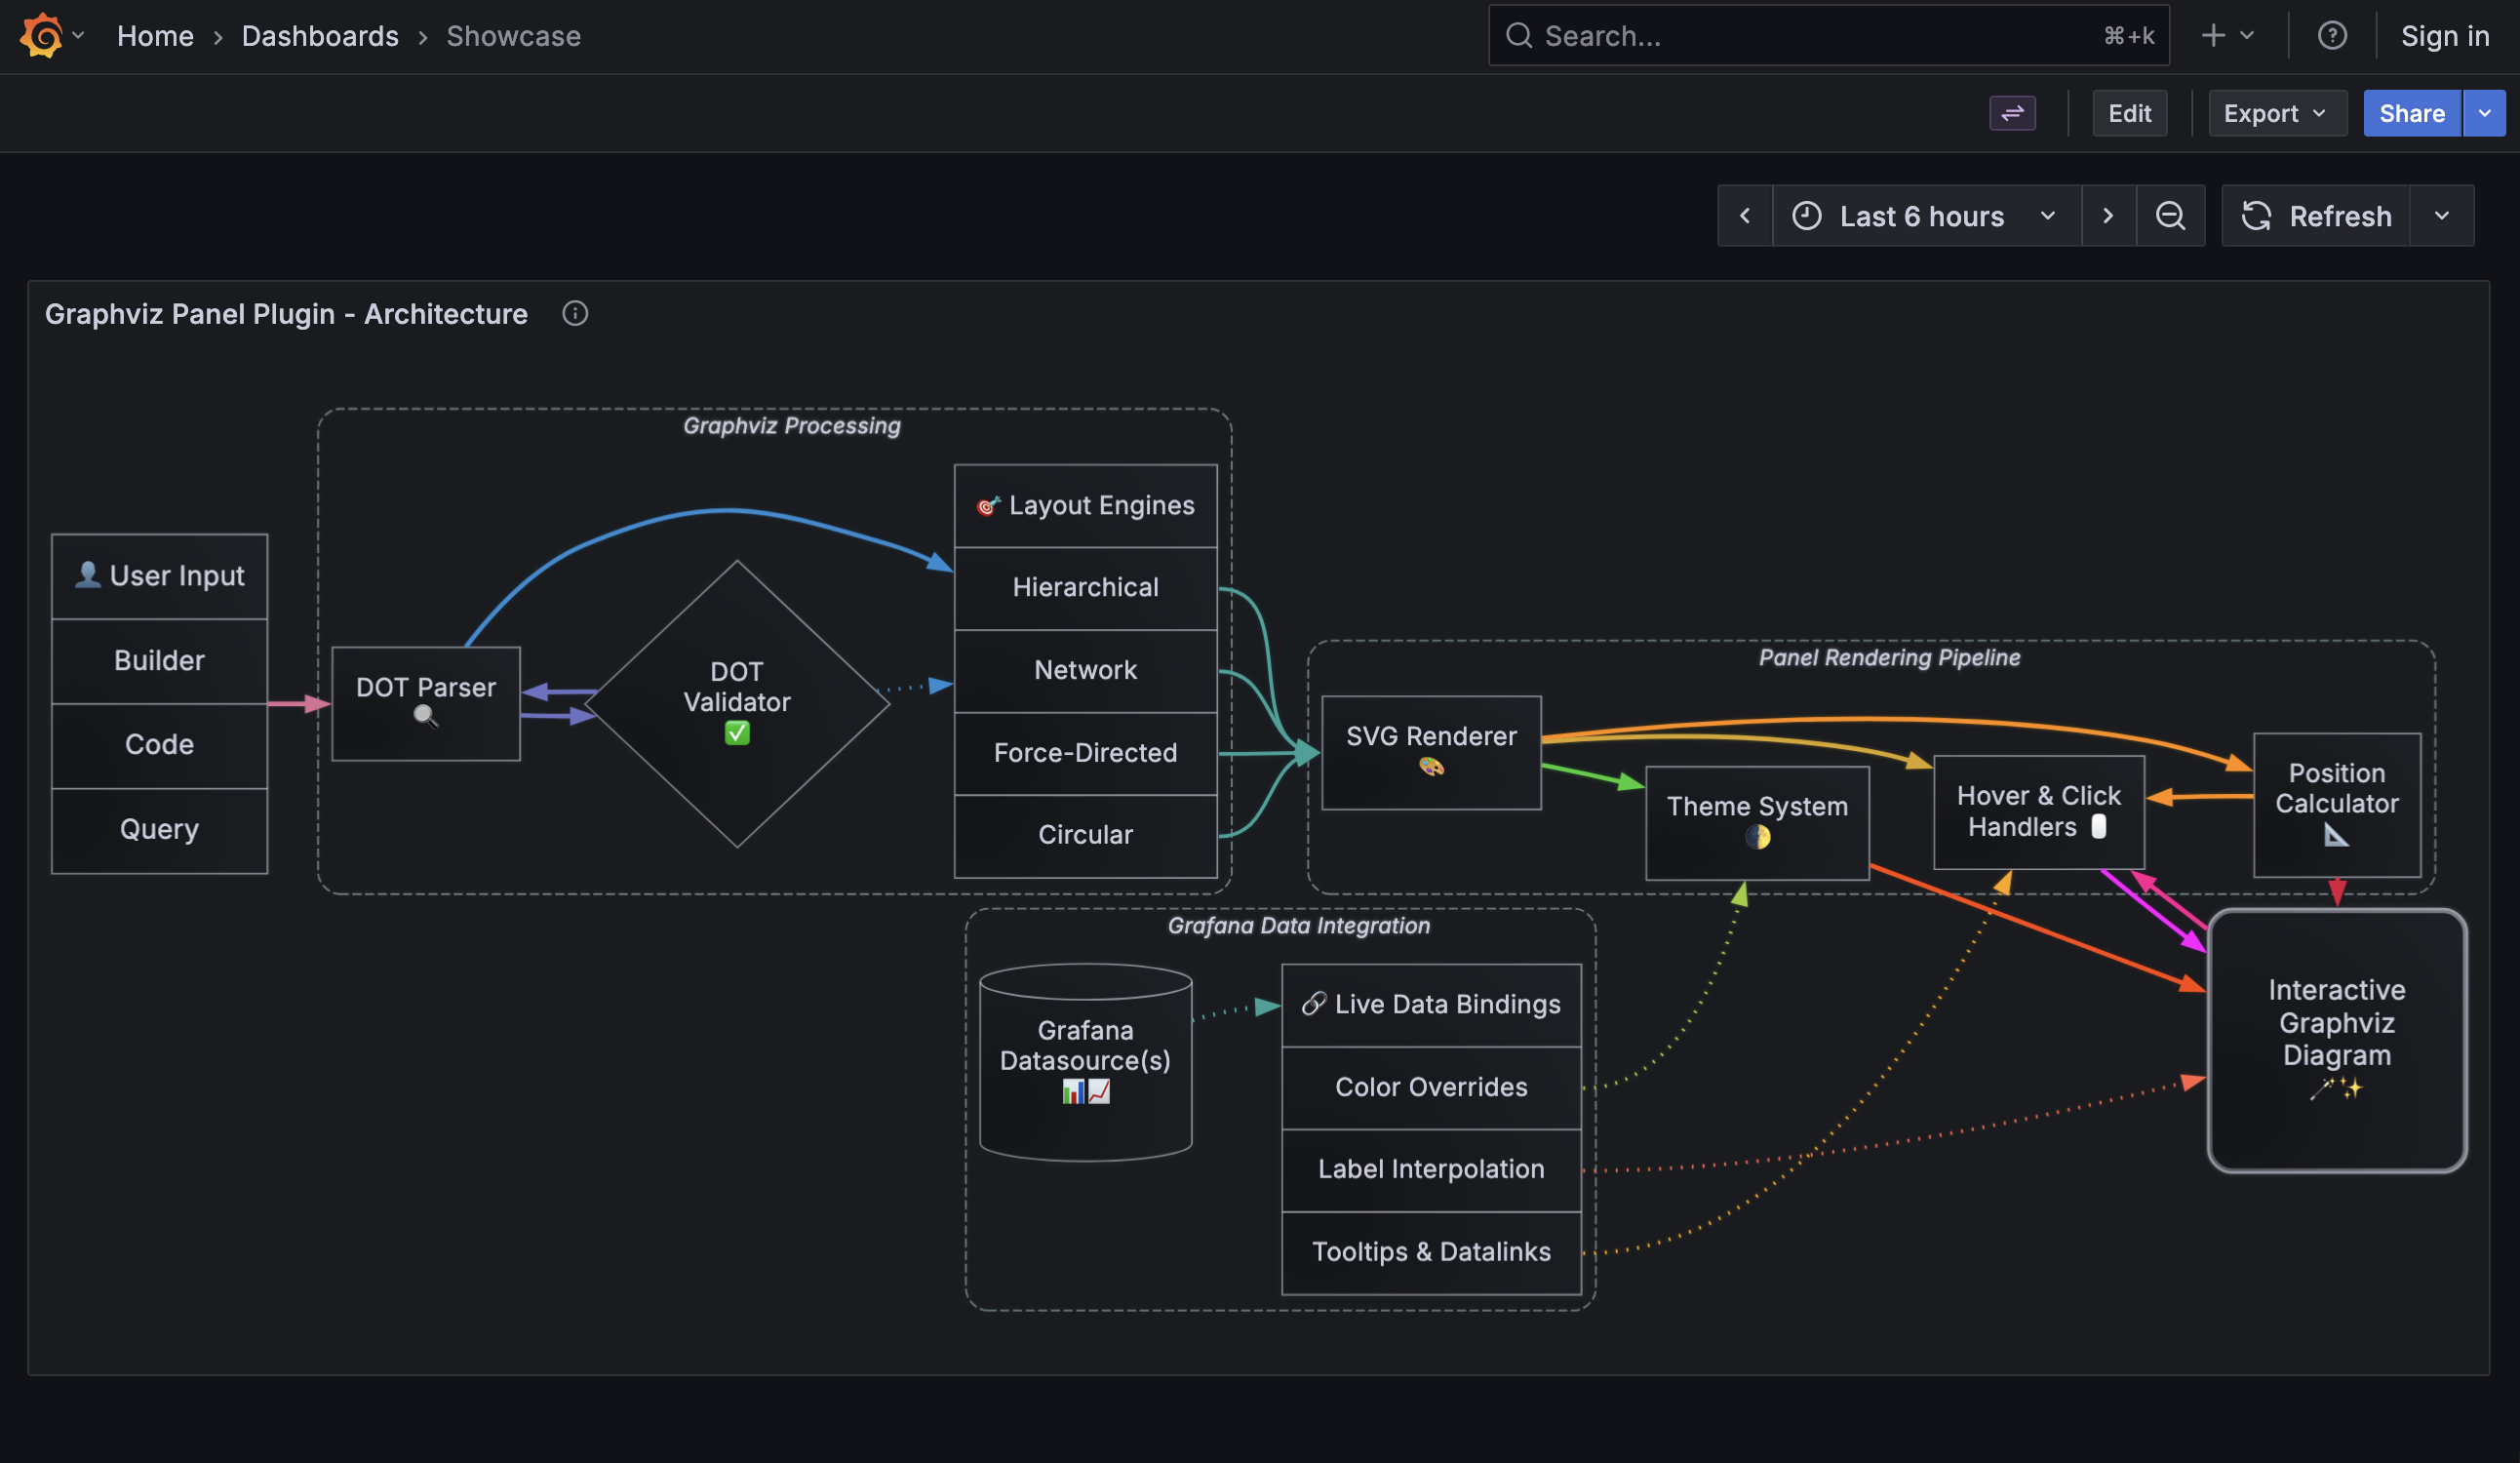
Visualize relationships, flows, and architectures using the Graphviz DOT language with live metrics from any Grafana data source.
Define diagrams as code, bind metrics to visual properties, and let Graphviz layout engines handle the rest. Perfect for service topologies, business processes, infrastructure architectures, and organizational structures that update automatically with your data.
Why Graphviz Panel?
Map metrics to your mental models. Grafana excels at time-series visualization, but operational insights often live in the relationships between things: service dependencies, business workflows, network topologies. This panel bridges that gap.
Diagrams as code. Define once, reuse everywhere. Scale across your organization with infrastructure-as-code. Grafana AI Assistant is already fluent in DOT syntax.
Data-driven diagrams. Color nodes by health thresholds, update labels with live values, scale edge widths by throughput—all from your existing data sources.
Quick Start
1. Choose Your Input Mode
The panel supports three ways to create diagrams:
| Mode | Best For | Data Required |
|---|---|---|
| Builder mode | Visual construction without code | None (manual drag-and-drop) |
| Code mode | Full control via DOT syntax | Static DOT string or template |
| Query mode | Queried from a data source | DataFrame with DOT column |
2. Builder Mode (No Code Required)
- Add a new panel and select Graphviz visualization
- Set Input mode to Builder
- Click Add Node or Add Edge to construct your diagram visually
- Configure layout engine (hierarchical, network, circular, etc.)
- Add queries and bind metrics to node colors, labels, or edge widths
3. Code Mode (Full DOT Syntax)
- Set Input mode to Code
- Write your diagram in DOT syntax:
digraph {
  Frontend [label="Web App"];
  API [label="API Gateway"];
  Database [label="PostgreSQL"];

  Frontend -> API [label="HTTPS"];
  API -> Database [label="SQL"];
}
- Use dashboard variables for dynamic content:
digraph {
  service [label="${service_name}\nCPU: ${cpu_usage}%"];
  database [label="${database_name}"];

  service -> database;
}
- SEE: Graphviz documentation for a complete DOT language reference
4. Query Mode (Data-Driven)
Return a DataFrame with a column containing DOT syntax:
Example query result:
| timestamp | dot_diagram |
|---|---|
| 2026-04-14 10:00:00 | digraph { A -> B -> C; } |
The panel automatically renders the DOT string from your query.
- SEE: Grafana Infinity plugin to query APIs, files, and other sources for dynamic DOT diagrams
Mapping Metrics to Visual Properties
Make diagrams dynamic by binding data to visual elements:
Node Overrides
Target nodes by ID or pattern and map metrics to properties:
- Open panel settings → Node Overrides
- Add override rule (e.g., match nodes with ID pattern
server-*) - Set Color by field or Label template
Example: Color by CPU threshold
- Field:
cpu_usage - Thresholds: Green (< 70%), Yellow (70-90%), Red (> 90%)
Edge Overrides
Control edge appearance based on data:
Example: Edge width by throughput
- Field:
requests_per_sec - Width: Map 0-1000 req/s to 1-10px width
Label Templates
Use ${field_name} syntax to inject live data matched to a node or edge by ID:
${service_name}
CPU: ${cpu_usage}%
Mem: ${memory_usage}GB
Named Thresholds
Define reusable color schemes:
- Panel settings → Named Thresholds
- Create threshold (e.g., "Health Status")
- Apply to multiple nodes/edges by field value
Layout Engines
Graphviz provides multiple layout algorithms. Choose based on your diagram structure:
| Layout Engine | Algorithm | Best For | Example Use Case |
|---|---|---|---|
| dot | Hierarchical | Top-down flows | CI/CD pipelines, org charts |
| neato | Network | Interconnected systems | Service meshes, peer networks |
| fdp | Force Directed | Organic clustering | Microservice dependencies |
| circo | Circular | Radial relationships | Hub-and-spoke architectures |
Configure in panel settings → Layout Engine.
Styling Options
Spline Types
Control edge routing:
- Polyline - Straight line segments
- Curved - Smooth Bézier curves
- Orthogonal - Right-angle connections
Rank Direction
Control flow direction (applies to dot layout):
- TB (Top to Bottom)
- LR (Left to Right)
- BT (Bottom to Top)
- RL (Right to Left)
Advanced Features
Dashboard Variables
Use Grafana variables in DOT syntax:
digraph {
  env [label="Environment: ${environment}"];
  region [label="Region: ${region}"];

  env -> region;
}
Tooltips and Data Links
Configure rich tooltips that appear when hovering or clicking nodes/edges:
- In Node Overrides or Edge Overrides, add a Tooltip rule
- Set tooltip content template using
${field_name}syntax - Add data links to drill down to other dashboards or external URLs
- Click any node/edge to pin the tooltip; hover over links to preview
Example tooltip template:
CPU: ${cpu_usage}%
Memory: ${memory_mb}MB
Status: ${status}
Tooltips support dashboard variables, field values, and special context variables like ${__source} and ${__target} for edges.
Advanced DOT Features
The panel supports all Graphviz DOT features including:
- HTML-like labels - Rich text formatting with tables
- Record-based nodes - Structured node layouts with ports
- Subgraphs and clusters - Group related nodes visually
- Node shapes - All shapes are supported. The builder mode shape picker includes
polygon,record, andMrecordwith a note that they require additional configuration, and lists aliases (oval,none,plain,rect,rectangle) with descriptions identifying their canonical equivalents.
Generate Diagrams-as-Code from Infrastructure-as-Code
Use external tools to generate DOT diagrams automatically:
Terraform:
# Generate infrastructure graph
terraform graph > diagram.dot
- SEE: Terraform graph
Helm/Kubernetes:
# Use kubectl graph plugin
kubectl krew install graph
kubectl graph deployments --namespace prod > k8s-deps.dot
- SEE: kubectl-graph
Store generated DOT files in your repository and load them via Query mode, or use Grafana provisioning to automatically update diagrams from CI/CD pipelines.
Configuration Reference
Panel Options
Configure in panel settings:
- Input mode - Builder, Code, or Query mode
- Layout engine - dot, neato, fdp, or circo
- Rank direction - TB, BT, LR, or RL (dot layout only)
- Spline type - Polyline, Curved, or Orthogonal edge routing
Node/Edge Overrides
Target elements by ID or pattern to apply rules:
- Color by field - Map data field to colors via thresholds
- Label template - Use
${field_name}syntax for dynamic labels - Width by field - Scale edge widths by data values (edges only)
The panel supports all standard Grafana panel options.
Examples
Service Dependency Graph
digraph services {
  rankdir=LR;
  node [shape=box style=filled];

  frontend [fillcolor="#4ecdc4" label="Frontend\n${frontend_rps} req/s"];
  api [fillcolor="#45b7d1" label="API Gateway\n${api_rps} req/s"];
  db [fillcolor="#ffeaa7" label="Database\n${db_connections} conn"];

  frontend -> api [label="HTTPS"];
  api -> db [label="PostgreSQL"];
}
Business Process Flow
digraph checkout {
  rankdir=TB;
  node [shape=box style="filled,rounded"];

  cart [label="Cart\n${cart_users} users"];
  checkout [label="Checkout\n${checkout_users} users"];
  payment [label="Payment\n${payment_users} users"];

  cart -> checkout [label="${cart_to_checkout}% conversion"];
  checkout -> payment [label="${checkout_to_payment}% conversion"];
}
Resources
- Graphviz Official Documentation
- DOT Language Reference
- Node Shapes Gallery
- Color Names Reference
- Graphviz Examples Gallery
Feedback and Support
- GitHub Issues: Report bugs or request features
- Community Forum: Ask questions on the Grafana Community
- Documentation: Full Grafana documentation
License
AGPL-3.0 License. See LICENSE for details.
Grafana Cloud
Connect any plugin in Grafana Cloud.
- 150+ data source integrations
- Grafana Assistant - AI that correlates your data, builds queries, and answers questions
- 10k Prometheus metrics + 50 GB logs, traces, and profiles on the free tier
- ...and more
Insights
- Adoption
Running on 1,938 active Grafana instances.
- Activity
Last updated 17 Aug 2026.
4 releases in the past year.
- Version
- 0.0.7
- Dependencies
- Grafana >=12.3.0-0
- Developer
- Grafana Labs
Grafana Cloud
Connect any plugin in Grafana Cloud.
- 150+ data source integrations
- Grafana Assistant - AI that correlates your data, builds queries, and answers questions
- 10k Prometheus metrics + 50 GB logs, traces, and profiles on the free tier
- ...and more