
Zscaler ZDX Data Source Plugin for Grafana
Description
The Zscaler ZDX data source plugin is a Grafana backend datasource plugin that brings Zscaler Digital Experience (ZDX) monitoring data into Grafana. It queries the ZDX API through Zscaler OneAPI and turns application-experience scores, device health, network-path diagnostics, alerts, and software inventory into dashboards, Explore queries, and alert rules.
The plugin is strictly read-only: it never creates, modifies, or deletes anything in your Zscaler tenant.
Features
- Query and visualize ZDX monitoring data directly within Grafana
- Support for multiple data categories:
- Application Experience: ZDX scores, score trends, Page Fetch Time / DNS time / availability metrics, and per-application user and device counts
- Device and Network Health: device inventory with hardware, network, and software detail; CPU, memory, and Wi-Fi health metrics; call-quality metrics; device events; web-probe and Cloudpath probe performance down to hop-level latency
- Alerts and Incidents: ongoing and historical alerts with a derived resolution duration, alert detail, and the devices each alert impacts
- Fleet Inventory: software footprint per package plus per-user and per-device install records
- Directory Context: users with their devices and geolocations, departments, locations, and active geolocations
- Dynamic, searchable dropdown variables for every identifier (device, application, alert, probe, trace, software, user, department, location, geolocation) backed live by the ZDX API - no manual ID lookup required
- Six bundled dashboards covering application experience, device health, device network diagnostics, alerts, software inventory, and users/locations
- Built-in pagination that fetches every page ZDX returns, with no internal cap
- Sanitized error handling - raw upstream error detail is logged server-side only
Compatibility
| Component | Version / Detail |
|---|---|
| Grafana | >= 12.3.0 |
| ZDX API | Zscaler OneAPI (ZIdentity) |
| Authentication | OAuth 2.0 client credentials |
Demonstration Video
Please find attached a demo video showcasing how to use the Zscaler ZDX integration.
Installation
Requirements
- Grafana >= 12.3.0
- A Zscaler tenant with ZDX enabled
- A OneAPI (ZIdentity) API client with ZDX read permissions
Obtain OneAPI Credentials
- Sign in to the Zscaler ZIdentity / OneAPI admin console (
https://{vanityDomain}-admin.zslogin.net). - Open Administration > API Clients and create an API client.
- Assign it a role with ZDX read permissions. A client can authenticate successfully and still get "Access denied" for alerts or software inventory if its role omits them.
- Copy the client ID and the client secret, and note your vanity domain - Zscaler shows the secret only once, when the API client is created.
Install the Plugin
Install the plugin from the Grafana Plugin Catalog or using the Grafana CLI:
grafana cli plugins install crestdata-zscalerzdx-datasource
After installation, restart the Grafana server for the plugin to be loaded.
Configure the Data Source
- In Grafana, navigate to Connections > Data Sources > Add data source.
- Search for Zscaler ZDX and select it.
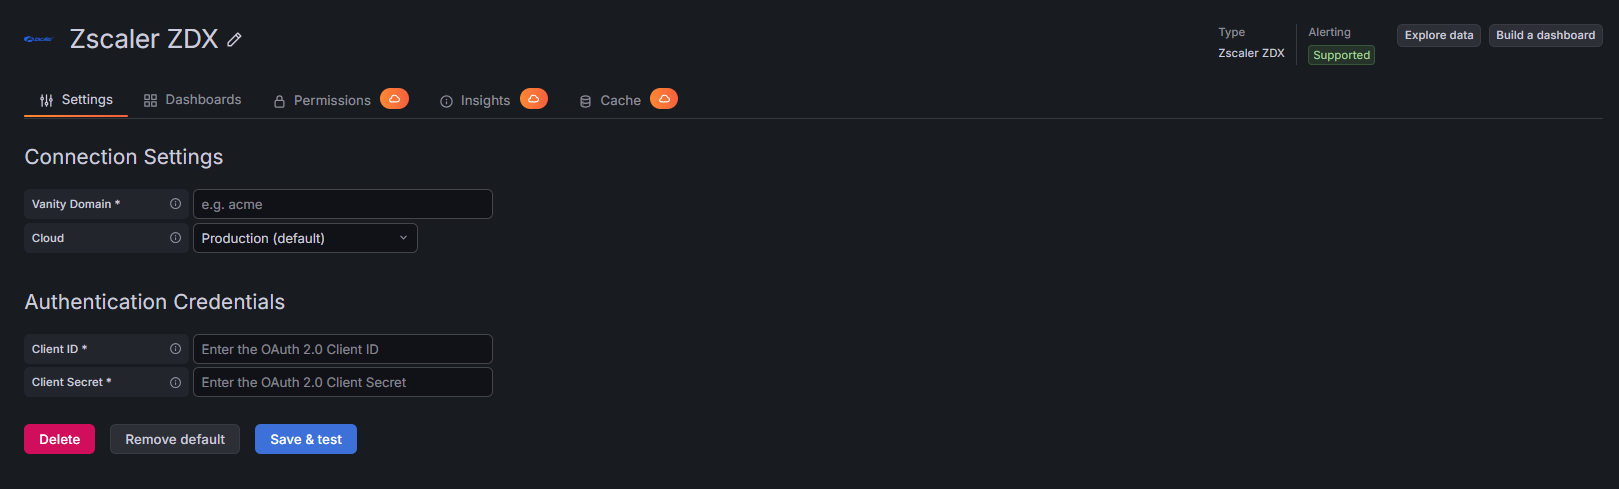
- Fill in the required configuration fields:
| Name | Type | Required | Description |
|---|---|---|---|
| Client ID | String | Yes | OAuth 2.0 Client ID from the Zscaler ZIdentity portal. |
| Client Secret | Secure String | Yes | OAuth 2.0 Client Secret from the Zscaler ZIdentity portal. |
| Vanity Domain | String | Yes | Your organization vanity domain prefix. For the login URL acme-admin.zslogin.net, enter acme. |
| Cloud Environment | String | No | The Zscaler OneAPI cloud. Leave as Production unless your tenant is on a beta, preview, or government cloud. |
- Click Save & Test. The plugin verifies the credentials by listing ZDX departments.
Usage
Query Editor
Add a panel, select the Zscaler ZDX data source, then pick a Query Type. The editor shows only the filters the selected ZDX endpoint supports, and required identifiers are validated before the query runs.
Every identifier field (Device ID, App ID, Alert ID, Probe ID, Trace ID, Software Key, User ID, and the department/location/geolocation scope filters) can be driven by a dashboard variable backed by a live, searchable dropdown - the bundled dashboards wire these up already, so picking a device or application from a table drives every other panel on the page.
Available Query Types
| Query Type | Returns | Required inputs |
|---|---|---|
| Application List | Applications with ZDX score, user and device stats | - |
| Application Score Trend | ZDX score time series | App ID |
| Application Metrics | Page Fetch Time, DNS time, or availability series | App ID, Metric Name |
| Device List | Device inventory with hardware, network, software | - |
| Device Applications | Applications observed on a device, with scores | Device ID |
| Device Health Metrics | CPU, memory, Wi-Fi, and battery series | Device ID |
| Device Call Quality Metrics | MOS, jitter, latency, loss per meeting | Device ID, App ID |
| Device Events | Device configuration and state changes (logs) | Device ID |
| Device Web Probes | Web probes with average score and Page Fetch Time | Device ID, App ID |
| Device Web Probe Trend | Per-probe metric series | Device ID, App ID, Probe ID |
| Device Cloudpath Probes | Cloudpath probes with average leg latency | Device ID, App ID |
| Device Cloudpath Leg Statistics | Per-leg network statistics series | Device ID, App ID, Probe ID |
| Device Cloudpath Hop Detail | Hop-by-hop path detail with per-hop latency | Device ID, App ID, Probe ID |
| Device Top Processes | Top processes captured in a diagnostics session | Device ID, Trace ID |
| Diagnostics Sessions | Diagnostics (deep trace) sessions of a device | Device ID |
| Ongoing Alerts | Currently active alerts | - |
| Historical Alerts | Ended alerts (14-day server-side limit) | - |
| Alert Affected Devices | Devices impacted by an alert | Alert ID |
| Software Inventory | Software footprint per package | - |
| Software Install Records | Per-user and per-device installs of one package | Software Key |
| Departments | Department list | - |
| Locations | Location list | - |
| Active Geolocations | Active geolocations, one hierarchy branch per query | - |
| User List | Users with their devices and geolocations | - |
Time Ranges
Most query types send the dashboard time range to ZDX as server-side from and to filters. The exceptions:
- Snapshot queries - Software Inventory and Diagnostics Sessions have no time dimension, so the dashboard time range is ignored.
- Software Install Records - the endpoint has no time filter. Turn on Use Time Filter to keep only records whose install date falls inside the dashboard time range. It is off by default, and all records are returned.
- Historical Alerts - ZDX rejects ranges wider than 14 days.
Resources Reference
Dashboard variables resolve against these dynamic dropdown resources, served by the plugin's backend:
| Resource | Description | Depends on |
|---|---|---|
| Departments | Department list | - |
| Locations | Location list | - |
| Geolocations | Active geolocations, flattened to leaf-level selectable IDs | - |
| Applications | Application list | - |
| Devices | Device list | - |
| Users | User list, server-side search by name | - |
| Alerts | Ongoing and historical alerts, merged | - |
| Software | Software inventory list | - |
| Web Probes | Web probes for one device/application pair | Device ID, App ID |
| Cloudpath Probes | Cloudpath probes for one device/application pair | Device ID, App ID |
| Diagnostics Sessions | Deep-trace sessions for one device | Device ID |
Included Dashboards
| Dashboard | Focus |
|---|---|
| ZDX Application Experience | Application scores, experience distribution, score and metric trends, user and device context |
| ZDX Device Health | Fleet KPIs, OS and hardware breakdowns, health and call-quality metrics, device events |
| ZDX Device Network Diagnostics | Web probes, Cloudpath legs and hops, diagnostics sessions |
| ZDX Alerts and Incidents | Ongoing alert triage, severity and type breakdowns, mean time to resolution, affected devices |
| ZDX Software Inventory | Software footprint, vendor breakdown, install records |
| ZDX Users and Locations | User directory, device and geolocation context, top countries and Zscaler locations |
Limitations and Recommendations
Performance tips:
- Your ZDX rate-limit budget is shared with every other API consumer in the tenant. Keep dashboard auto-refresh at 30 seconds or slower; the bundled dashboards ship with auto-refresh disabled.
- Scope the department/location/geolocation filters instead of leaving them on All for large tenants, to reduce response size.
Support
For issues, questions, or feature requests, please reach out to grafanalabs.integrations@crestdata.ai
Authors and Acknowledgment
Developed by Crest Data.
License
This plugin is distributed under EULA License. See the LICENSE file for details.
References
Grafana Cloud
Connect any plugin in Grafana Cloud.
- 150+ data source integrations
- Grafana Assistant - AI that correlates your data, builds queries, and answers questions
- 10k Prometheus metrics + 50 GB logs, traces, and profiles on the free tier
- ...and more
Insights
- Adoption
Running on 6 active Grafana instances.
- Activity
Last updated 24 Sep 2026.
2 releases in the past year.
- Queries
0 total queries served across all Grafana Cloud instances.
- Version
- 1.0.3
- Dependencies
- Grafana >=12.3.0
- Developer
- crestdata
Grafana Cloud
Connect any plugin in Grafana Cloud.
- 150+ data source integrations
- Grafana Assistant - AI that correlates your data, builds queries, and answers questions
- 10k Prometheus metrics + 50 GB logs, traces, and profiles on the free tier
- ...and more