
Wiz Data Source for Grafana
Query Wiz CNAPP security data directly from Grafana. The plugin talks to your Wiz tenant's GraphQL API with a Wiz service account and turns issues, vulnerabilities, configuration findings, threat detections, exposure data, cloud inventory, and compliance posture into Grafana panels, Explore results, and alerting queries.
Description
Features
- 13 query types spanning risk, vulnerability, posture, threat, exposure, inventory, activity, and compliance data.
- Server-side filtering where Wiz supports it (severity, status, cloud platform, action, exploit flags) and clearly-marked snapshot query types where it does not.
- The Project filter is a searchable dropdown of your tenant's project names (Issues, Cloud Resources, and Compliance Rule Analytics) — no project ID to already know. Pick a name and the backend resolves it to the real Wiz project id before querying; a raw id from an older saved query, or a custom value the lookup didn't return, is passed straight through unchanged.
- Cursor pagination handled for you, walking every page Wiz returns with no client-side record limit (Cloud Resources still carries a notice when Wiz's own
graphSearchAPI reports it truncated the result). - Logs frames for detections and audit entries, a pre-aggregated time series for issue trends, and tables everywhere else.
- Seven bundled dashboards covering every query type.
- OAuth2 client-credentials authentication with the client secret encrypted at rest and never exposed to the browser.
Compatibility
| Item | Supported |
|---|---|
| Grafana | 13.1.0 and later |
| Wiz API | Wiz GraphQL API (unversioned schema) |
| Authentication | OAuth2 client credentials (Wiz service account) |
| Deployments | Wiz Commercial, Wiz for Gov (FedRAMP), Wiz Commercial on GovCloud |
Demonstration Video
Please find attached a demo video showcasing how to use the Wiz integration.
Installation
Requirements
- A Wiz tenant and permission to create a service account (Write permission on service accounts).
- Grafana 13.1.0 or later with the ability to install a backend data source plugin.
- Outbound HTTPS access from the Grafana server to your Wiz API host and token host.
Obtain Credentials
- Log in to the Wiz portal.
- Open the user icon menu and choose Tenant Info. Note your region code, for example
us1. Your API URL ishttps://api.<region>.app.wiz.io. - Go to Settings → Service Accounts and select Add Service Account. Choose the custom-integration / GraphQL API type.
- Assign read scopes covering the query types you intend to use:
read:issues,read:vulnerabilities,read:cloud_configuration,read:detections,admin:audit,read:resources,read:network_exposure,read:external_exposure,read:system_activities. - Save, then copy the Client ID and Client Secret. The secret is displayed only once.
- Pick the token host for your tenant type — the plugin appends
/oauth/tokenfor you: Wiz Commercialhttps://auth.app.wiz.io, Wiz for Govhttps://auth.app.wiz.us, Commercial on GovCloudhttps://auth.gov.wiz.io.
Install the Plugin
Install from the Grafana plugin catalog, or with the Grafana CLI:
grafana cli plugins install crestdata-wiz-datasource
On Grafana Cloud, install the plugin from the Administration → Plugins page of your stack.
Configure the Data Source
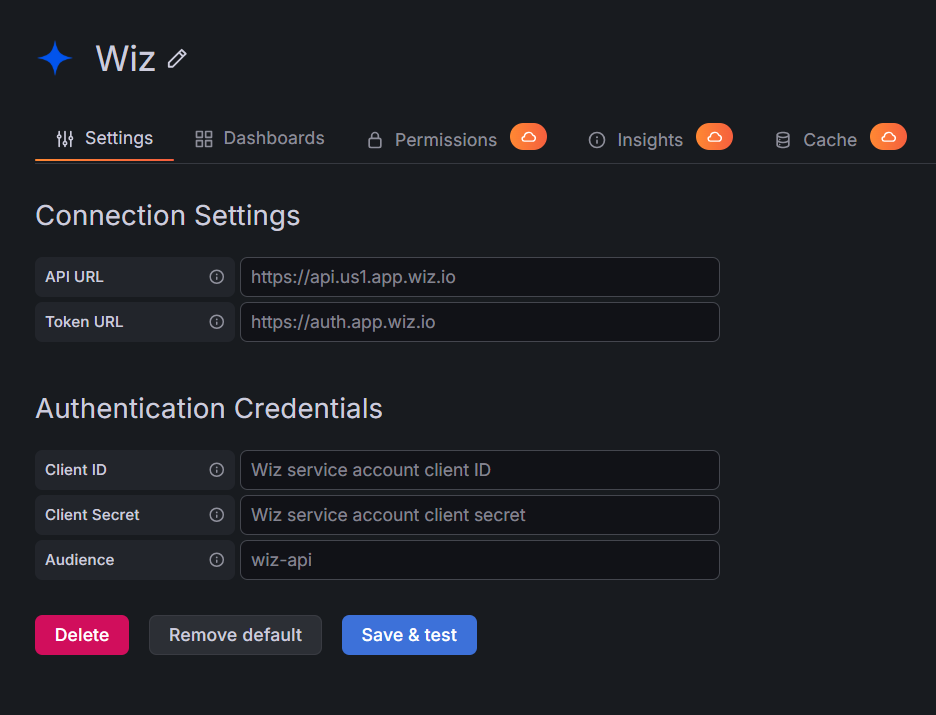
Go to Connections → Data sources → Add new data source → Wiz, fill in the fields below, then select Save & test.
| Field | Type | Required | Description |
|---|---|---|---|
| API URL | String | Yes | Your tenant's GraphQL base URL, for example https://api.us1.app.wiz.io. The plugin appends /graphql. |
| Token URL | String | Yes | The OAuth2 token host for your tenant type, for example https://auth.app.wiz.io. The plugin appends /oauth/token. |
| Client ID | String | Yes | The Wiz service account client ID. |
| Client Secret | Secret | Yes | The Wiz service account client secret. Stored encrypted. |
| Audience | String | Yes | The OAuth2 audience. Leave as wiz-api. |
Save & test issues one authenticated GraphQL request, which verifies both the credentials and the service account's read access.
Usage
Query Editor
Pick a Query Type first; the editor then shows only the filters that query type supports. Filters left at All or Any are not sent to Wiz. Pagination is handled by the plugin and is not configurable.
Available Query Types
| Query Type | Returns |
|---|---|
| Issues | The Wiz risk backlog, one row per issue, with rule, entity, project, and business-impact context. |
| Vulnerability Findings | CVE findings per asset with CVSS, EPSS, CISA KEV, exploit, and remediation fields. |
| Cloud Configuration Findings | CSPM configuration findings. Full Posture returns the current state; Changes Only returns findings updated in the time range. |
| Host Configuration Findings (OS Benchmarks) | CIS host benchmark results with framework, category, and control mapping. |
| Detections (Wiz Defend) | Threat detections as a log stream with actors, resources, rules, and triggering events. |
| Audit Log Entries | Wiz administrative and API audit entries as a log stream. |
| Network Exposures | Network exposure paths between entities, with protocols, port ranges, and path hops. |
| Cloud Resources (Security Graph) | Cloud resource inventory for one entity type, from the Wiz Security Graph. |
| External Attack Surface | Internet-facing application endpoints with pre-aggregated finding and secret counters. |
| Data Findings (DSPM) | Data security findings with classifier, cloud account, and match counts. |
| Scan Activity | Connector scans, automation actions, and analyzer runs with durations and outcomes. |
| Issues Trend | Issue counts over time, pre-aggregated by Wiz into hour, day, week, or month buckets. |
| Compliance | Rule Analytics returns per-rule pass/fail counts and a computed compliance percentage; Frameworks returns the framework catalogue. |
Query types with more than one shape use a selector: Posture Mode (Cloud Configuration Findings), Trend Series and Trend Interval (Issues Trend), and Compliance View (Compliance).
Snapshot query types ignore the panel time range and always return the current state: Cloud Resources, Data Findings, Compliance, and Cloud Configuration Findings in Full Posture mode.
Time-filtered-in-plugin query types expose an Apply Time Range switch, on by default so only records inside the panel time range are returned: Host Configuration Findings, Network Exposures, External Attack Surface, and Scan Activity. Turn it off to return every record regardless of the panel time range.
Resources Reference
| Query Type | Frame type | Time column |
|---|---|---|
| Issues | Table | updated_at |
| Vulnerability Findings | Table | last_detected_at |
| Cloud Configuration Findings | Table | analyzed_at |
| Host Configuration Findings | Table | analyzed_at |
| Detections | Logs | updated_at |
| Audit Log Entries | Logs | timestamp |
| Network Exposures | Table | first_seen_at |
| Cloud Resources | Table | none |
| External Attack Surface | Table | updated_at |
| Data Findings | Table | none |
| Scan Activity | Table | created_at |
| Issues Trend | Time series | time (bucket) |
| Compliance | Table | none |
Included Dashboards
| Dashboard | Purpose |
|---|---|
| Wiz Security Overview | Cross-domain executive rollup of issues, vulnerabilities, configuration findings, detections, trends, and inventory. |
| Wiz Issues & Risk | Issue lifecycle, severity and status distribution, business-unit and business-impact breakdowns, and due-date tracking. |
| Wiz Vulnerability Management | CVE posture: exploitability, EPSS distribution, CISA KEV exposure, affected assets, and fix availability. |
| Wiz Cloud Configuration & Compliance Posture | Configuration and host benchmark results with framework compliance percentages and remediation evidence. |
| Wiz Defend - Threat Detections | Detection volume, severity, frameworks, actors, triggering events, and the raw detection log. |
| Wiz Audit & Platform Activity | Administrative audit trail plus connector, scan, and automation activity health. |
| Wiz Exposure & Attack Surface | Network exposure paths, internet-facing endpoints, cloud inventory, and data security findings. |
Support
For issues, questions, or feature requests, please reach out to grafanalabs.integrations@crestdata.ai
Authors and Acknowledgment
Developed by Crest Data.
License
This plugin is distributed under EULA License. See the LICENSE file for details.
References
- Wiz API documentation: https://docs.wiz.io/docs/using-the-wiz-api
- Grafana data source plugin documentation: https://grafana.com/developers/plugin-tools/
Grafana Cloud
Connect any plugin in Grafana Cloud.
- 150+ data source integrations
- Grafana Assistant - AI that correlates your data, builds queries, and answers questions
- 10k Prometheus metrics + 50 GB logs, traces, and profiles on the free tier
- ...and more
Insights
- Activity
Last updated 15 Oct 2026.
0 releases in the past year.
- Queries
0 total queries served across all Grafana Cloud instances.
- Version
- 1.0.3
- Dependencies
- Grafana >=13.1.0
- Developer
- crestdata
Grafana Cloud
Connect any plugin in Grafana Cloud.
- 150+ data source integrations
- Grafana Assistant - AI that correlates your data, builds queries, and answers questions
- 10k Prometheus metrics + 50 GB logs, traces, and profiles on the free tier
- ...and more