
VMware vSphere Data Source for Grafana
The VMware vSphere data source plugin lets you query and visualize inventory, performance, events, alarms, and vSAN metrics from VMware vSphere (vCenter Server) directly in Grafana. It is a backend plugin that connects to the vCenter SOAP/vim25 API using the official govmomi SDK.
Description
Monitor your entire vSphere estate from Grafana: virtual machines, ESXi hosts, datastores, clusters, infrastructure-wide utilization, the vCenter event log, triggered alarms, and vSAN cluster/host performance and capacity — all read-only, all server-side.
Features
- Nine query types: Virtual Machines, ESXi Hosts, Datastores, Clusters, Infrastructure, Events, Alarms, vSAN Cluster, vSAN Host.
- Separate Data View and Performance Metric selectors per query type — point-in-time inventory/status/capacity/health data is chosen independently from time-series performance counters, so the two are never mixed in one list.
- Cluster scoping for VMs, Hosts, Infrastructure, and vSAN queries via a dynamically populated cluster dropdown.
- Entity name filtering for VM, ESXi Host, Cluster, Infrastructure, and vSAN Host performance metrics — scope a panel to a single VM/host/cluster by exact name instead of graphing every entity.
- Performance time series wired to the Grafana time picker, with correct vSphere counter unit scaling (CPU/memory in hundredths-of-percent → %).
- Events as Grafana logs, categorized by type (power, vMotion, configuration change, snapshot, alarm history, user activity).
- vSAN performance, capacity, dedup, and health via the vSAN performance/space/health managers.
- Curated dashboards bundled with the plugin.
- Secure by design: password stored encrypted in
secureJsonData; only generic error messages surfaced to the UI.
Compatibility
| Component | Supported |
|---|---|
| Grafana | >= 12.0.0 |
| vCenter / vSphere API | vim25 (auto-negotiated by govmomi) |
| Authentication | Username + password session login (managed by govmomi) |
Installation
Requirements
- A reachable vCenter Server appliance (
https://<host>/sdkroutable from the Grafana backend). - A vCenter account with the Read-only role propagated to children. For vSAN dashboards, read access to the cluster's vSAN performance and health services is also required.
- The vSphere Performance/Statistics service collecting data; vSAN dashboards require the vSAN Performance Service enabled on the cluster.
Obtain Credentials
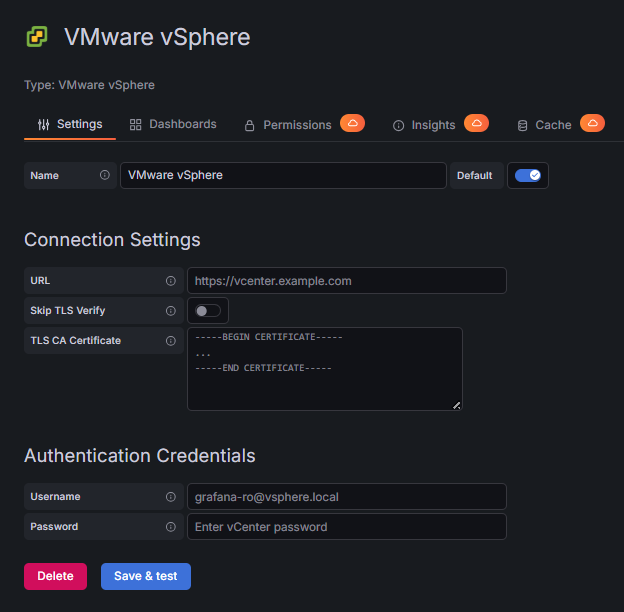
- Log in to the vSphere Client (
https://<vcenter-host>/ui) as an administrator. - Go to Administration → Single Sign On → Users and Groups and create a service account (e.g.
grafana-ro@vsphere.local). - Go to Administration → Access Control → Global Permissions, add the account with the Read-only role propagated to children.
- Note the vCenter hostname/IP for the URL field.
- If the appliance uses a self-signed certificate, enable Skip TLS Verify or paste the CA certificate (PEM) into TLS CA Certificate.
Configure the Data Source
| Field | Type | Required | Description |
|---|---|---|---|
| URL | string | Yes | vCenter base URL (e.g. https://vcenter.example.com). The plugin connects to https://<host>/sdk. |
| Username | string | Yes | vCenter login (e.g. grafana-ro@vsphere.local). |
| Password | secure string | Yes | vCenter password; stored encrypted server-side. |
| Skip TLS Verify | boolean | No | Skip certificate verification. Use only for on-prem vCenters with self-signed certs on trusted networks. |
| TLS CA Certificate | string (PEM) | No | CA certificate to trust the vCenter's self-signed/internal CA instead of skipping verification. Stored in plain jsonData (not encrypted) — it is a certificate, not a secret. |
Click Save & Test to verify connectivity. The plugin connects to vCenter and confirms a live session; errors are surfaced immediately in the Grafana UI.
Visual
Configuration Editor
Query Editor
Usage
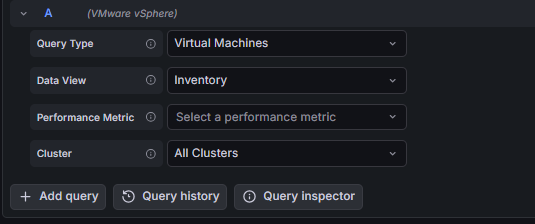
Query Editor
All fields adapt dynamically to the selected Query Type. There is no power-state/connection-state/maintenance-mode filter, datastore-type filter, or event/alarm severity/acknowledgement filter; those dimensions are exposed as dashboard columns/panels instead, not as query-editor inputs. Per-entity name filtering (VM/Host/Cluster) is available for performance metrics — see Entity Name below.
Data View and Performance Metric are independent, mutually exclusive selectors — picking a value in one clears the other, since both feed the same underlying value. Each is only shown when the current Query Type actually has options of that kind.
| Field | Shown when | Description |
|---|---|---|
| Query Type | Always | Selects the vSphere resource or activity to query. Changing it resets the selection to that type's default and clears the Cluster selection. |
| Data View | Query types with a point-in-time table/status/capacity/health option: VM, ESXi Host, Cluster, Events, vSAN Cluster (Datastore and Alarm have only one trivial option each, so the field is hidden for them) | Inventory tables, cluster health/HA/DRS/capacity, event categories, or vSAN capacity/health — not time-series. |
| Performance Metric | Query types with a time-series option: VM, ESXi Host, Cluster, Infrastructure, vSAN Cluster, vSAN Host | CPU/memory/disk/network/vSAN performance counters, wired to the panel time range. |
| Entity Name | A Performance Metric is selected for VM, ESXi Host, Cluster, Infrastructure, or vSAN Host | Scope the panel to a single entity by exact name (case-insensitive) — VM name, host name, or cluster name depending on Query Type. Filtering happens server-side against vCenter (or, for vSAN Host, by narrowing which hosts are queried before the vSAN Performance Service call is made) rather than discarding unwanted series after the fact. Leave empty to include every entity. Not shown for vSAN Cluster, whose Cluster field already selects the single entity queried. |
| Cluster | VM, ESXi Host, Infrastructure, vSAN Cluster, vSAN Host | Scope results to a specific cluster. Populated from a live dropdown (CallResource GET /clusters). Not shown for Datastore, Cluster, Event, or Alarm query types. |
Performance Metric selections always honor the panel time range. Most Data View selections are point-in-time snapshots (time range ignored) — the one exception is Events, which does use the panel time range to scope the event log even though it's a Data View option. Alarms are always point-in-time. Note: the Cluster query type's own CPU/Memory Usage perf metrics have no Cluster dropdown (there's no "parent cluster" to scope by) — use the Entity Name field instead to scope to one cluster by name.
Query Types, Data Views, and Performance Metrics
Virtual Machines (vm)
Data View
| Value | Description |
|---|---|
inventory |
VM table: name, power state, guest OS, IP address |
Performance Metric (all time-series, wired to the panel time range)
| Value | Description |
|---|---|
cpu_usage |
CPU usage % time series |
cpu_ready |
CPU ready time series |
memory_usage |
Memory usage % time series |
memory_balloon |
Memory balloon time series |
memory_swap |
Memory swap time series |
disk_iops |
Disk IOPS time series |
disk_throughput |
Disk throughput time series |
disk_latency |
Disk latency time series |
network_io |
Network IO time series |
network_bandwidth |
Network bandwidth time series |
network_drops |
Network dropped packets time series |
network_errors |
Network errors time series |
ESXi Hosts (host)
Data View
| Value | Description |
|---|---|
inventory |
Host table: name, connection state, maintenance mode, CPU cores, memory |
Performance Metric
| Value | Description |
|---|---|
cpu_usage |
CPU usage % time series |
memory_usage |
Memory usage % time series |
Datastores (datastore)
Data View (only option; the selector is hidden since there's nothing to choose)
| Value | Description |
|---|---|
inventory |
Datastore table: name, type, capacity, free space, usage % |
Clusters (cluster)
Data View
| Value | Description |
|---|---|
overall_health |
Per-cluster overall health status (green/yellow/red/gray) |
ha_status |
HA enabled/disabled per cluster |
drs_status |
DRS enabled/disabled per cluster |
drs_score |
DRS score per cluster |
cpu_capacity |
Total CPU capacity per cluster |
memory_capacity |
Total memory capacity per cluster |
Performance Metric
| Value | Description |
|---|---|
cpu_usage |
CPU usage % time series |
memory_usage |
Memory usage % time series |
Infrastructure (infrastructure)
Performance Metric (only category; always time-series)
| Value | Description |
|---|---|
avg_cpu_usage |
Average CPU usage % across all hosts |
avg_memory_usage |
Average memory usage % across all hosts |
cpu_heatmap |
Per-host CPU usage heatmap |
memory_heatmap |
Per-host memory usage heatmap |
Events (event)
Data View (only category; still honors the panel time range to scope the event log)
| Value | Event types captured |
|---|---|
recent |
All events |
vm_power |
VmPoweredOnEvent, VmPoweredOffEvent |
vmotion |
VmMigratedEvent, DrsVmMigratedEvent |
config_change |
VmReconfiguredEvent, HostConfigChangedEvent |
snapshot |
VmSnapshotCreatedEvent, VmSnapshotRemovedEvent, VmSnapshotRevertedEvent |
alarm_history |
AlarmStatusChangedEvent |
user_activity |
UserLoginSessionEvent, UserLogoutSessionEvent |
Events are returned as Grafana Logs frames (time, message, type, user, event ID).
Alarms (alarm)
Data View (only option; the selector is hidden since there's nothing to choose)
| Value | Description |
|---|---|
alarms |
Active triggered alarms table: severity, entity, alarm name, time, acknowledged |
Returns every currently active triggered alarm; filter by severity/entity type/acknowledgement using Grafana panel transformations or dashboard variables (see the bundled Events dashboard for an example).
vSAN Cluster (vsan_cluster)
Data View
| Value | Description |
|---|---|
capacity_total |
Total raw capacity (bytes) |
capacity_free |
Free capacity (bytes) |
dedup_ratio |
Dedup + compression ratio |
dedup_savings |
Space saved by dedup + compression (bytes) |
health_overall |
Cluster overall health (green/yellow/red) |
health_collection |
Data collection health status |
health_missing_stats |
Count of hosts missing stats |
Performance Metric
| Value | Description |
|---|---|
iops |
Combined read + write IOPS time series |
throughput |
Combined read + write throughput time series |
latency |
Combined read + write latency time series |
congestion |
Congestion time series |
outstanding_io |
Outstanding IO time series |
vSAN Host (vsan_host)
Performance Metric (only category; always time-series)
| Value | Description |
|---|---|
iops |
Per-host read + write IOPS time series |
throughput |
Per-host read + write throughput time series |
latency |
Per-host read + write latency time series |
congestion |
Per-host congestion time series |
outstanding_io |
Per-host outstanding IO time series |
cache_hit_rate |
Per-host read cache hit rate |
Included Dashboards
Five dashboards are bundled under src/dashboards/ and provisioned with the plugin:
| Dashboard | UID | Description | Variables |
|---|---|---|---|
| VMware Infrastructure & Cluster Health | vmware-infra-health |
Environment-wide KPIs, cluster health/HA/DRS status, and average utilization across hosts. | cluster_name (also used as the Entity Name filter on the two Cluster performance panels), host_name (Entity Name filter on the per-host Infrastructure panels) |
| VMware VM Performance — CPU, Memory & Network | vmware-compute |
VM CPU/memory time series, ready time, balloon/swap, and network I/O. | cluster_name, vm_name (Entity Name filter on all VM panels), host_name (Entity Name filter on both Host panels) |
| VMware Storage & Capacity | vmware-storage-capacity |
Datastore inventory/capacity and per-VM disk IOPS/throughput/latency. | cluster_name, vm_name (Entity Name filter on the VM disk panels) |
| VMware Events, Alarms & Audit Trail | vmware-events |
Event logs by category and active alarm tables, with dashboard variables for alarm severity/acknowledgement/entity type. | — |
| VMware vSAN Performance | vmware-vsan |
vSAN cluster and host capacity, performance metrics, dedup ratios, and health summaries. | cluster_name, host_name (Entity Name filter on all vSAN Host panels) |
All name-filter variables (vm_name, host_name) are plain text-box variables — type an exact name and leave empty to include every entity — since VM/host names aren't enumerable the way clusters are.
Architecture
Frontend (React/TypeScript)          Backend (Go / govmomi)
────────────────────────────         ──────────────────────────────────────
ConfigEditor.tsx                     datasource.go    — NewDatasource (eager
QueryEditor.tsx                                          vCenter login), QueryData,
datasource.ts  (getClusters)                           CheckHealth, CallResource
types.ts                             client.go        — VSphereDataProvider interface
                                                        + VSphereClient (govmomi)
                                     handlers.go      — per-query-type routing
                                     dataframe.go     — model → Grafana frame builders
                                     utils.go         — scaling, parsing, field helpers
                                     errors.go        — error classification
                                     models/          — PluginSettings, query consts,
                                                        vSphere/vSAN info types
Key design decisions:
- Eager initialization: vCenter session is opened in
NewDatasource(not lazily on first query), so connection errors surface immediately in Grafana's datasource settings UI. VSphereDataProviderinterface: decouples query handlers from the concrete govmomi client, enabling hermetic unit tests via a mock implementation.- No client factory indirection:
NewClientis called directly; no factory type or mutex is involved.
Limitations and Recommendations
- Time ranges: vSphere real-time performance covers roughly the last hour; older windows use historical rollups (5 min / 30 min / 2 h / 1 day) selected automatically from the panel range width.
- Snapshot metrics (inventory, cluster health/status, alarms, vSAN space/health) ignore the time range; they always return the current state.
- No row caps: full result sets are returned. Large environments with wide event windows produce large frames — narrow the time range.
- vSAN: queries require the vSAN Performance Service enabled on the cluster; a clear error message is returned otherwise.
- Rate limiting: vCenter publishes no request quota; throughput is bounded by server load. Use an auto-refresh interval of ≥ 30 s for heavy dashboards.
- Self-signed certificates: enable Skip TLS Verify only on trusted networks; prefer providing the CA certificate for a stronger trust model.
Support
For issues and questions, contact Crest Data.
Contributing
The frontend is React/TypeScript (src/), the backend is Go using the govmomi SDK (pkg/).
- Backend tests:
go test ./pkg/...— uses the govmomi simulator for hermetic unit tests. - Frontend e2e tests:
npm run e2e— uses@grafana/plugin-e2e(Playwright) intests/. - Frontend build:
npm run build(webpack via.config/). - Local Grafana:
npm run server.
Authors and Acknowledgment
Built by Crest Data. Powered by the govmomi vSphere SDK.
License
This plugin is distributed under the Crest Data EULA. See the LICENSE file.
References
Grafana Cloud
Connect any plugin in Grafana Cloud.
- 150+ data source integrations
- Grafana Assistant - AI that correlates your data, builds queries, and answers questions
- 10k Prometheus metrics + 50 GB logs, traces, and profiles on the free tier
- ...and more
Insights
- Adoption
Running on 6 active Grafana instances.
- Activity
Last updated 6 Aug 2026.
1 release in the past year.
- Queries
0 total queries served across all Grafana Cloud instances.
- Version
- 1.0.3
- Dependencies
- Grafana >=12.0.0
- Developer
- crestdata
Grafana Cloud
Connect any plugin in Grafana Cloud.
- 150+ data source integrations
- Grafana Assistant - AI that correlates your data, builds queries, and answers questions
- 10k Prometheus metrics + 50 GB logs, traces, and profiles on the free tier
- ...and more