
Tanium Data Source for Grafana
The Tanium data source plugin lets you query and visualize endpoint inventory, vulnerability and compliance findings, unmanaged devices, discover labels, action oversight, endpoint security-agent health, File Integrity Monitoring (FIM) coverage, patch catalog, and software asset data from Tanium directly in Grafana. It is a backend plugin that connects to the Tanium API Gateway GraphQL endpoint.
Description
Monitor your Tanium-managed fleet from Grafana: fleet inventory, CVE and compliance findings, the Discover attack-surface feed and its label/tag inventory, cross-module action/deployment oversight, Windows Defender/SCCM agent health, FIM deployment coverage, the patch catalog, and software asset usage — all read-only, all server-side.
Features
- Ten query types: Endpoint Inventory, Vulnerability Findings, Compliance Findings, Unmanaged Devices, Discover Labels, Action & Deployment Oversight, Endpoint Security Agent Health, FIM Coverage, Patch Definitions, Software Asset Inventory.
- Data View selectors for the two multi-view resources (FIM Monitors/Watchlists, Asset Products/Product Endpoints) so a single query type can surface more than one shape of data.
- Server-side filtering wherever the Tanium API Gateway supports it (severity, compliance state, managed/unmanaged flags, action source/status, and the dashboard time range — see the Use Time Filter table below), with a client-side post-filter fallback only for the one resource whose connection accepts no filter at all.
- Exhaustive pagination: every page of every Relay connection is fetched — no row caps.
- Curated dashboards bundled with the plugin.
- Secure by design: the API Token is stored encrypted in
secureJsonData; only generic error messages are surfaced to the UI.
Compatibility
| Component | Supported |
|---|---|
| Grafana | >= 12.3.0 |
| Tanium API | API Gateway (GraphQL), Tanium Cloud and on-prem Tanium Server |
| Authentication | Tanium API Token, sent as the session request header |
Demonstration Video
Please find attached a demo video showcasing how to use the Tanium integration.
Installation
Requirements
- A Tanium Cloud tenant, or an on-prem Tanium Server with the API Gateway plugin installed and licensed, reachable from the Grafana backend.
- A Tanium Console user with the API Tokens administration permission.
- The Tanium solution license(s) covering the query types you plan to use (e.g. Comply for vulnerability/compliance findings, Patch for the patch catalog, Discover for unmanaged devices, Integrity Monitor for FIM, Asset for software inventory). Querying a query type without the matching license fails the query rather than returning empty data - the panel shows a generic "query failed" message, and the specific cause (including which solution is missing) is written to the Grafana server log only.
Obtain Credentials
- Log in to the Tanium Console (Cloud:
https://<customername>.cloud.tanium.com; on-prem: your console URL). - Navigate to Administration > API Tokens (some console versions nest this under Administration > Permissions > API Tokens).
- Click New API Token.
- Optionally add Notes describing the token's purpose, and set Expire in days (defaults to 7 days if left blank; can be set up to 365 days). Optionally restrict Trusted IP addresses to the Grafana backend's egress IP(s).
- Click Save. The token value is shown once, in a popup, for a 5-minute window — copy it immediately.
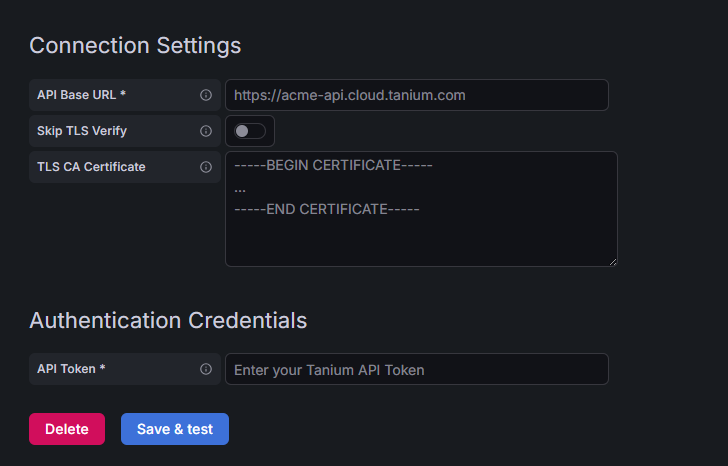
- Paste the token into the plugin's API Token field and the tenant's API Gateway URL into the API Base URL field, then Save & Test.
The plugin cannot refresh this token automatically — rotate it in the console before it expires, and update the datasource configuration with the new value.
Configure the Data Source
| Field | Type | Required | Description |
|---|---|---|---|
| API Base URL | string | Yes | URL of the Tanium API Gateway — the API endpoint, not the web console. On Tanium Cloud this is the console host with an -api suffix, e.g. https://acme-api.cloud.tanium.com; for an on-prem Gateway use its host (http:// is accepted for Gateways not fronted by TLS). Pointing this at the console makes the connection test fail with a page instead of API data. The scheme defaults to https:// and /plugin/products/gateway/graphql is appended automatically, so a full URL from the Tanium docs also works. |
| API Token | secure string | Yes | Tanium API Token from Administration > API Tokens; stored encrypted server-side; sent as the session header. |
| Skip TLS Verification | boolean | No | Enable only for on-prem/self-hosted Tanium Servers presenting a self-signed or internal-CA certificate (e.g. lab/staging). Leave disabled for Tanium Cloud. |
Click Save & Test to verify connectivity. The health check runs a minimal query { now } request that requires valid authentication but no solution license.
Usage
Query Editor
Every query starts with Query Type. Resources with more than one shape of data additionally show a Data View selector. Remaining fields are conditional filters specific to the selected query type — see the table below.
| Field | Shown when | Description |
|---|---|---|
| Query Type | Always | Selects the Tanium resource to query. |
| Data View | FIM Coverage, Asset Inventory | Chooses which of that resource's underlying views to query. |
| Use Time Filter | Endpoint Inventory, Vulnerability Findings, Compliance Findings, Unmanaged Devices, Discover Labels, Security Agent Health, Patch Definitions, Asset Inventory (Product Endpoints view) | When enabled, the backend bounds the query to the dashboard time range. When disabled (default), every record is returned regardless of the dashboard time range. |
The time bound is pushed server-side into the Gateway filter wherever the schema allows it — the Gateway does the filtering, not the plugin:
| Query Type | Time field | Where |
|---|---|---|
| Endpoint Inventory / Security Agent Health | eidLastSeen |
endpoints connection filter (RFC3339 GTE/LTE) |
| Vulnerability Findings | lastFound |
nested cveFindings filter (Date, YYYY-MM-DD) |
| Compliance Findings | lastScanDate |
nested complianceFindings filter (Date) |
| Unmanaged Devices | lastSeenTime |
discoverInterfaces connection filter (RFC3339) |
| Discover Labels | modifiedTime |
discoverLabels connection filter (RFC3339) |
| Patch Definitions | releaseDate |
typed PatchDefinitionFieldFilter (Date) |
| Action & Deployment Oversight | startedAfterTime / startedBeforeTime |
typed ActionOversightQueryFilter — always on, no toggle |
Asset Inventory (Product Endpoints view) is the only query type still post-filtered client-side, on updatedAt: its assetProductEndpoints connection accepts no filter argument at all.
Available Query Types
Endpoint Inventory (endpointInventory)
Fleet hardware/OS/network inventory. Filters: Operating System Platform, Name Contains, Manufacturer Contains, Chassis Type.
Vulnerability Findings (vulnerabilityFindings)
CVE/CVSS/EPSS/CISA-KEV findings per endpoint. Filters: Severity (CVSS v3 severity band, severity_v3), Minimum CVSS Score (CVSS v3 base score, cvss_score_v3), CISA KEV Only, Exclude Excepted, CVE ID Contains, Operating System Platform, Endpoint Name Contains.
Compliance Findings (complianceFindings)
CIS/STIG-style benchmark compliance state per endpoint. Filters: State, Standard Contains, Rule ID Contains, Operating System Platform.
Unmanaged Devices (unmanagedDevices)
Discover's rogue/unmanaged device feed. Filters: Is Managed, Is Unmanageable, Is Ignored, Operating System Platform, Hostname/IP Contains.
Discover Labels (discoverLabels)
Discover tag inventory with managed/unmanaged counts. Filters: Label Type, Name Contains.
Action & Deployment Oversight (actionOversight)
Cross-module (Deploy/Patch/Guardian/Platform Action/Playbook Run) action status feed, always scoped to the dashboard time range. Filters: Source Module, Status, Initiator Classification. Always set Source Module - the Platform Action source is an extremely high-volume internal action stream on most tenants (roughly 1/second, unrelated to actual deployments); leaving Source Module empty paginates through that entire stream with no row cap and can make the query take a very long time. Like Patch Definitions, this connection's pagination cursor (sorted on date/issueTime, not unique) can re-serve rows across a page boundary; the plugin de-duplicates by ID after paging completes.
Endpoint Security Agent Health (securityAgentHealth)
Windows Defender / SCCM client health per endpoint. Filters: Operating System Platform, Name Contains, Defender Unhealthy Only, AV Signature Age > Days.
FIM Coverage (fimCoverage)
Two Data Views: Monitors and Watchlists (deployed File Integrity Monitor definitions). No filters - confirmed via schema introspection that neither integrityMonitorMonitors nor integrityMonitorWatchlists accepts a filter argument at all, only pagination. An unrecognized Data View value (e.g. a malformed dashboard JSON target) is rejected with an error rather than silently substituting Monitors.
Patch Definitions (patchDefinitions)
CVE-linked patch/vulnerability catalog. Filters: Severity, Platform, Classification, Has CVE, Is Superseded, Product. Has CVE splits patches with a real CVE ID from those whose cveIds is the sentinel value "None" - confirmed working server-side. There is no CVE ID text filter - the Gateway's own cveIds filter argument is broken and returns zero results for any value regardless of shape or case, confirmed against a live tenant, and a client-side workaround was removed because it required fetching the full, unfiltered catalog on every query. The Gateway's own pagination cursor for this catalog is also unstable on every sort field except title/desc (the one used here), and even that one can still re-serve a handful of rows across a page boundary on a full-catalog fetch - the plugin de-duplicates by ID after paging completes so this is transparent to panels.
Software Asset Inventory (assetInventory)
Two Data Views: Products (software titles with install/usage counts — filters: Vendors, Name or Vendor Match, Tracking State) and Product Endpoints (per-endpoint software assignments — no filters; confirmed against a live tenant that vendor/version/usage are not present on this table and product-name matching returns zero results). Name or Vendor Match is a combined substring search on the Gateway's own search filter field - it matches product name or vendor name, so e.g. "Microsoft" also returns products like Internet Explorer whose vendor is Microsoft, not just products named "Microsoft ...". Use Vendors for an exact match against one or more specific vendor names instead. As with FIM Coverage, an unrecognized Data View value is rejected with an error rather than silently substituting Products. Tracking State offers Tracked and Cataloged only - both filter correctly on the Gateway.
Included Dashboards
Three dashboards are bundled under src/dashboards/ and provisioned with the plugin:
| Dashboard | UID | Description | Variables |
|---|---|---|---|
| Tanium Security | tanium-security |
Vulnerability and compliance findings, the Discover attack surface, endpoint security-agent health, FIM coverage, and the patch catalog. | severity, standard, use_time_filter |
| Tanium Fleet Operations | tanium-operations |
Fleet hardware/OS inventory and software asset/license inventory. | (none beyond the datasource picker) |
| Tanium Action & Deployment Oversight | tanium-action-oversight |
Cross-module action/deployment status, including the high-volume Platform Action stream by default - the overview panels can be slow to load as a result. Defaults to the last 5 minutes, unlike the other dashboards' 24-hour default, to keep that volume manageable on load. Split into its own dashboard because that data volume made it slow to load alongside fleet inventory and asset panels. | action_source (multi-select, defaults to All; drives every panel on the dashboard, not just the detail table) |
Each dashboard groups its panels under row headers (starting with an "Overview" KPI row) for clear subcategories, rather than a flat panel list.
Limitations and Recommendations
- Time ranges: every time-filterable query type except Asset Inventory (Product Endpoints) bounds the dashboard time range server-side in the Gateway filter (see the Use Time Filter table above for the field used per query type). Action & Deployment Oversight is always time-bound; the rest apply the bound only when Use Time Filter is enabled. Snapshot resources (FIM Coverage, Discover Labels without the toggle, Asset Products) ignore the time range.
- No row caps: every page of every Relay connection is fetched to completion. Very large environments with broad filters can return large result sets — narrow your filters or disable Use Time Filter's implicit "return everything" behavior by scoping filters instead.
- Action & Deployment Oversight: mind Source Module: on most tenants, the
PLATFORM_ACTIONsource is an extremely high-volume internal action stream (observed: on the order of 1 record/second, continuously, unrelated to actual Deploy/Patch/Guardian/Playbook Run activity). Combined with the no-row-caps policy above, querying it makes the query paginate through this stream in full and can take a very long time even for a short dashboard time range. Scope Source Module to just the modules you need (e.g. Deploy, Patch, Guardian, Playbook Run) if you don't need Platform Action visibility. The bundled Tanium Action & Deployment Oversight dashboard includes Platform Action by default and defaults to a 5-minute time range specifically to keep that volume manageable - widen the time range with care. - Module license gating: Vulnerability/Compliance Findings require Comply; Patch Definitions requires Patch; Unmanaged Devices/Discover Labels requires Discover; FIM Coverage requires Integrity Monitor; Software Asset Inventory requires Asset. A tenant without the corresponding license fails the query with a generic error in the panel; the Gateway's specific cause (including which solution is missing) is written to the Grafana server log only, never surfaced to the UI.
- No documented rate limit: Tanium does not publish a request-rate ceiling for the API Gateway. Use an auto-refresh interval of ≥ 30 s for dashboards with many panels.
- Enum-backed filters (action source/status, initiator classification, patch platform, tracking state, discover label type) are pickers whose option values are confirmed directly against a live tenant's GraphQL schema via
__typeintrospection, not guessed from field names. - Manual token rotation: the API Token has no refresh mechanism. Rotate it in the Tanium Console before it expires and update the datasource configuration.
Support
For issues, questions, or feature requests, please reach out to grafanalabs.integrations@crestdata.ai
Authors and Acknowledgment
Built by Crest Data.
License
See LICENSE file.
References
Grafana Cloud
Connect any plugin in Grafana Cloud.
- 150+ data source integrations
- Grafana Assistant - AI that correlates your data, builds queries, and answers questions
- 10k Prometheus metrics + 50 GB logs, traces, and profiles on the free tier
- ...and more
Insights
- Adoption
Running on 6 active Grafana instances.
- Activity
Last updated 24 Sep 2026.
2 releases in the past year.
- Queries
0 total queries served across all Grafana Cloud instances.
- Version
- 1.0.1
- Dependencies
- Grafana >=12.3.0
- Developer
- crestdata
Grafana Cloud
Connect any plugin in Grafana Cloud.
- 150+ data source integrations
- Grafana Assistant - AI that correlates your data, builds queries, and answers questions
- 10k Prometheus metrics + 50 GB logs, traces, and profiles on the free tier
- ...and more