
SharePoint Data Source Plugin for Grafana
Description
The SharePoint Data Source Plugin is a Grafana backend datasource plugin that enables security, compliance, and operational monitoring for Microsoft SharePoint Online and OneDrive for Business directly in Grafana panels.
The plugin connects to the Microsoft Graph API and the Office 365 Management Activity API using OAuth2 client credentials (app-only authentication) to retrieve security alerts, audit events, DLP violations, storage/usage reports, service health status, and tenant configuration.
Features
- Query and visualize SharePoint Online / OneDrive security, compliance, and operational data directly within Grafana
- Support for multiple data categories:
- Security Monitoring: Microsoft Defender security alerts, DLP policy violations, SharePoint audit events
- Compliance: Tenant configuration drift detection, tenant settings snapshot, file permissions audit
- Operations: Site storage quota monitoring, site delta tracking, user activity and site usage reports
- Service Health: Real-time Microsoft 365 service health overviews and incident history
- CSV report downloads (user activity, site usage) parsed and surfaced as data frames
- Built-in retry logic with exponential backoff for transient failures and rate limiting
- Automatic OAuth2 token caching and refresh
- Dedicated or shared Activity API throttle quota via an optional Publisher Identifier
Compatibility
| Component | Version / Detail |
|---|---|
| Grafana | >= 12.3.0 |
| Microsoft Graph API | v1.0 |
| Office 365 Management Activity API | v1.0 |
| Authentication | OAuth2 Client Credentials (app-only) |
Demonstration Video
Please find attached a demo video showcasing how to use the Sharepoint integration.
Installation
Requirements
- Grafana >= 12.3.0
- A Microsoft 365 tenant with SharePoint Online / OneDrive for Business
- Microsoft Entra ID (Azure AD) app registration with the required API permissions
- Unified Audit Logging enabled in the Microsoft 365 tenant
Obtain Entra ID Credentials
- Sign in to the Azure Portal.
- Go to Microsoft Entra ID > App registrations > New registration.
- Register an app and copy the Application (Client) ID and Directory (Tenant) ID.
- Go to Certificates & secrets > New client secret and copy the secret Value.
- Under API permissions, grant the application permissions listed below and click Grant admin consent.
Install the Plugin
Install the plugin from the Grafana Plugin Catalog or using the Grafana CLI:
grafana-cli plugins install crestdata-sharepoint-datasource
After installation, restart the Grafana server for the plugin to be loaded.
Configure the Data Source
- In Grafana, navigate to Connections > Data Sources > Add data source.
- Search for SharePoint and select it.
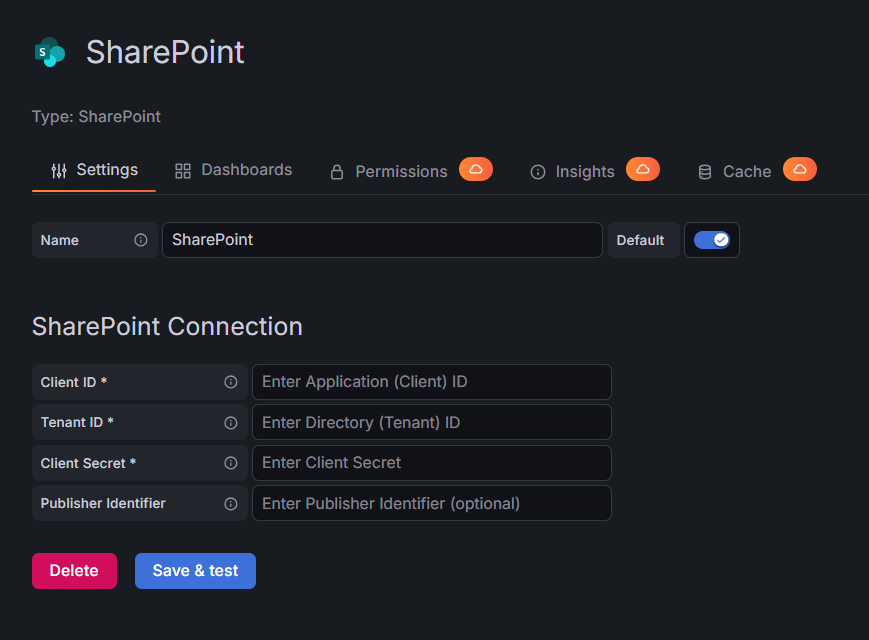
- Fill in the required configuration fields:
| Name | Type | Required | Description |
|---|---|---|---|
| Client ID | String | Yes | Application (Client) ID from Entra ID |
| Tenant ID | String | Yes | Directory (Tenant) ID GUID |
| Client Secret | Secure String | Yes | OAuth2 Client Secret value |
| Publisher Identifier | String | No | Your own tenant GUID for a dedicated Activity API quota. Leave blank for shared quota. |
- Click Save & Test. The health check will validate your credentials against the Microsoft Graph API.
Required API Permissions
Grant the following Application permissions (client credentials flow) to the app registration, then click Grant admin consent.
Microsoft Graph API — https://graph.microsoft.com/v1.0
| Permission | Type | Required For |
|---|---|---|
Reports.Read.All |
Application | Usage & activity reports (site usage, activity trends, tenant active users) |
ServiceHealth.Read.All |
Application | Service health overview, issue history |
ServiceMessage.Read.All |
Application | Service message center |
ReportSettings.Read.All |
Application | Tenant report settings (PII anonymization detection) |
SharePointTenantSettings.Read.All |
Application | Tenant SharePoint admin settings |
Sites.Read.All |
Application | Site/list discovery, site delta, list lists, get list |
Files.Read.All |
Application | Activity insights, file discovery, storage quota, get file, file permissions, file versions, item analytics |
SecurityAlert.Read.All |
Application | Security alerts (Defender for Cloud Apps) |
Office 365 Management Activity API — https://manage.office.com/api/v1.0
| Permission | Type | Required For |
|---|---|---|
ActivityFeed.Read |
Application | Audit events (SharePoint activity stream) |
ActivityFeed.ReadDlp |
Application | DLP events (Data Loss Prevention violations) |
Delegated permissions are not recommended for this plugin — they require an interactive user login (plus Entra admin roles such as Global Reader/Reports Reader for the Reports family), which doesn't fit an automated, service-to-service datasource.
Usage
Query Editor
Once the data source is configured, you can create panels using the query editor. The two-step Query Type picker selects a category then a specific report; the remaining fields shown depend on which query type is selected:
| Parameter | Type | Options | Description |
|---|---|---|---|
| Query Type | Dropdown (2-step) | See Supported Query Types | Select the data category, then the specific query |
| Period | Dropdown | D7, D30, D90, D180 | Reporting period (period-based CSV report query types) |
| Site ID / Drive ID / Item ID / List ID | String | — | Resource identifiers for discovery/content/analytics query types; use the Discovery queries to look these up |
| Site Search Query | String | — | Search text to find the target SharePoint site (file_permissions, list_sites) |
| File/Folder Search | String | — | Search text to find the target file/folder in a drive (file_permissions, drive_search) |
| Analytics Target | Dropdown | Site, Drive Item, List Item | Which ID combination applies to activity_interval/item_site_analytics |
| Interval | Dropdown | Day, Week, Month | Aggregation interval for activity_interval |
| Analytics Window | Dropdown | All Time, Last 7 Days | One-shot totals window for item_site_analytics |
| Severity Filter | Dropdown | High, Medium, Low, Informational, Unknown | Filter security alerts by severity (security_alerts) |
| Status Filter | Dropdown | New, In Progress, Resolved | Filter security alerts by status (security_alerts) |
| Subscriptions | Buttons | Start/Stop per content type | Manage Management Activity API subscriptions feeding audit_sharepoint/dlp_violations |
Supported Query Types
Frequently used reports:
| Query Type | Description | Time Range |
|---|---|---|
site_usage_report |
Per-site SharePoint usage (CSV report) | Ignored (period-based) |
user_activity_report |
Per-user SharePoint activity (CSV report) | Ignored (period-based) |
file_permissions |
File and folder permission audit | Ignored (current ACL state) |
site_storage_quota |
Site storage usage and capacity | Ignored (snapshot) |
site_delta |
Site creations and deletions via the Graph Delta API | Ignored (delta mechanism) |
security_alerts |
Microsoft Defender for Cloud Apps security alerts | Client-side filter |
tenant_sharepoint_settings |
Tenant-level SharePoint configuration snapshot | Ignored (snapshot) |
Discovery (resolve siteId/driveId/itemId for the queries above):
| Query Type | Description | Time Range |
|---|---|---|
list_sites |
Enumerate/search SharePoint sites | Ignored (current state) |
list_site_drives |
List a site's drives | Ignored (current state) |
list_drive_items |
List a drive folder's children | Ignored (current state) |
drive_search |
Search files/folders within a drive | Ignored (current state) |
Lists & Files:
| Query Type | Description | Time Range |
|---|---|---|
list_lists |
List a site's SharePoint lists | Ignored (current state) |
get_list |
Fetch a single list (optionally with items) | Ignored (current state) |
get_file_metadata |
Drive item metadata, incl. download URL | Ignored (current state) |
file_version_history |
Version history for a drive item | Ignored (current state) |
Site Usage Trends / Activity Trends (period-based CSV reports, same shape as site_usage_report/user_activity_report):
| Query Type | Description | Time Range |
|---|---|---|
site_usage_storage, site_usage_file_counts, site_usage_site_counts, site_usage_pages |
Site usage trend detail (storage/file counts/site counts/page views) | Ignored (period-based) |
activity_user_counts, activity_file_counts, activity_pages |
SharePoint activity trend detail (user/file counts/pages visited) | Ignored (period-based) |
Site & File Analytics:
| Query Type | Description | Time Range |
|---|---|---|
activity_interval |
Per-interval (day/week/month) activity trend for a site/drive item/list item | Respected (panel time range) |
item_site_analytics |
One-shot view/access analytics (allTime or lastSevenDays window) | Ignored (window param instead) |
Service Health:
| Query Type | Description | Time Range |
|---|---|---|
service_health_overview |
Current M365 service health status | Ignored (current state) |
service_health_issues |
Service health incidents | Respected |
service_health_messages |
Message Center posts | Ignored (current state) |
Audit Logs:
| Query Type | Description | Time Range |
|---|---|---|
list_subscriptions |
Current Management Activity API subscription status per content type | Ignored (current state) |
audit_sharepoint |
SharePoint audit events from the Office 365 Management Activity API | Respected (max 7-day lookback) |
dlp_violations |
DLP policy violations (RecordType=11) | Respected (max 7-day lookback) |
Error Handling and Retry Strategy
Retries use a fixed exponential backoff (0s/3s/6s, 3 attempts total) — upstream Retry-After headers are not consulted:
- HTTP 429 (rate limited) and HTTP 5xx responses: retried with the full backoff
- HTTP 401 (unauthorized): the cached token is cleared and the request is retried once immediately; a second 401 fails right away without consuming the 429/5xx retry budget
- Network/connection-level errors: retried with the same backoff as 429/5xx
Non-retryable: other HTTP 4xx errors (e.g., 403, 404) are returned immediately.
Bundled Dashboards
| Dashboard | Description |
|---|---|
| SharePoint Security Overview | Security alerts, DLP violations, audit events, file permissions |
| SharePoint Compliance & Configuration | Tenant settings, report anonymization, service incidents |
| SharePoint Operations & Capacity | Storage by site, site delta, user activity, service health |
Limitations and Recommendations
API Considerations:
- Audit and DLP events lag 2–6 hours; CSV reports lag 24–48 hours.
site_storage_quotafans out one API call per site and is capped at 500 sites by default./security/alerts_v2is not available in the Microsoft 21Vianet (China) national cloud.
Performance tips:
- Use the Publisher Identifier field to get a dedicated Activity API quota (baseline is 2,000 requests/minute shared across all tenant consumers).
- Prefer narrower site/file search queries for
file_permissionson large tenants.
Support
For issues, questions, or feature requests, please reach out to grafanalabs.integrations@crestdata.ai
Authors and Acknowledgment
Developed by Crest Data.
License
This plugin is distributed under EULA License. See the LICENSE file for details.
References
Grafana Cloud
Connect any plugin in Grafana Cloud.
- 150+ data source integrations
- Grafana Assistant - AI that correlates your data, builds queries, and answers questions
- 10k Prometheus metrics + 50 GB logs, traces, and profiles on the free tier
- ...and more
Insights
- Adoption
Running on 6 active Grafana instances.
- Activity
Last updated 24 Sep 2026.
2 releases in the past year.
- Queries
0 total queries served across all Grafana Cloud instances.
- Version
- 1.0.1
- Dependencies
- Grafana >=12.3.0
- Developer
- crestdata
Grafana Cloud
Connect any plugin in Grafana Cloud.
- 150+ data source integrations
- Grafana Assistant - AI that correlates your data, builds queries, and answers questions
- 10k Prometheus metrics + 50 GB logs, traces, and profiles on the free tier
- ...and more