
Rubrik Security Cloud Data Source Plugin for Grafana
Description
The Rubrik Security Cloud Data Source Plugin is a Grafana backend data source plugin that queries and visualizes Rubrik Security Cloud (RSC) data protection telemetry directly in Grafana panels.
Rubrik Security Cloud is Rubrik's SaaS control plane for backup, recovery and cyber resilience across on-premises and cloud workloads. The plugin connects to the RSC GraphQL API to retrieve cluster capacity and node performance, workload inventory, SLA policy and compliance, protection task outcomes, activity and audit events, and ransomware anomaly detections.
Features
- Query and visualize Rubrik Security Cloud data directly within Grafana
- Eighteen query types spanning six data domains:
- Infrastructure
- Cluster Disks — per-node disk inventory with capacity, encryption and health status
- Cluster Capacity & Runway — fleet capacity, growth rate and estimated days of headroom
- Cluster Nodes — node hardware inventory, role, status and network speed
- Node Performance Statistics — per-node CPU, memory, IOPS, throughput and network time series
- Workload Inventory
- Filesets — fileset templates and their filesets, per Linux, Windows or NAS host family
- Managed Volumes — provisioned size, channel count and snapshot distribution
- SQL Server Databases — database protection inventory with log backup policy
- Physical Hosts — host connectivity and OS inventory, per host family
- Virtual Machines — vSphere VM fleet with power state, agent status and SLA
- Policy & Compliance
- SLA Domains — SLA policy inventory with schedule, retention, archival and replication
- Workload Compliance Metrics — cross-workload compliance, snapshot counts and storage
- Activity, Tasks & Jobs
- Protection Tasks — row-level task outcomes with duration, transfer volume and failure cause
- Job Counts by Type — per-cluster running totals by activity type
- Events & Security
- Activity Events — backup and activity feed rendered in the Grafana logs view
- Audit Events — the RSC audit trail of logins, policy changes and configuration changes
- Workload Anomalies — ransomware and anomalous-snapshot detections with strain analysis
- Threat Monitoring Matches — IOC and malware file matches across protected workloads
- Users & Access
- Users and Access — user account inventory with MFA status, roles and lockout state
- Infrastructure
- Server-side filtering on every query type, including a required host-family selector for filesets and physical hosts
- Server-side time filtering on six time-based query types; the remaining twelve report current state
- OAuth2 service-account authentication with automatic in-memory token refresh
- Exhaustive cursor pagination — every page is fetched, with no row or page cap
- Cluster name and SLA domain name filters, usable as free-text dashboard template variables (the plugin does not populate these as live-queried dropdowns)
- Five pre-built dashboards covering protection, capacity, inventory, compliance and security
Compatibility
| Component | Version / Detail |
|---|---|
| Grafana | >= 12.3.0 |
| Rubrik API | Rubrik Security Cloud GraphQL API (/api/graphql) |
| Rubrik Go SDK | rubrik-polaris-sdk-for-go v1.9.2 |
| Authentication | OAuth2 Client Credentials (RSC service account) |
| Base URL | Configurable per datasource — https://{accountName}.my.rubrik.com for a real tenant, or any reachable host (e.g. a mock/staging endpoint); the plugin appends /api itself |
Demonstration Video
Please find attached a demo video showcasing how to use the Rubrik RSC integration.
Installation
Requirements
- Grafana >= 12.3.0
- A Rubrik Security Cloud tenant
- An RSC service account with read access to the queried domains (Infrastructure/Clusters, Data Protection inventory, SLA Domains, Reports, Events, Audit Log, and Threat/Anomaly Analytics)
- Network egress from the Grafana backend to
https://{accountName}.my.rubrik.comon TCP/443
Obtain Rubrik Security Cloud Credentials
- Log in to your RSC console at
https://{accountName}.my.rubrik.comas a user with the Administrator role, or a role with the Manage Service Accounts permission. - Note the
{accountName}portion of that URL — everything before.my.rubrik.com. The Base URL configuration field ishttps://{accountName}.my.rubrik.com(no/apisuffix — the plugin appends it). - Navigate to Settings (gear icon) → Users & Access → Service Accounts.
- Click Add Service Account. Give it a name, for example
grafana-datasource, and an optional description. - Assign a role. Use Administrator for full coverage, or a custom role with View on: Clusters/Infrastructure, Data Protection inventory (VMs, SQL Server, Filesets, Hosts, Managed Volumes), SLA Domains, Reports, Events, Audit Log, and Threat/Anomaly Analytics.
- Click Add. RSC downloads a JSON file containing
client_id,client_secret,nameandaccess_token_uri. The client secret is shown only once — if it is lost, delete and recreate the service account. - Copy
client_id(formatclient|<uuid>) andclient_secretfrom that file into the Grafana configuration form. Thenameandaccess_token_urivalues are not needed; the plugin derives the token URI from the configured Base URL. - Click Save & Test in Grafana.
Install the Plugin
Grafana Cloud
- Navigate to your Grafana Cloud stack.
- Go to Administration → Plugins and data → Plugins.
- Search for Rubrik Security Cloud and click Install.
Self-managed Grafana
grafana cli plugins install crestdata-rubriksecuritycloud-datasource
Restart the Grafana server after installation.
Configure the Data Source
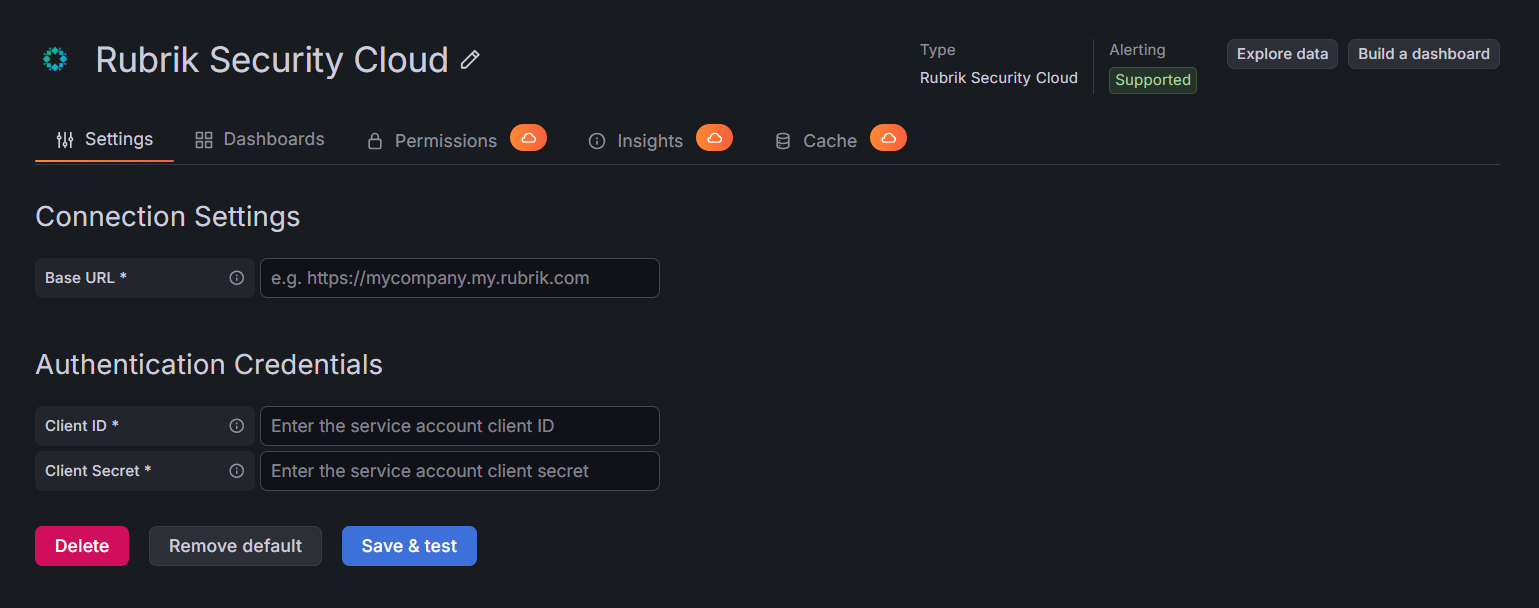
Navigate to Connections → Data sources → Add new data source and select Rubrik Security Cloud.
| Field | Type | Required | Description |
|---|---|---|---|
| Account Name | String | Yes | Your RSC account subdomain — the part before .my.rubrik.com in your console URL, for example mycompany. The plugin builds the GraphQL and token URLs from it. |
| Client ID | Secure string | Yes | The service account client ID, format client|<uuid>. |
| Client Secret | Secure string | Yes | The service account client secret. Shown only once in the RSC console. |
Both credentials are stored encrypted in Grafana's secure settings store and are never returned to the browser.
Click Save & Test. The plugin performs a lightweight deployment-version query to confirm that the credentials and network path work.
Usage
Query Editor
Select a Query Type first. The editor then reveals only the filters that query type supports. Combobox selections re-run the query immediately; text inputs re-run on blur. Every filter is optional unless marked otherwise, and blank filters are omitted from the request entirely.
Query types that support server-side time filtering use the dashboard time range. The remaining query types report current state and ignore it — the Query Type tooltip states which behaviour applies.
Available Query Types
cluster_disks
Per-node disk inventory: capacity, encryption state, media type, health status and mount path.
- Filters: Cluster Name, Node ID, Disk Status, Disk Type
- Time range: not applied (current state)
- Frame: table, one row per disk
global_cluster_performance
Fleet capacity, growth and runway per cluster, including a computed utilisation percentage.
- Filters: Cluster Name, Connection State
- Time range: not applied (latest snapshot)
- Frame: table, one row per cluster
cluster_nodes
Node hardware inventory: hostname, IP address, role, status, CPU cores, memory and network speed.
- Filters: Cluster Name, Connection State
- Time range: not applied (current state)
- Frame: table, one row per node
node_statistics
Per-node performance samples: CPU, memory, read/write IOPS, throughput, network traffic, ingest and disk utilisation.
- Filters: Cluster Name, Node ID
- Time range: applied server-side
- Frame: time series in long format, sorted ascending by time
filesets
Fileset templates and the filesets created from them, with compliance status and storage figures.
- Discriminator: Host Root (required, defaults to Linux Hosts) — selects the Linux, Windows or NAS hierarchy
- Filters: Name Filter
- Time range: not applied (current state)
- Frame: table, one row per fileset
managed_volumes
Managed volume health, provisioned size, channel count and snapshot distribution.
- Filters: Name Filter, Relic Objects
- Time range: not applied (current state)
- Frame: table, one row per volume
mssql_databases
SQL Server database protection inventory, including log backup frequency and retention.
- Filters: Name Filter, Location, Relic Objects, Replicated Objects
- Time range: not applied (current state)
- Frame: table, one row per database
physical_hosts
Host connectivity and OS inventory, with the count of workloads discovered on each host.
- Discriminator: Host Root (required, defaults to Linux Hosts)
- Filters: Name Filter, Host Connectivity
- Time range: not applied (current state)
- Frame: table, one row per host
sla_domains
SLA policy inventory: object coverage, protected object count, snapshot schedule, retention, archival and replication specs.
- Filters: Name Filter, Object Type
- Time range: not applied (current state)
- Frame: table, one row per SLA domain
virtual_machines
vSphere virtual machine fleet with power state, agent status, guest OS and SLA assignment.
- Filters: Name Filter, Relic Objects
- Time range: not applied (current state)
- Frame: table, one row per virtual machine
tasks
Row-level protection task outcomes with duration, transferred volume, reduction ratios and failure cause.
- Filters: Task Status, Task Type, Object Type, Search Term — all comma-separated free text
- Time range: applied server-side
- Frame: table whose first column is the task end time, so it also feeds time-bucketed panels
monitoring_jobs
Per-cluster running job totals by activity type, plus a fleet-wide total. Use this query in conjunction with tasks to correlate job counts with detailed task outcomes.
- Filters: Cluster Name
- Time range: not applied (running totals)
- Frame: table, one row per cluster
events_activity
The activity and backup event feed, with severity, status and failure cause. Activity events track user-initiated operations alongside automated backup tasks, providing visibility into who performed what action and when.
- Filters: Severity, Activity Status, Activity Type, Object Type, Object Name
- Time range: applied server-side
- Frame: logs
- User Context: Activity events include the initiating user (for manual operations), scheduled job owner, or service account identity
events_audit
The RSC audit trail: logins, SLA changes, configuration changes, per user and source IP. Each audit event includes the authenticated user identity, timestamp, action performed, target object, outcome status, and originating IP address for complete access accountability.
- Filters: Audit Type, Audit Status, Audit Severity, Audit Object Type, Search Term
- Time range: applied server-side
- Frame: logs
- User & Access Details: Every audit event captures the user principal, authentication method, source IP/location, and the specific resource or permission that was accessed or modified
workload_metrics
Cross-workload compliance and storage metrics spanning every protected object type.
- Filters: Compliance Status, Protection Status, Object Type, Object State, Compliance Window, Search Term
- Time range: not applied — the Compliance Window selector is the real time control for this query type
- Frame: table, one row per workload
anomalies
Ransomware and anomalous-snapshot detections with strain analysis, resolution state, and affected user details. Each anomaly record includes workload identification, detection timestamp, severity level, encryption analysis, suspicious file counts, ransomware note indicators, and the threat match details that triggered the detection.
- Filters: Severity, Resolution Status, Encryption Level, Risk Level, Workload Name
- Time range: applied server-side; when a panel supplies no range the plugin defaults to the last 24 hours, because the API requires a begin time
- Frame: logs
- Threat Monitoring Details: Each anomaly includes the matched threat indicators (file patterns, encryption signatures, ransomware strains) and the user/process context where available
threat_monitoring
IOC (indicator of compromise) and malware file matches found across protected workloads. Each match represents a confirmed detection where files on a workload matched known threat signatures or indicators.
- Filters: Object Type (comma-separated list of object types to filter)
- Time range: applied server-side
- Frame: table, one row per matched object
- Detection Details: Each match includes the object identification, count of files that matched threat indicators, the match type (IOC or malware signature), and the timestamp of the most recent detection
users
User account inventory with role assignments, authentication domain, and multi-factor authentication status. Provides visibility into user access control, account lockout state, and TOTP/MFA enforcement.
- Filters: Domain, Email Filter
- Time range: not applied (current state)
- Frame: table, one row per user
- Access Control Details: Each user record includes authentication domain, role assignments (with role ID and name), account ownership flag, lockout state (locked status, lock method, lock/unlock timestamps), and TOTP/MFA status (enabled, enforced, configuration timestamp)
Time Range Handling
Five query types filter server-side on the dashboard time range: node_statistics, tasks, events_activity, events_audit, anomalies and threat_monitoring.
The other eleven report current state and ignore the time picker: cluster_disks, global_cluster_performance, cluster_nodes, filesets, managed_volumes, mssql_databases, physical_hosts, sla_domains, virtual_machines, monitoring_jobs, workload_metrics and users. To build a trend from these, set a dashboard refresh interval and let Grafana accumulate the series.
Enum Casing
Rubrik uses different casing for filter inputs and response values of the same concept. Query editor dropdowns use the filter casing (for example LOGIN, SUCCESS, SEVERITY_CRITICAL), while the values returned in result columns use the response casing (for example Login, Success, Critical). Dashboard transformations that match on a result column must use the response casing.
Error Handling and Retry Strategy
- Rubrik returns HTTP 200 with a populated
errorsarray for GraphQL failures, so the plugin inspects the GraphQL error code rather than the status code alone. - Transient failures — HTTP 429, 5xx and network errors — are retried automatically by the Rubrik SDK. The plugin adds no retry layer of its own.
- Access tokens are cached in memory and refreshed automatically on expiry.
- Panel error messages are deliberately generic. The detailed upstream error, including the Rubrik trace identifier, is written to the Grafana server log.
| Condition | Message shown in the panel |
|---|---|
| Query rejected (400) | The query was rejected by Rubrik Security Cloud. See server log for details. |
| Authentication failure (401) | Authentication failed. Please verify your credentials. |
| Permission denied (403) | The Rubrik service account is not permitted to read this data. |
| Object not found (404) | The requested Rubrik object was not found. |
| Rate limited (429) | Rubrik Security Cloud rate limit exceeded. Please retry shortly. |
| Server error (5xx) | Rubrik Security Cloud returned a server error. See server log for details. |
| Network or timeout | Failed to reach the Rubrik Security Cloud API. See server log for details. |
Resources Reference
| Query Type | GraphQL root field | Frame type |
|---|---|---|
cluster_disks |
allClusterConnection → clusterDiskConnection |
Table |
global_cluster_performance |
allClusterConnection → metric |
Table |
cluster_nodes |
allClusterConnection → clusterNodeConnection |
Table |
node_statistics |
allClusterConnection → clusterNodeStats |
Time series |
filesets |
filesetTemplates |
Table |
managed_volumes |
managedVolumes |
Table |
mssql_databases |
mssqlDatabases |
Table |
physical_hosts |
physicalHosts |
Table |
sla_domains |
slaDomains / slaDomain |
Table |
virtual_machines |
vSphereVmNewConnection |
Table |
tasks |
taskDetailConnection |
Table |
monitoring_jobs |
allClusterConnection → aliased activitySeriesConnection |
Table |
events_activity |
activitySeriesConnection |
Logs |
events_audit |
userAuditConnection |
Logs |
workload_metrics |
snappableConnection |
Table |
anomalies |
workloadAnomalies |
Logs |
threat_monitoring |
threatMonitoringMatchedObjects |
Table |
users |
usersInCurrentAndDescendantOrganization |
Table |
Included Dashboards
All five dashboards ship with auto-refresh disabled so you opt in explicitly.
Rubrik Security Cloud — Protection & Job Health
Protection task outcomes and the backup activity feed. Twelve KPI tiles (total, succeeded, failed and canceled tasks, success rate gauge, data and files transferred, average and longest duration, average data reduction, fleet job total, clusters reporting), an hourly stacked task-outcome bar chart, status and object-type distributions, job counts by type per cluster, tasks by SLA domain, a failed-task table, the backup event feed and a full task detail table.
Rubrik Security Cloud — Capacity & Performance
Cluster capacity, runway, disk health and per-node performance. Twelve KPI tiles (total, used and available capacity, utilisation gauge, minimum runway, daily growth, connected and disconnected clusters, node and disk counts, encrypted-disk gauge, failed or missing disks), a capacity split donut, a stacked capacity breakdown, runway per cluster, six per-node time series (CPU, memory, IOPS, throughput, network, ingest) and node, disk and capacity detail tables.
Rubrik Security Cloud — Workload Inventory
Virtual machines, SQL Server databases, filesets, physical hosts and managed volumes. Twelve KPI tiles across the workload families, power-state and connectivity donuts, fileset compliance, VMs per cluster, managed volumes by state, and five detail tables. The Host Family variable drives both the fileset and physical host panels.
Rubrik Security Cloud — SLA Compliance
SLA policy inventory and cross-workload compliance. Twelve KPI tiles (workload totals by compliance state, compliance rate gauge, missed snapshots, SLA domain and protected object counts, retention-locked policies, local and archive storage, workloads awaiting a first full), compliance and protection distributions, workloads by object type, out-of-compliance by SLA domain, storage by SLA domain, and SLA policy and workload compliance tables.
Rubrik Security Cloud — Security & Threat Posture
Ransomware detections and the audit trail. Six threat tiles (active, critical and resolved anomalies, high-encryption detections, suspicious files, ransomware notes), six audit tiles (total events, logins, failed actions, critical events, distinct users and source IPs), an hourly stacked audit trend, outcome and severity donuts, top users, events by type, anomalies by severity, plus anomaly detail, audit trail and security event feed panels.
Limitations and Recommendations
- Rate limit: Rubrik asks clients to stay under 50 requests per second. This budget is per RSC account and is shared with the RSC console, PowerShell and Terraform automation, SIEM collectors, and any other Grafana instance pointed at the same tenant.
- RSC only. Cluster-local CDM REST endpoints are out of scope.
- vSphere only for virtual machines. Hyper-V, Nutanix AHV and other hypervisors are not covered by
virtual_machines; useworkload_metrics, which spans all object types, for cross-hypervisor coverage.
Support
For issues, questions or feature requests, contact grafanalabs.integrations@crestdata.ai.
Authors and Acknowledgment
Developed by Crest Data.
License
This plugin is distributed under EULA License. See the LICENSE file for details.
References
Grafana Cloud
Connect any plugin in Grafana Cloud.
- 150+ data source integrations
- Grafana Assistant - AI that correlates your data, builds queries, and answers questions
- 10k Prometheus metrics + 50 GB logs, traces, and profiles on the free tier
- ...and more
Insights
- Adoption
Running on 6 active Grafana instances.
- Activity
Last updated 24 Sep 2026.
2 releases in the past year.
- Queries
0 total queries served across all Grafana Cloud instances.
- Version
- 1.0.2
- Dependencies
- Grafana >=12.3.0
- Developer
- crestdata
Grafana Cloud
Connect any plugin in Grafana Cloud.
- 150+ data source integrations
- Grafana Assistant - AI that correlates your data, builds queries, and answers questions
- 10k Prometheus metrics + 50 GB logs, traces, and profiles on the free tier
- ...and more