
Qualys Vulnerability & Endpoint Security Data Source for Grafana
Query Qualys vulnerability and endpoint security data directly from Grafana. The plugin talks to your Qualys subscription's API host and gateway with a single Qualys user and turns host detections, the KnowledgeBase, scans, asset inventory, container security, endpoint detection and mobile device data into Grafana panels, Explore results, and alerting queries.
Description
Features
- 16 read-only query types across Vulnerability Management (VM/VMDR), the KnowledgeBase and User Activity Log, CyberSecurity Asset Management (CSAM), Container Security, EDR, and Secure Enterprise Mobility (SEM).
- Server-side filtering where Qualys supports it (severity, status, QID, CVE, asset group, IP range, date fields) and query types that return every record where it does not.
- A Time Field selector for endpoints that offer more than one date, so it is clear which date the panel time range applies to.
- Pagination handled for you across every mechanism Qualys uses, with no client-side record limit. If a request fails part-way, the rows already retrieved are shown with a warning.
- Server-side aggregation for endpoint events, so a time series panel does not have to load every event.
- Two Qualys authentication schemes handled for you from one username and password, stored encrypted at rest.
- Retries and concurrency limits that respect Qualys API rate limiting.
Compatibility
| Item | Supported |
|---|---|
| Grafana | 13.1.0 and later |
| Qualys API | Host Detection and Host List API v5.0, KnowledgeBase API v4.0, Scan API v3.0, Scheduled Scan API v2.0, Activity Log, Asset Group and Appliance API v2.0, CSAM API v2.0, Container Security API v1.3, EDR API, SEM API v1 |
| Authentication | Qualys username and password |
| Deployments | Any Qualys platform |
Demonstration Video
Please find attached a demo video showcasing how to use the Qualys VMDR integration.
Installation
Requirements
- A Qualys subscription with the API add-on enabled, and the modules you intend to query.
- A Qualys user with API Access. Some modules need more:
- Container Security: CS API Access
- KnowledgeBase: authorization from Qualys Support
- Scanner Appliances: the Internal Scanning entitlement
- EDR is licensed separately from VMDR.
- Grafana 13.1.0 or later with the ability to install a backend data source plugin.
- Outbound HTTPS access from the Grafana server to your Qualys API host and gateway host.
Obtain Credentials
- Log in to the Qualys portal.
- Open Help → About and note the URLs under Security Operations Center for your platform. The API URL looks like
https://qualysapi.qg1.apps.qualys.comand the gateway URL likehttps://gateway.qg1.apps.qualys.com. - Use an existing Qualys user, or create a dedicated read-only user, with API Access and the module permissions above for the query types you intend to use.
- Note the username and password. Both hosts use the same credentials.
Install the Plugin
Install from the Grafana plugin catalog, or with the Grafana CLI:
grafana cli plugins install crestdata-qualysvmdr-datasource
On Grafana Cloud, install the plugin from the Administration → Plugins page of your stack.
Configure the Data Source
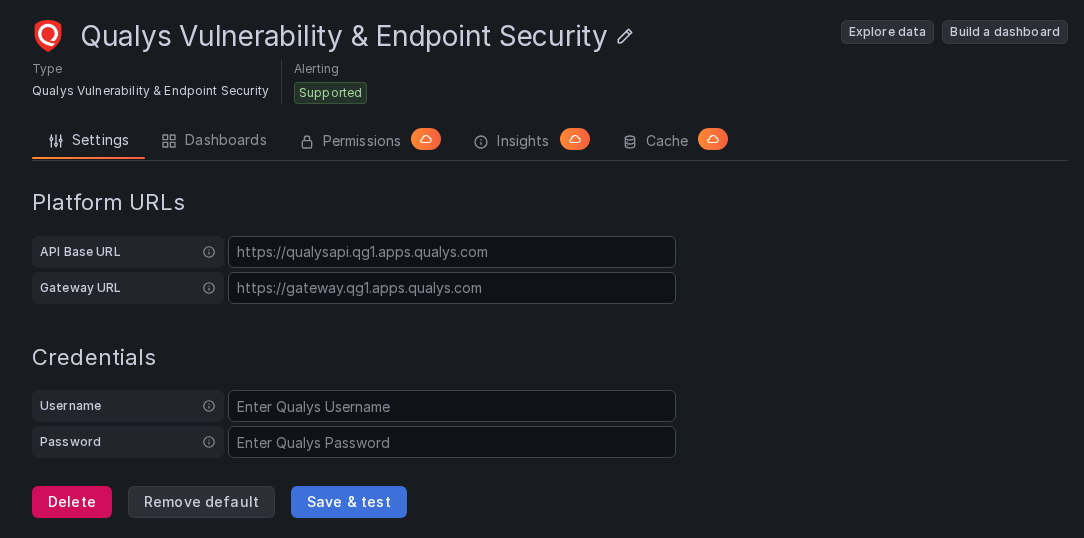
Go to Connections → Data sources → Add new data source → Qualys Vulnerability & Endpoint Security, fill in the fields below, then select Save & test.
| Field | Type | Required | Description |
|---|---|---|---|
| API Base URL | String | Yes | Your platform's API host, for example https://qualysapi.qg1.apps.qualys.com. Must be an https:// URL. |
| Gateway URL | String | Yes | Your platform's gateway host, for example https://gateway.qg1.apps.qualys.com. Must be an https:// URL. |
| Username | String | Yes | The Qualys username. |
| Password | Secret | Yes | The Qualys password. Stored encrypted. |
Save & test checks both hosts and lists the Qualys products your subscription includes. If only one host responds, the data source still saves and tells you which host is available, and queries for the other host fail until it is reachable.
Usage
Query Editor
Pick a Query Type first; the editor then shows only the filters that query type supports. Filters left empty are not sent to Qualys, and separate values in a filter with commas where the filter says so. Pagination is handled by the plugin and is not configurable.
- Time Field: shown when a query type has more than one date. It sets which date the panel time range applies to.
- Use Time Filter: shown for Asset Groups and Scanner Appliances, which have no date filter in Qualys. It is off by default so every record is shown; switch it on to keep only records updated within the panel time range. The plugin applies it after the data is retrieved.
Available Query Types
| Module | Query Type | Returns |
|---|---|---|
| VM / VMDR | Host Detections | Vulnerabilities found on each host: the vulnerability (QID), its severity and status, when it was found and last tested, and its Qualys Detection Score (QDS). |
| VM / VMDR | Host Inventory | Scanned hosts with IP, hostname, operating system, agent status, last scan dates, tags, asset group IDs and TruRisk score. |
| VM / VMDR | KnowledgeBase | The Qualys vulnerability catalog: title, severity, CVEs, CVSS scores, patch availability, solution and affected software. |
| VM / VMDR | Scan List | Vulnerability scans that ran in the selected time range: who launched them, the target, duration and status. |
| VM / VMDR | Scheduled Scans | Scan schedules with targets, owner, recurrence, next launch and notification settings. |
| VM / VMDR | Asset Groups | Asset groups with owners, IP ranges, hosts and appliances. |
| VM / VMDR | Scanner Appliances | Scanner appliances with status, software versions, running scans, hardware and network details. |
| VM / VMDR | User Activity Log | Audit trail of user actions in Qualys, such as logins, scans launched and setting changes, as a log stream. |
| CSAM | Asset Inventory | Assets discovered by CyberSecurity Asset Management: name, IP, operating system, hardware, software, open ports and criticality. |
| CSAM | Software Components (SBOM) | Software components found on your assets: name, version, technology and install path. |
| Container Security | Containers | Containers with name, image, state, cluster and vulnerability count. |
| Container Security | Images | Container images with repository, operating system, size, layers and vulnerability count. |
| EDR | Incidents | Security incidents with status, risk score, affected host, techniques, malware family and detection time. |
| EDR | Incident Events | The individual events that make up each incident: type, action, verdict, file and process details. |
| EDR | Endpoint Events | Process, file, network, registry and mutex events with the acting process and user, or event counts over time. |
| SEM | Mobile Asset Detections | Mobile devices with enrollment status, operating system, owner and vulnerability detections. |
Endpoint Events has an Aggregation selector. None returns individual events; Time Buckets returns event counts split into the number of equal time buckets you set in Bucket Count.
Query types that ignore the panel time range: Scheduled Scans always returns every schedule. Asset Groups and Scanner Appliances return every record unless Use Time Filter is on.
Scan List covers a 30-day window by default. For a wider panel time range the plugin reads it in 30-day steps.
Incidents are kept by Qualys for 60 days, so older incidents are not available.
Bundled Dashboards
The plugin ships six starter dashboards, installable from the plugin's page in the Grafana catalog (Dashboards tab) or auto-provisioned by provisioning/dashboards/ in the development environment:
| Dashboard | Covers |
|---|---|
| Qualys VM/VMDR Vulnerabilities | Host Detections and the KnowledgeBase |
| Qualys VM/VMDR Scan & Compliance Ops | Scan List, Scheduled Scans, Asset Groups, Scanner Appliances, User Activity Log |
| Qualys CSAM / Global AssetView | Asset Inventory and Software Components (SBOM) |
| Qualys Container Security | Containers and Images |
| Qualys EDR | Incidents, Incident Events, Endpoint Events |
| Qualys SEM (Mobile Security) | Mobile Asset Detections |
Each dashboard has a datasource template variable, so pick your configured Qualys data source instance after import.
Resources Reference
| Query Type | Frame type | Time column |
|---|---|---|
| Host Detections | Table | Last Updated |
| Host Inventory | Table | Last VM Scan |
| KnowledgeBase | Table | Last Modified |
| Scan List | Table | Launched |
| Scheduled Scans | Table | none |
| Asset Groups | Table | Last Update |
| Scanner Appliances | Table | Last Updated |
| User Activity Log | Logs | Time |
| Asset Inventory | Table | Last Modified |
| Software Components (SBOM) | Table | Last Found |
| Containers | Table | Updated |
| Images | Table | Updated |
| Incidents | Table | Detected On |
| Incident Events | Table | Time |
| Endpoint Events | Table, or time series with Time Buckets | Time |
| Mobile Asset Detections | Table | Last Seen |
Readable Values
Some columns keep the numeric value Qualys returns, so sorting and thresholds still work, and show the name Qualys documents for it.
| Column | Shown as |
|---|---|
| Severity (Host Detections, KnowledgeBase, Mobile Asset Detections) | 1 Minimal, 2 Medium, 3 Serious, 4 Critical, 5 Urgent |
| QDS Severity (Host Detections, Containers) | Low, Medium, High, Critical |
Rate Limits
Qualys limits the number of concurrent API calls as well as the request rate, and the limits apply to your whole subscription. The plugin sends its requests one at a time and retries a throttled request up to three attempts in total, waiting a little longer each time. A dashboard with many panels or a very short refresh interval can still reach the limit; if panels report a rate limit error, use a longer refresh interval.
Support
For issues, questions, or feature requests, please reach out to grafanalabs.integrations@crestdata.ai
Authors and Acknowledgment
Developed by Crest Data.
License
This plugin is distributed under EULA License. See the LICENSE file for details.
References
- Qualys API documentation: https://docs.qualys.com/en/vm/api/index.htm
- Qualys Container Security API: https://docs.qualys.com/en/cs/api/
- Qualys EDR API: https://docs.qualys.com/en/edr/latest/mergedProjects/edr_api/
- Grafana data source plugin documentation: https://grafana.com/developers/plugin-tools/
Grafana Cloud
Connect any plugin in Grafana Cloud.
- 150+ data source integrations
- Grafana Assistant - AI that correlates your data, builds queries, and answers questions
- 10k Prometheus metrics + 50 GB logs, traces, and profiles on the free tier
- ...and more
Insights
- Activity
Last updated 15 Oct 2026.
0 releases in the past year.
- Queries
0 total queries served across all Grafana Cloud instances.
- Version
- 1.0.1
- Dependencies
- Grafana >=13.1.0
- Developer
- crestdata
Grafana Cloud
Connect any plugin in Grafana Cloud.
- 150+ data source integrations
- Grafana Assistant - AI that correlates your data, builds queries, and answers questions
- 10k Prometheus metrics + 50 GB logs, traces, and profiles on the free tier
- ...and more