
Qualys Compliance & Application Security Data Source for Grafana
Query Qualys compliance and application security data directly from Grafana. The plugin talks to your Qualys subscription's API base host and gateway with a single Qualys user and turns Policy Compliance posture, controls and exceptions, Policy Compliance Reporting Service (PCRS) posture streams, Web Application Scanning findings, File Integrity Monitoring events and the compliance activity log into Grafana panels, Explore results, and alerting queries.
Description
Features
- Fifteen read-only query types across four modules:
- Web Application Scanning (WAS)
- Web Applications — the application inventory, with scan status and scheduling
- Scans — scan history, with mode, status and duration
- Findings — vulnerabilities, sensitive content and information gathered
- Policy Compliance (PC)
- Posture Info (legacy) — per-host, per-control pass/fail posture
- Policy List — compliance policies and their controls
- Compliance Controls — the control library
- Compliance Exceptions — granted exceptions and their expiry
- Compliance Scan List — compliance scan history
- Compliance Activity Log — policy, exception and scan activity as a log stream
- Policy Compliance Reporting Service (PCRS)
- PCRS Host IDs — the hosts evaluated against each policy
- PCRS Posture Info — streaming posture for large compliance estates
- File Integrity Monitoring (FIM)
- File Change Events — file and registry change events
- Ignored File Change Events — events matched by an ignore rule
- Incidents — FIM incidents and their review status
- Monitored Assets — the assets FIM is watching
- Web Application Scanning (WAS)
- Server-side filtering on policy, status, criticality, IP range, QID, severity, scan type, web application, finding type, FIM reputation/trust status, asset name, incident approval status/type/rule, and activity-log fields; see Available Query Types for exactly which filters each query type offers.
- A Time Field selector for endpoints that expose more than one meaningful date, so the mapping from the panel time range is explicit rather than guessed.
- Pagination handled for you across every mechanism Qualys uses — continuation URLs, keyset ids and the FIM
searchAftercursor — with no client-side record limit. A partial read attaches a warning to the panel instead of truncating silently. - Posture streaming for large compliance estates: PCRS host IDs are resolved and posted back in chunks, and posture responses are decompressed for you.
- Two authentication schemes handled for you: HTTP Basic for the API base host and a bearer token for the gateway, both from one username and password stored encrypted at rest.
- Built-in concurrency and rate-limit handling that honours Qualys's own wait hints.
Compatibility
| Component | Version / Detail |
|---|---|
| Grafana | 13.1.0 and later |
| Qualys WAS API | REST API v3.0 (/qps/rest/3.0/...) |
| Qualys PC API | Posture Info v2.0, Compliance Scans v2.0, Policies v4.0, Controls v4.0, Exceptions v3.0 (all under /api/<ver>/fo/compliance/...) |
| Qualys PCRS API | v5.0 (/pcrs/5.0/...) |
| Qualys FIM API | Events and Ignored Events v2 (/fim/v2/...), Incidents and Monitored Assets v3 (/fim/v3/...) |
| Qualys Activity Log API | v2.0 (/api/2.0/fo/activity_log/) |
| Authentication | Qualys username and password (HTTP Basic for the API host, bearer token for the gateway) |
| Deployments | Any Qualys platform pod |
Demonstration Video
Please find attached a demo video showcasing how to use the Qualys AppSec integration.
Installation
Requirements
- A Qualys subscription with the API add-on enabled, and the modules you intend to query (Policy Compliance, PCRS, WAS and/or File Integrity Monitoring).
- A Qualys user with API Access. PCRS query types also require the Manager role.
- FIM is a separately licensed product, and so is WAS.
- Grafana 13.1.0 or later with the ability to install a backend data source plugin.
- Outbound HTTPS access from the Grafana server to your Qualys API base host and gateway host.
Obtain Credentials
- Log in to the Qualys portal.
- Open Help → About and note the Security Operations Center URLs for your pod. Your API base URL looks like
https://qualysapi.qg1.apps.qualys.comand your gateway URL likehttps://gateway.qg1.apps.qualys.com. - Use an existing Qualys user, or create a dedicated read-only user, with API Access enabled and the module permissions listed above for the query types you intend to use.
- Note the user's username and password. Both hosts use the same credentials.
Install the Plugin
Grafana Cloud
- Navigate to your Grafana Cloud stack.
- Go to Administration → Plugins and data → Plugins.
- Search for Qualys Compliance & Application Security and click Install.
Self-managed Grafana
grafana cli plugins install crestdata-qualysappsec-datasource
Restart the Grafana server after installation.
Configure the Data Source
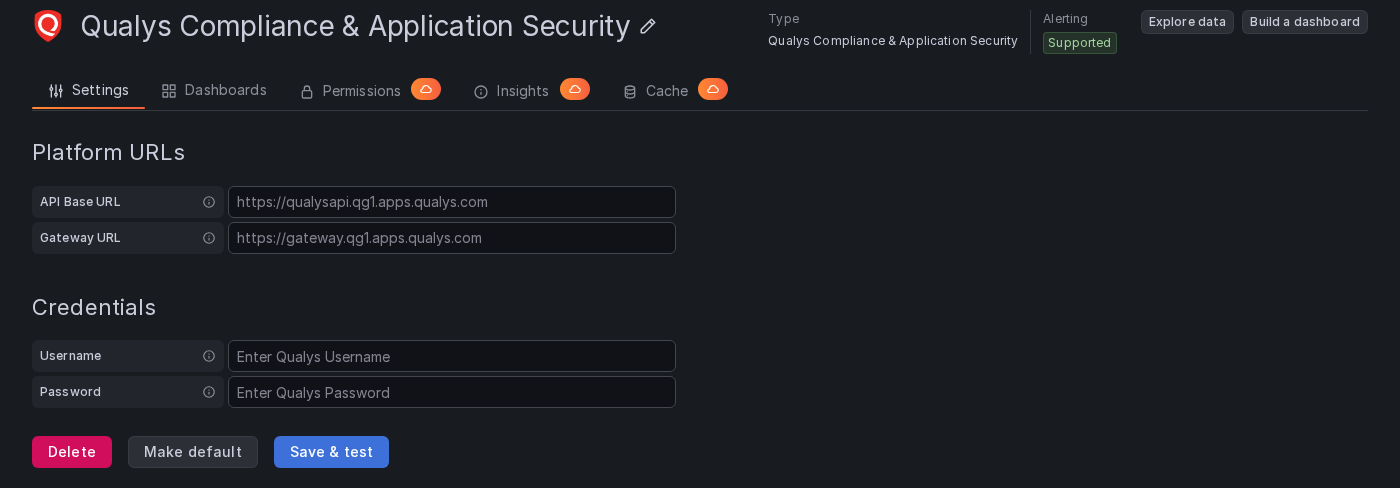
Go to Connections → Data sources → Add new data source → Qualys Compliance & Application Security, fill in the fields below, then select Save & test.
| Field | Type | Required | Description |
|---|---|---|---|
| API Base URL | String | Yes | Your pod's API host, for example https://qualysapi.qg1.apps.qualys.com. Must be an absolute https:// URL. |
| Gateway URL | String | Yes | Your pod's gateway host, for example https://gateway.qg1.apps.qualys.com. Must be an absolute https:// URL. |
| Username | String | Yes | The Qualys username. |
| Password | Secret | Yes | The Qualys password. Stored encrypted. |
There is deliberately no authentication-method selector: the plugin picks HTTP Basic or a bearer token from each endpoint's host, and obtains the gateway token for you.
Save & test validates both hosts independently and reports which modules your subscription includes. A subscription that answers on only one host is a legitimate configuration and is reported as healthy with a warning — the query types for the unavailable half are annotated in the editor.
Usage
Query Editor
Pick a Query Type first; the editor then shows only the fields that query type supports. Filters left empty are not sent to Qualys. Pagination is handled by the plugin and is not configurable. Two controls are worth knowing about:
- Time Field — Qualys has no single timespan parameter, and several endpoints expose more than one meaningful date. This selector says which one the panel's time range maps to.
- Use Time Filter — shown for the endpoints with no usable date filter. It is off by default; switch it on to trim rows in the backend to the panel time range. It cannot reduce what the API transfers.
Available Query Types
Web Applications (wasWebApps)
The web application inventory with scan status, default profile and scanner, tags and scheduling.
- Filters: Status, Scanned, Scheduled
- Time range: applied server-side (Updated or Last Scan Date)
- Frame: table
Scans (wasScans)
Scan history with mode, status, duration, target application, results status and vulnerability counts.
- Filters: Status, Scan Type, Scan Mode, Web App ID
- Time range: applied server-side (Launched)
- Frame: table
Findings (wasFindings)
Web application findings with QID, severity, status, OWASP and WASC classification, first and last detected dates, and ignore details.
- Filters: Severities, Status, QIDs, Finding Type, Web App ID
- Time range: applied server-side (Last Detected or First Detected)
- Frame: table
Posture Info (legacy) (pcPostureInfo)
Per-host, per-control pass/fail posture with host, control and technology detail, evaluation dates and evidence. Requires Policy IDs.
- Filters: Policy IDs (required), Status (a single choice: Qualys accepts one status per request), IP / Target, Criticality
- Time range: applied server-side (Status Changed or Evaluation Date)
- Frame: table
Policy List (pcPolicyList)
Compliance policies with owners, status, evaluation dates and their controls.
- Filters: Policy IDs
- Time range: applied server-side (Last Modified)
- Frame: table
Compliance Controls (pcControls)
The control library with category, statement, criticality and technologies.
- Filters: none
- Time range: applied server-side (Updated or Created), lower bound only
- Frame: table
Compliance Exceptions (pcExceptions)
Exceptions with host, policy, control, assignee, status and expiry.
- Filters: Status, IP Address, Policy ID. Qualys accepts one value for each per request, so Status is a single choice and the IP and Policy ID fields take one value.
- Time range: no usable date filter on the endpoint; the plugin trims rows on Last Modified or Expires (your choice in Time Field) when Use Time Filter is switched on
- Frame: table
Compliance Scan List (pcScanList)
Compliance scan history with type, launcher, state, duration, target and policy.
- Filters: Status, Scan Type, IP / Target. Status accepts several states at once.
- Time range: applied server-side (Launched). The endpoint defaults to a 30-day window; the plugin walks wider panel ranges in 30-day steps.
- Frame: table
Compliance Activity Log (pcActivityLog)
Policy, exception and compliance scan activity as a log stream. You see only the activity permitted by your Qualys user role.
- Filters: User Action, Action Details, Username
- Time range: applied server-side (Time)
- Frame: logs
PCRS Host IDs (pcrsHostIds)
The hosts evaluated against each selected policy, one row per host. Useful as a template-variable source.
- Filters: Policy IDs
- Time range: applied server-side (Status Changed Since or Last Scan Date)
- Frame: table
PCRS Posture Info (pcrsPostureInfo)
Streaming posture for large estates, with criticality, first and last pass and fail dates, and evidence and scan source.
- Filters: Policy IDs, Status, Criticality
- Time range: applied server-side (Status Changed Since or Last Evaluated)
- Frame: table
File Change Events (fimEvents)
File and registry change events. Qualys only retains events for 15 months.
- Filters: Action, Severities, Reputation Status, Trust Status, Asset Name, Actor User Name
- Time range: applied server-side (Event Time)
- Frame: table
Ignored File Change Events (fimIgnoredEvents)
Events matched by an ignore rule, so they never raise an incident. Qualys only retains them for 15 months.
- Filters: Action, Severities, Reputation Status, Trust Status, Asset Name, Actor User Name
- Time range: applied server-side (Event Time)
- Frame: table
Incidents (fimIncidents)
FIM incidents with approval status, disposition, rule, reviewer dates and change type. Qualys only retains incidents for 15 months.
- Filters: Status, Approval Status, Incident Type, Rule Name
- Time range: applied server-side (Window End)
- Frame: table
Monitored Assets (fimAssets)
Assets monitored by File Integrity Monitoring, with operating system and manifest status.
- Filters: Asset Name
- Time range: not applied — the endpoint offers no date filter at all
- Frame: table
Time Range Handling
Thirteen query types filter server-side on the dashboard time range. pcExceptions has no server-side date filter but can trim rows on Last Modified in the backend when Use Time Filter is switched on (off by default). fimAssets has no date filter of any kind and always returns the full monitored-asset list.
Readable values
Coded columns keep their raw number underneath (so sorting and thresholds work) and show the name Qualys documents for it:
| Column | Shown as |
|---|---|
| Severity (WAS Findings, FIM Events) and Original Severity | 1 Minimal, 2 Medium, 3 Serious, 4 Critical, 5 Urgent |
| Criticality and Criticality Value (Policy Compliance, PCRS) | 0 Undefined, 1 Minimal, 2 Medium, 3 Serious, 4 Critical, 5 Urgent |
Error Handling
Panel error messages are deliberately generic and never include upstream text, credentials or internal detail; check the Grafana server log for the full picture.
| Condition | Message shown in the panel |
|---|---|
| Authentication failure (401) | Authentication failed: Qualys rejected the configured username and password. |
| Access denied (403) | Access denied: the Qualys user's role or license does not allow this data. Check that the API add-on and this module are enabled. |
| Not found (404) | Qualys did not recognise the request. Check the API Base URL and Gateway URL, that the subscription includes this module, and the query's filter values. |
| Rate or concurrency limit (429 / 409) | The Qualys API rate limit or concurrency limit was reached and retries were exhausted. Reduce the dashboard refresh rate or the number of simultaneous panels. |
| Server error (5xx) | Qualys encountered an internal error, is in maintenance, or is temporarily unavailable. Try again later. |
| Network, DNS or TLS failure | Unable to connect to Qualys, resolve its hostname, or verify its TLS certificate. Check the API Base URL and Gateway URL and the network path. |
| Timeout | The request to Qualys timed out. Try again later, or narrow the time range or filters. |
Rate limits — read this before setting a refresh interval
Qualys limits concurrency as well as request rate, and on the Standard service level the concurrency limit is two calls per subscription. A dashboard fires every panel at once, so concurrency — not throughput — is what a fast refresh breaks first.
The plugin serialises its requests and honours the vendor's own wait hints. Even so:
- Keep the refresh interval at 15 minutes or slower. The underlying data is refreshed by Qualys scans on an hours-to-days cadence, so a faster refresh spends rate-limit budget without surfacing new data.
- The rate limit is per subscription, not per client — this plugin competes with your SIEM connectors, CI scanners and the Qualys UI for the same budget.
The plugin never truncates silently. A partial read attaches a warning to the panel telling you how much was retrieved.
Resources Reference
| Query Type | Endpoint | Frame type | Time column |
|---|---|---|---|
| Web Applications | POST /qps/rest/3.0/search/was/webapp |
Table | Updated |
| Scans | POST /qps/rest/3.0/search/was/wasscan |
Table | Launched |
| Findings | POST /qps/rest/3.0/search/was/finding |
Table | Last Detected |
| Posture Info (legacy) | GET /api/2.0/fo/compliance/posture/info/ |
Table | Posture Modified |
| Policy List | GET /api/4.0/fo/compliance/policy/ |
Table | Last Modified |
| Compliance Controls | GET /api/4.0/fo/compliance/control/ |
Table | none |
| Compliance Exceptions | GET /api/3.0/fo/compliance/exception/ |
Table | Last Modified |
| Compliance Scan List | GET /api/2.0/fo/scan/compliance/ |
Table | Launched |
| Compliance Activity Log | GET /api/2.0/fo/activity_log/ |
Logs | Time |
| PCRS Host IDs | GET /pcrs/5.0/posture/hostids |
Table | none |
| PCRS Posture Info | POST /pcrs/5.0/posture/postureInfo |
Table | Posture Modified |
| File Change Events | POST /fim/v2/events/search |
Table | Time |
| Ignored File Change Events | POST /fim/v2/events/ignore/search |
Table | Time |
| Incidents | POST /fim/v3/incidents/search |
Table | Window End |
| Monitored Assets | POST /fim/v3/assets/search |
Table | none |
Included Dashboards
| Dashboard | Covers |
|---|---|
| Qualys AppSec Web Application Scanning | Web application inventory, scan activity, and findings across your registered applications. |
| Qualys AppSec Policy Compliance Posture | Policies, the control library, and pass/fail posture from the reporting service (PCRS). A Policy IDs variable optionally narrows posture panels to specific policies. |
| Qualys AppSec Policy Compliance Operations | Scan activity, granted exceptions, and the compliance user activity log. |
| Qualys AppSec File Integrity Monitoring | File change events, ignored events, incidents and monitored assets. |
Support
For issues, questions, or feature requests, please reach out to grafanalabs.integrations@crestdata.ai
Contributing
See the repository README for local development setup, the project layout, the development workflow, and how to run the backend tests and the plugin validator. The repository also ships a mock Qualys server so contributors can run the plugin end to end without a Qualys subscription.
Authors and Acknowledgment
Developed by Crest Data.
License
This plugin is distributed under EULA License. See the LICENSE file for details.
References
- Qualys API documentation: https://docs.qualys.com/en/vm/api/index.htm
- Qualys WAS API: https://docs.qualys.com/en/was/api/
- Qualys FIM API: https://docs.qualys.com/en/fim/api/index.htm
- Grafana data source plugin documentation: https://grafana.com/developers/plugin-tools/
Grafana Cloud
Connect any plugin in Grafana Cloud.
- 150+ data source integrations
- Grafana Assistant - AI that correlates your data, builds queries, and answers questions
- 10k Prometheus metrics + 50 GB logs, traces, and profiles on the free tier
- ...and more
Insights
- Activity
Last updated 14 Oct 2026.
1 release in the past year.
- Queries
0 total queries served across all Grafana Cloud instances.
- Version
- 1.0.0
- Dependencies
- Grafana >=13.1.0
- Developer
- crestdata
Grafana Cloud
Connect any plugin in Grafana Cloud.
- 150+ data source integrations
- Grafana Assistant - AI that correlates your data, builds queries, and answers questions
- 10k Prometheus metrics + 50 GB logs, traces, and profiles on the free tier
- ...and more