
Prisma Cloud CSPM Data Source for Grafana
The Prisma Cloud CSPM data source plugin lets you query and visualize security alerts, administrative audit logs, cloud account inventory, asset inventory, compliance posture and trend, individual resource scan results, vulnerability prioritisation and burndown, code-to-cloud trends, and licensing consumption from Palo Alto Networks Prisma Cloud CSPM directly in Grafana. It is a backend plugin that talks to the Prisma Cloud CSPM REST API.
Overview
Bring your Prisma Cloud posture into Grafana: what is alerting right now, which standards you are failing and how that is trending, which individual resources are misconfigured, which CVEs to fix first, and how much of your license you are consuming — all read-only, all server-side.
Features
- Fourteen query types: Alerts, Audit Logs, Cloud Accounts, Asset Inventory, Compliance Posture, Compliance Trend, Asset Explorer (Resource Scan), Vulnerability Burndown, Prioritized Vulnerabilities, CVE Overview, Vulnerable Assets by CVE, Code-to-Cloud Deploy Trend, Code-to-Cloud Runtime Trend, and Licensing & Usage.
- Server-side filtering wherever the API supports it — severity, alert status, cloud type,
compliance standard, asset/resource type, lifecycle stage, account IDs — pushed into the API's
own
filtersmodel (one entry per dimension, each carrying a single value) so the tenant does the filtering, not the plugin. - The dashboard time range is used where — and only where — the API accepts one. Each query type states its own time behaviour directly in the query editor, so a snapshot endpoint is never mistaken for a broken time filter. See Time ranges.
- Exhaustive pagination: every page of every paginated endpoint is fetched — no row caps.
- Four curated dashboards bundled with the plugin.
- Secure by design: the Access Key ID and Secret Key are stored encrypted in
secureJsonData, the session JWT is cached in memory and refreshed automatically, and upstream failures surface only a generic message — specifics go to the Grafana server log. Mistakes you can fix in the query editor (a missing CVE ID or Account IDs) are reported directly on the panel instead. - Isolated per query: a failure in one query cannot take down the datasource for every other panel.
Compatibility
| Component | Supported |
|---|---|
| Grafana | >= 13.1.0 |
| Prisma Cloud API | CSPM REST API (all tenant regions) |
| Authentication | Access Key ID + Secret Key exchanged for a session JWT via POST /login |
Installation
Requirements
- A Prisma Cloud tenant reachable from the Grafana backend on port 443.
- A Prisma Cloud role permitted to create Access Keys, and permitted to read the modules you plan to query. Querying a module your role or license does not cover fails the query rather than returning empty data — the panel shows a generic "query failed" message and the specific cause is written to the Grafana server log only.
Obtain Credentials
- Log in to the Prisma Cloud console for your tenant.
- Navigate to Settings → Access Control → Access Keys.
- Click Add Access Key, name it, and optionally set an expiry.
- The Access Key ID and Secret Key are shown once, at creation — copy both immediately. The Secret Key cannot be retrieved later.
- Paste them into the plugin's configuration along with your tenant's API URL, then Save & Test.
The plugin re-authenticates automatically when the session token expires (it is refreshed every 9 minutes), but it cannot renew an expired or revoked Access Key — rotate that in the console and update the datasource configuration.
Configure the Data Source
| Field | Type | Required | Description |
|---|---|---|---|
| API Base URL | string | Yes | Your tenant's API hostname, e.g. api.prismacloud.io. The scheme is optional (https:// is added when omitted) and a trailing slash is stripped, so a full URL copied from the Prisma Cloud docs also works. This must be the API host for your tenant's region, not the console URL — see the regional URL list in the CSPM API reference. |
| Access Key ID | secure string | Yes | Access Key ID from Settings → Access Control → Access Keys. Stored encrypted server-side. Multi-tenant users: enter your Prisma Cloud username here instead. |
| Secret Key | secure string | Yes | Secret Key paired with the Access Key ID; shown only once at creation. Stored encrypted server-side. Multi-tenant users: enter your Prisma Cloud password here instead. |
| Prisma ID | string | No | Multi-tenant deployments only. Available from the license information in the console. Preferred over Customer Name. |
| Customer Name | string | No | Multi-tenant deployments only; an acceptable alternative to Prisma ID. Leave blank for a standard single-tenant account. Setting both is allowed only if they refer to the same tenant. |
Click Save & Test to verify connectivity. The health check performs a real POST /login and
confirms a session token comes back, so it fails fast on a wrong region URL, a typo'd key, or an
expired key.
Usage
Query Editor
Every query starts with Query Type. Next to it, the editor shows that query type's time-range behaviour — whether it follows the dashboard/Explore time picker or not, and why — with the full explanation on hover. The remaining fields are the filters that query type supports.
| Field | Shown for | Description |
|---|---|---|
| Query Type | Always | Selects the Prisma Cloud data category to query. |
| Severity Filter | Alerts, Vulnerability Burndown, Prioritized Vulnerabilities, Vulnerable Assets | Single-select; blank means all severities. Alerts offer high/medium/low only (see below); the vulnerability query types additionally offer critical and informational. |
| Alert Status | Alerts | Single-select; blank means all statuses. One of open, dismissed, snoozed, resolved, pending_resolution. |
| Cloud Type | Alerts, Asset Inventory, Asset Explorer, Compliance Posture, Compliance Trend, Licensing | Single-select: AWS, Azure, GCP, Alibaba, OCI, IBM. Blank = all clouds. |
| Compliance Standard | Compliance Posture, Compliance Trend | Standard name as it appears in the console, e.g. CIS v1.4.0. Blank = all standards. |
| Asset Type | Asset Explorer | Matches the resource.type filter, in display-name form, e.g. AWS S3 Bucket. |
| CVE ID | CVE Overview, Vulnerable Assets by CVE | Required. Both endpoints describe exactly one CVE. |
| Asset Types | Vulnerability Burndown, Prioritized Vulnerabilities, Vulnerable Assets | Multi-select: package, iac, deployedImage, vmImage, registryImage, host, serverlessFunction. |
| Life Cycle | Vulnerability Burndown, Prioritized Vulnerabilities, Vulnerable Assets | Multi-select: code, build, deploy, run. |
| Account IDs | Prioritized Vulnerabilities, Licensing | Comma-separated cloud account IDs. Optional for Prioritized Vulnerabilities; required for Licensing, where the API declares it required. |
| Time Amount / Time Unit | Licensing | The relative window this endpoint accepts, counted backward from now. Defaults to 30 / Day. |
Alert severity is deliberately narrower than the filter enum. Prisma Cloud's alert filter
accepts critical and informational, but the alert/policy response schema declares
policy.severity as only high, medium or low — no alert can ever carry the other two.
Offering them would silently return zero rows every time, so the Alerts severity picker omits them.
Time ranges
Only three query types can use the dashboard time picker, because only three endpoints accept an arbitrary absolute window. The query editor states which case applies to the selected query type, so "I narrowed the time range and nothing changed" is never a mystery.
| Query type | Time behaviour |
|---|---|
| Alerts | Uses the dashboard time range — sent to POST /v2/alert as an absolute timeRange. |
| Audit Logs | Uses the dashboard time range — sent to POST /audit/api/v1/log as an absolute timeRange. |
| Compliance Trend | Uses the dashboard time range — sent to POST /v2/compliance/posture/trend as an absolute timeRange. |
| Licensing & Usage | Ignores the time picker. POST /license/api/v2/time_series accepts only a relative range counted backward from now, which cannot express an arbitrary absolute window — use the Time Amount / Time Unit fields instead. |
| Vulnerability Burndown, Code-to-Cloud Deploy Trend, Code-to-Cloud Runtime Trend | Ignore the time picker. These endpoints take no time parameters and always return a vendor-controlled trailing 30 days. |
| Cloud Accounts, Asset Inventory, Compliance Posture, Asset Explorer, Prioritized Vulnerabilities, CVE Overview, Vulnerable Assets | Ignore the time picker. These are snapshot endpoints with no time dimension. |
The plugin never sends a time parameter an endpoint does not document.
Available Query Types
Alerts & Threat Detection (alerts)
Security alerts within the dashboard time range. Columns: alert_id, status, alert_time,
first_seen, last_seen, policy_id, policy_name, policy_type, policy_severity,
cloud_type, remediable, resource_id, resource_name, cloud_account, cloud_account_id,
cloud_region, resource_type. Filters: Severity, Alert Status, Cloud Type.
Audit Logs (audit_logs)
Tenant administrative audit trail for the dashboard time range, rendered as a Logs panel by
default. Columns: time, action, user, action_type, result, ip_address, resource_name,
resource_type. action comes first because Grafana's Logs panel renders the first string field
as the log line, and action is the human-readable description of what happened. No filters
beyond the time range.
Cloud Accounts (cloud_accounts)
Every onboarded cloud account. Columns: account_id, name, cloud_type, account_type,
status, enabled, deployment_type, protection_mode, child_account_count, added_on,
last_modified, owner, parent_account_id, account_group_count. No filters.
Asset Inventory (asset_inventory)
Returns two frames, both named after the API's own summary fields. The tenant-wide summary
frame (asset_inventory_summary) has total_resources, passed_resources, failed_resources,
unscanned_resources, critical_failed, high_failed, medium_failed, low_failed. The grouped
frame (asset_inventory_groups) has one row per cloud type with cloud_type, account_name,
account_id, region, service, resource_type, and the same numeric fields. Because both
frames name the same quantities, a panel picks one of them by FRAME — Grafana prefixes a field's
display name with its frame name whenever a response carries several named frames, so a Filter
fields by name pattern of /^asset_inventory_summary total_resources$/ addresses the tenant-wide
total and /^asset_inventory_groups total_resources$/ the per-cloud-type one. Filter: Cloud Type.
Compliance Posture (compliance_posture)
Current compliance status, one row per compliance standard plus an Overall Summary row
(id = summary) carrying the tenant-wide totals. Columns: id, name, cloud_type,
compliance_standard, total_resources, failed_resources, passed_resources,
assigned_policies, critical_failed, high_failed, medium_failed, low_failed. Filters:
Cloud Type, Compliance Standard. Exclude the summary row with a Filter data by values
transformation on id = summary when charting per-standard values.
Compliance Trend (compliance_trend)
The same posture counts across the dashboard time range. Columns: time, cloud_type,
compliance_standard, total_resources, failed_resources, passed_resources,
critical_failed, high_failed, medium_failed, low_failed. Filters: Cloud Type, Compliance
Standard.
cloud_type and compliance_standard on both compliance query types echo the query's own filter
selections (empty string = "all") — the responses carry no per-row breakdown of either dimension of
their own. (The one exception is compliance_standard on a posture detail row, which is that
row's own standard name, a real per-row value.) Both endpoints also require a filtered dimension to be named in the request's fields
array before the filter is evaluated at all, so the plugin always sends
fields: ["cloud.type", "policy.complianceStandard"] whether or not either filter is set. This is
invisible in the query editor and needs no configuration.
Asset Explorer / Resource Scan (asset_explorer)
Individual cloud assets with their alert, vulnerability and policy-scan status. Columns: id,
name, rrn, unified_asset_id, cloud_type, account_id, account_name, region_id,
region_name, asset_type, app_names, overall_passed, alert_critical, alert_high,
alert_medium, alert_low, alert_informational, vuln_critical, vuln_high, vuln_medium,
vuln_low, scanned_policies_total, scanned_policies_failed, resource_config_available,
resource_details_available. Filters: Cloud Type, Asset Type.
app_names is a comma-joined list. scanned_policies_total / scanned_policies_failed summarize
the response's scannedPolicies array; individual policy ids and names are not broken out into
columns. Compliance Standard is deliberately not offered for this query type.
Vulnerability Burndown (vuln_burndown)
Total and remediated vulnerability counts per day over the vendor-fixed trailing 30 days. Columns:
time, day_number, total_count, remediated_count. Filters: Severity, Asset Types, Life Cycle.
Prioritized Vulnerabilities (vuln_prioritized)
One row per prioritisation category (urgent, exploitable, patchable, packageInUse,
internetExposed). Columns: category, cve_count, asset_count, vulnerability_count,
last_updated, total_vulnerabilities. last_updated and total_vulnerabilities are
response-level values repeated on every row. Filters: Severity, Asset Types, Life Cycle,
Account IDs.
CVE Overview (cve_overview)
One row describing a single CVE. Columns: cve_id, severity, cvss, first_seen, last_seen,
patchable, exploitable, attack_vector, epss_probability, impacted_assets_count,
impacted_assets_runtime_count. Requires CVE ID. No other filters are offered.
Vulnerable Assets by CVE (vuln_assets)
The asset breakdown for one CVE, by lifecycle stage and cloud provider. Columns: stage,
asset_type, total_assets, total_vulnerabilities, provider, repositories, registries,
packages, assets, users, cloud_accounts, critical_count, high_count, medium_count,
low_count. Requires CVE ID. Filters: Severity, Asset Types, Life Cycle. Account IDs is
deliberately not offered here.
Code-to-Cloud Deploy Trend (c2c_deploy_trend)
Critical + high severity open deployment vulnerabilities per day over the vendor-fixed trailing 30
days, across Container Registry, ECR, Azure Registry, Google Container Registry and Google Artifact
images. Columns: time, vulnerabilities. The response is a flat {timestamp, vulnerabilities}
pair per day; it is not broken down by severity or image type. No filters.
Code-to-Cloud Runtime Trend (c2c_runtime_trend)
Critical + high severity open alerts per day over the same fixed 30-day window, across Policy
Category and Attack Path policies. Columns: time, alerts. No filters.
Licensing & Usage (licensing)
Licensed resource consumption over the query's own relative window. Columns: time, one numeric
column per key of the response's counts map (the licensed resource type, lower-cased with spaces
replaced by underscores, e.g. compute_workload, container_image, serverless_function), and
workloads_purchased. Requires Account IDs — the API declares
accountIds a required field. Until it is set the query is not sent at all and the panel shows no
data; running it explicitly reports which field is missing. Filters:
Cloud Type, Time Amount, Time Unit.
Included Dashboards
Four dashboards are bundled under src/dashboards/ and provisioned with the plugin. Each groups
its panels under row headers starting with an overview KPI row.
Panels that need one of the two frames asset_inventory returns, or that exclude the compliance
summary row, do so with transformations; the dashboards are generated and their field wiring is
verified against the backend on every build (see the developer guide).
| Dashboard | UID | Description | Variables |
|---|---|---|---|
| Prisma Cloud CSPM Overview | prismacspm-overview |
Cloud estate, asset inventory posture, and current alert volume. Defaults to the last 24 hours. | (datasource only) |
| Prisma Cloud CSPM Alerts & Audit Logs | prismacspm-alerts |
Alert triage — severity, status, provider and top triggering policies — plus the administrative audit trail. Every panel follows the time picker. Defaults to the last 24 hours. | (datasource only) |
| Prisma Cloud CSPM Compliance & Vulnerabilities | prismacspm-compliance |
Compliance posture per standard, its trend over the selected range, and vulnerability prioritisation and burndown. Defaults to the last 30 days. | (datasource only) |
| Prisma Cloud CSPM Security Trends & Licensing | prismacspm-security-trends |
Code-to-cloud deploy and runtime trends, per-CVE drill-down, and licensing consumption. Defaults to the last 30 days. | cveId (defaults to CVE-2024-1000), accountIds (defaults to aws-account-001) |
Both variables default to values the bundled mock server serves (CVE-2024-1000 and
aws-account-001), so the dashboard renders data out of the box against the mock.
Against a real tenant, set the dashboard's Account IDs variable to a comma-separated list of
your own cloud account IDs, and CVE ID to a CVE of interest. accountIds is a required field on
the licensing endpoint, so the Licensing panels report an error if it is left empty. That is the
API's requirement, not a plugin limitation.
Limitations and Recommendations
- Time ranges: only Alerts, Audit Logs and Compliance Trend accept the dashboard time range — see the Time ranges table. Everything else is a snapshot, a vendor-fixed 30-day window, or (Licensing) carries its own relative controls. The query editor states which applies.
- No row caps: every page of every paginated endpoint is fetched to completion. Large tenants with broad filters can therefore return large result sets — narrow the time range or add filters rather than relying on a truncation that no longer exists. Pagination stops on an absent token, an empty page, or a token the API fails to advance.
- Alert severity:
criticalandinformationalare legal filter inputs that no alert can carry, so they are not offered for the Alerts query type. Use the vulnerability query types for critical-severity data. - Compliance filters need
fields: a compliance filter is only evaluated when its dimension is also named in the request'sfieldsarray, so the plugin always requests bothcloud.typeandpolicy.complianceStandard. No configuration is needed; the behaviour is noted here because it explains why an unset filter still influences the shape of the response. - CVE Overview and Vulnerable Assets need a CVE ID: both endpoints describe exactly one CVE and fail without one. They are not browse endpoints.
- Access Key rotation is manual: the session token refreshes itself, the Access Key does not. Rotate it in the console before it expires and update the datasource configuration.
- Rate limits: Prisma Cloud applies per-tenant API rate limits. Use an auto-refresh interval of ≥ 30 s on dashboards with many panels; the plugin retries a 429 with backoff, but a dashboard that refreshes aggressively will still be throttled.
Demonstration Video
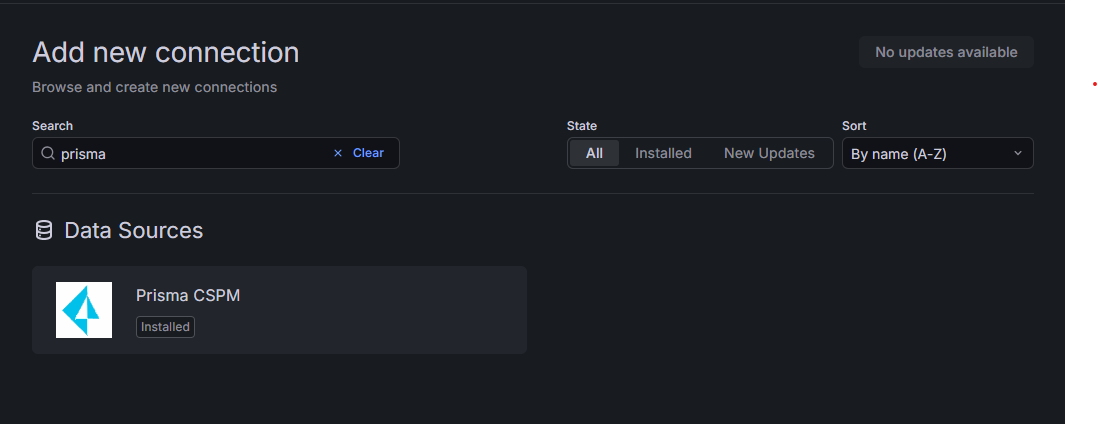
Please find attached a demo video showcasing how to use the Prisma CSPM integration.
Support
For issues, questions, or feature requests, please reach out to grafanalabs.integrations@crestdata.ai
Authors and Acknowledgment
Built by Crest Data.
License
See LICENSE file.
References
Grafana Cloud
Connect any plugin in Grafana Cloud.
- 150+ data source integrations
- Grafana Assistant - AI that correlates your data, builds queries, and answers questions
- 10k Prometheus metrics + 50 GB logs, traces, and profiles on the free tier
- ...and more
Insights
- Activity
Last updated 13 Oct 2026.
1 release in the past year.
- Queries
0 total queries served across all Grafana Cloud instances.
- Version
- 1.0.0
- Dependencies
- Grafana >=13.1.0
- Developer
- crestdata
Grafana Cloud
Connect any plugin in Grafana Cloud.
- 150+ data source integrations
- Grafana Assistant - AI that correlates your data, builds queries, and answers questions
- 10k Prometheus metrics + 50 GB logs, traces, and profiles on the free tier
- ...and more