
Prisma Cloud Compute Data Source for Grafana
A Grafana data source plugin that brings Prisma Cloud Compute (CWPP) telemetry — workload inventory, Defender fleet health, vulnerability and compliance statistics, runtime and application firewall security signal, and the platform audit trails — into Grafana dashboards, Explore and alerting.
Description
Prisma Cloud Compute, formerly Twistlock, is the Cloud Workload Protection half of Palo Alto Networks' Prisma Cloud. It scans hosts, container images, registries, running containers and serverless functions, runs runtime and network policy on those workloads through its Defenders, and records every admission, Kubernetes and Console-management event.
This is the Compute (CWPP) plugin, not the CSPM one. Prisma Cloud Compute is a separate product surface from Prisma Cloud CSPM: a different host (your own Console address rather than
api.prismacloud.io), a different credential exchange and a different API. If you are looking for cloud security posture alerts, asset inventory and compliance posture from the CSPM side, use the Prisma CSPM data source instead.
Features
- 23 query types covering workload inventory, aggregate statistics and every audit and event family the Console exposes.
- Defender fleet health — connectivity, version drift, certificate expiry, old-CA usage and host resource facts, so gaps in coverage are visible before they cost you telemetry.
- Vulnerability and compliance statistics in a tidy shape that pivots straight into bar charts and stat panels, plus the Console's own pre-aggregated daily compliance trend.
- Runtime security signal — container, host and serverless policy violations, correlated incidents, and MITRE technique labels.
- Application firewall (WAAS) events with OWASP Top 10 and OWASP API Top 10 classification, attack field detail and source country.
- Built and validated against API v34.04 — every API path is fixed to this version; there is no runtime discovery and no version selection in the datasource settings.
- Log-shaped frames for every audit family, so the Logs panel and Explore's log view work out of the box.
- Three bundled dashboards covering posture, runtime security and asset inventory.
Compatibility
| Item | Supported |
|---|---|
| Grafana | 13.1.0 and later |
| Prisma Cloud Compute Console | SaaS and self-hosted; built and validated against API v34.04. The plugin is not tested against, and does not adapt to, other API versions. |
| Authentication | Console username and password, or a Prisma Cloud Access Key ID and Secret Key |
| Deployment | Read-only — the plugin issues no write operation of any kind |
Demonstration Video
Please find attached a demo video showcasing how to use the Prisma Compute integration.
Installation
Requirements
- A Prisma Cloud Compute Console reachable from the Grafana server. Self-hosted Consoles listen on port 8083 by default, so Grafana needs network egress to it.
- A Console username and password. On a SaaS tenant these are a Prisma Cloud Access Key ID and Secret Key — the same credential exchange accepts both, so the plugin needs exactly one credential pair either way. Both values are case-sensitive.
- The Auditor role, which is Palo Alto Networks' documented read-only role ("read-only access to all Prisma Cloud data, settings, and logs"). Narrower roles are not sufficient:
DevSecOps User, for example, cannot read Defenders, licensing or the Console management trail, and the health check itself reads licensing.
Obtain Credentials
SaaS tenant (Access Key) — the common case
Log in to the Prisma Cloud console.
Go to Settings > Access Control > Access Keys.
Select Add, name the key and optionally give it an expiry.
Copy the Access Key ID and the Secret Key. The Secret Key is shown only once — capture it immediately.
Make sure the key's role has read access to Compute — Auditor, or equivalent.
Get the Console address from the Console UI. Its location depends on the UI generation, so check both:
- Compute > Manage > System > Downloads → Path to Console, or
- Runtime Security > Manage > System > Utilities → Path to Console.
Copy it including the tenant path segment (
https://<region>.cloud.twistlock.com/<tenant-id>) and without any/api/...suffix.
Self-hosted Console (local user)
- Log in to the Compute Console as an administrator.
- Go to Manage > Authentication > Users.
- Create a user with the Auditor role.
- Record the username, password, and the Console URL and port (
https://<host>:8083by default). - If the Console still uses its default self-signed certificate, plan to enable Skip TLS Verify, or, to keep verification on, obtain the CA certificate that signed it and set the CA Certificate field instead.
Install the Plugin
Install from the Grafana plugin catalog, or with the Grafana CLI:
grafana-cli plugins install crestdata-prismacompute-datasource
On Grafana Cloud, install the plugin from the Administration → Plugins page of your stack. Your Console must be reachable from Grafana Cloud over the public internet.
After installing, restart the Grafana server, then add the data source from Connections → Data sources → Add new data source.
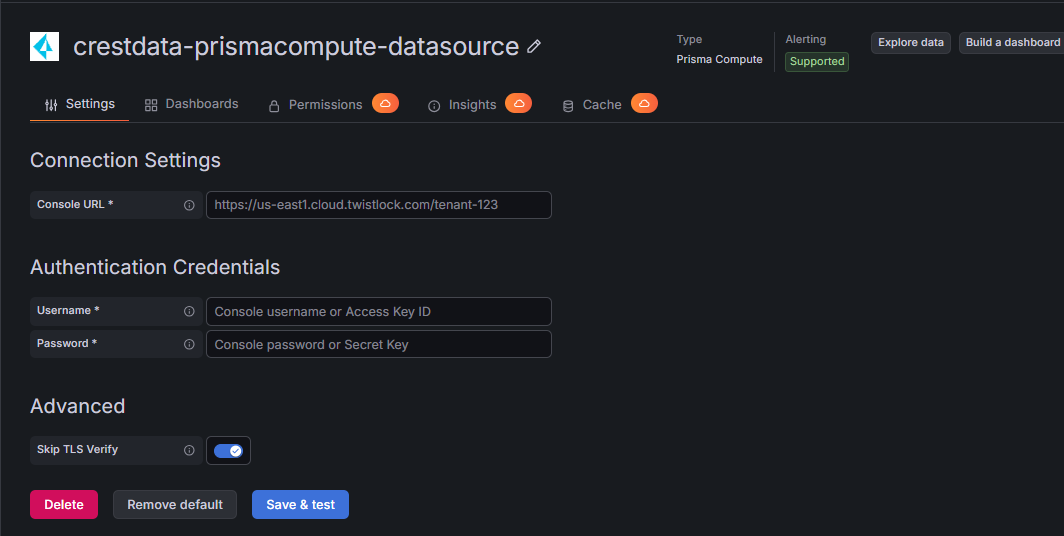
Configure the Data Source
| Field | Type | Required | Description |
|---|---|---|---|
| Console URL | String | Yes | The Console address copied from Path to Console, including any tenant path segment on SaaS and the port on a self-hosted Console. No /api suffix. Every API path is appended to this URL's existing path, so the tenant segment must not be stripped. |
| Username | String | Yes | Console username, or the Prisma Cloud Access Key ID on a SaaS tenant. Case-sensitive. |
| Password | Secure string | Yes | Console password, or the Secret Key on a SaaS tenant. Case-sensitive, stored encrypted and never returned to the browser. |
| Skip TLS Verify | Boolean | No | Enable only when the Console presents a self-signed certificate, which is how a freshly installed self-hosted Console ships. Not needed for SaaS. Off by default. |
| CA Certificate | String | No | A PEM-encoded certificate authority bundle used to verify the Console's TLS certificate, for a self-hosted Console signed by a private or internal CA. Only shown, and only applied, while Skip TLS Verify is off. |
This integration is built and validated against Prisma Cloud Compute API v34.04; the API version is fixed and is not configurable from the datasource settings.
Select Save & test. A successful check shows Successfully connected to Prisma Cloud Compute.
A sparse dashboard is usually a permissions scope, not a bug. On a SaaS tenant a read-only Compute user sees data only for the cloud accounts granted to them in the CSPM interface. Only credentials in a System Admin permission group see data from every Defender.
Usage
Query Editor
Pick a Category first, then the specific Query Type within it; the rest of the form adapts to what that endpoint actually accepts. Filters are applied by the Console, not in Grafana, and every filter is optional.
| Control | Applies to | Notes |
|---|---|---|
| Category | Every query | Groups the 23 query types into Compute Assets, Aggregate Assets, Platform Audits and Security Events. Selecting a category picks its first query type and clears filters the previous query type does not share. |
| Query Type | Every query | The specific endpoint to read, scoped to the selected Category. |
| Cluster / Clusters | Most asset and audit types | Comma-separated. The label mirrors how the Console spells the parameter on that endpoint. |
| Hostname | Most asset and audit types | Comma-separated, except on Defenders where the Console accepts a single value. |
| Namespace / Namespaces | Container, admission, runtime and WAAS types | Comma-separated. |
| Effect | Runtime audits (multiple) and WAAS events (single) | The Console accepts several effects on runtime endpoints and exactly one on application firewall endpoints, which is why the control differs. |
| Audit Type | Management Audits | A multi-select dropdown of the Console's fixed shared.MgmtType enum (login, profile, settings, rule, user, group, credential, tag, role, pairing). Leave empty for all types. |
| Attack Technique | Runtime Audits — Container / Host / Serverless | A multi-select dropdown of the Console's fixed mitre.Technique enum (credentialDumping, webShell, privilegedContainer, and so on — 46 values). Leave empty for all techniques. |
| Defender Type | Defenders | A multi-select dropdown of the Console's fixed defender.Type enum (docker, daemonset, cri, fargate, ecs, and so on), rather than free text. Leave empty for all types. |
| Incident Type | Incidents | A multi-select dropdown of the Console's fixed shared.IncidentType enum (host, container, function, appEmbedded, fargate), rather than free text. Leave empty for all types. |
| Category | Incidents | A multi-select dropdown of the Console's fixed shared.IncidentCategory enum (portScanning, cryptoMiner, malware, and so on — 16 values). Leave empty for all categories. |
| Resource Type | Vulnerability Stats | Dropdown, matching the Console's documented enum. |
| Severity Threshold | Vulnerability Stats | Free text, e.g. low, medium, high, critical. The API does not document a fixed set of values for this filter, so it is a text box rather than a dropdown. Leave empty to include every finding. |
| Policy Type, Compliance Template | Compliance Stats |
There is no page-size, row-limit or timeout control: the plugin pages every query to exhaustion at the Console's documented maximum page size, and the request timeout is fixed. Hosts, Images and Registry Images always request the full (non-compact) record, so the vulnerability and compliance detail behind the severity and risk-score columns is never dropped; this is not a query option.
Time ranges
Thirteen of the twenty-three query types filter server-side on the dashboard time range. The other ten return current state and accept no time parameter at all — the panel time picker has no effect on them, and every such frame carries an explanatory notice so an empty or unchanging panel is not mistaken for a fault.
| Behaviour | Query types |
|---|---|
| Honours the dashboard time range | incidents, runtime_audits_container, runtime_audits_host, runtime_audits_serverless, waas_agentless, waas_container, waas_host, waas_serverless, cnns_container, cnns_host, kubernetes_audits, admission_audits, mgmt_audits |
| Current state, time picker ignored | hosts, images, registry_images, containers, serverless_scans, defenders, host_profiles, vulnerability_stats, compliance_stats, license |
Runtime and application firewall audits are events only
Every security-signal query type — Incidents, Runtime Audits, WAAS Events, CNNS Audits, and every platform audit — reads every matching record, with full detail: message, attack type, rule, user, command, request fields. There is no bucketed/counted alternative; the plugin does not call the Console's /timeslice sibling endpoints.
Runtime audit records are aggregated server-side per attack type, so each record carries a
count. Panels should sumcount, not count rows, or they will under-report. The bundled dashboards do this.
Available Query Types
Compute Assets
- Hosts (
hosts) — host scan results: vulnerability and compliance distributions, risk scores, OS and cloud metadata, scan freshness and scan errors. Filters: Clusters, Hostname. Current state. - Images (
images) — deployed container image scan results, same shape as Hosts plus repository and tag. Filters: Clusters, Hostname. Current state. - Registry Images (
registry_images) — registry image scan results, plus the registry tags. Current state. - Containers (
containers) — running containers with compliance results, orchestration metadata and the application firewall coverage flags. Filters: Clusters, Hostname, Namespaces. Current state. - Serverless Scans (
serverless_scans) — serverless function scan results, runtime version and whether a Defender layer protects the function. Current state. - Defenders (
defenders) — the deployed Defender fleet: connectivity, type, category, version compatibility, certificate expiry, old-CA usage and host resource facts. Filters: Cluster, Hostname (single value), Defender Type. Current state. - Host Profiles (
host_profiles) — learned host runtime models, with application and SSH-event counts. No filters: the Console reports neither a cluster nor a namespace field on this endpoint, so those filters were removed rather than kept unverifiable. Current state.
Aggregate Stats
- Vulnerability Stats (
vulnerability_stats) — CVE and impacted-resource counts, emitted as one row per resource type and severity so it pivots directly into charts. Filters: Resource Type, Severity Threshold. Current state. - Compliance Stats (
compliance_stats) — five frames from one request:compliance_categories,compliance_templates,compliance_rules,compliance_checksandcompliance_daily. The first four carry failed/total counts (and a derived pass rate for categories and templates);compliance_dailyis the Console's own pre-aggregated daily trend, keyed by the Console's own row id (daily[]._id) shown as-is — the API declares it as a bare string with no format, so it is not parsed as a date. The Result option returns one of these as a single table (Checks, Rules, Categories, Templates or Daily Trend). New queries, and saved queries with no Result set, return Checks. Filters: Policy Type, Compliance Template. Current state. - License (
license) — two frames:licensewith the tier, contract, credits and expiry, andlicense_defenderswith the licensed Defender count per category. Current state.
Security Signal
- Incidents (
incidents) — correlated groups of runtime audits, with category, type, acknowledgement state and the number of constituent audits. Filters: Cluster, Hostname, Incident Type, Category. - Runtime Audits — Container / Host / Serverless (
runtime_audits_container,runtime_audits_host,runtime_audits_serverless) — runtime policy violations as log records, with severity, effect, attack type, MITRE techniques, process and network detail. The serverless endpoint does not accept cluster, hostname or namespace filters at all. All three filter by Attack Technique. - WAAS Events — Agentless / Container / Host / Serverless (
waas_agentless,waas_container,waas_host,waas_serverless) — application firewall events as log records, with attack type, effect, protection layer, OWASP classification, request detail and source country. Agentless protection is separately licensed. - CNNS Audits — Container / Host (
cnns_container,cnns_host) — network firewall audit events as log records. The Console nests these under a per-profile audit-subtype map; the plugin flattens that nesting to one row per individual audit event (src/dst container or hostname, port, block, rule), discarding the profile wrapper.
Platform Audits
- Kubernetes Audits (
kubernetes_audits) — Kubernetes API server activity, with verb, resource, user and the raw event payload. Filter: Cluster. - Admission Audits (
admission_audits) — admission controller decisions, with effect, operation, kind, namespace and the rule that fired. Filters: Cluster, Namespace. - Management Audits (
mgmt_audits) — the Console change-control trail: who changed what, with the old-to-new value difference. Filter: Audit Type (fixedshared.MgmtTypeenum, multi-select).
Resources Reference
| Query type | Frame type | Time field | Key columns |
|---|---|---|---|
hosts, images, registry_images |
Table | scan_time |
vulns_critical/high/medium/low, vuln_risk_score, compliance_issues, cloud_*, scan_error |
containers |
Table | scan_time |
image, namespace, cluster, waas_supported, waas_enabled |
serverless_scans |
Table | scan_time |
function_name, runtime, defended, vulns_critical |
defenders |
Table | last_status_change |
connected, defender_type, category, version_compatible, cert_expiry |
host_profiles |
Table | time |
hostname, app_count, ssh_event_count, apps |
vulnerability_stats |
Table (one row per resource type and severity) | time |
resource_type, severity, cve_count, impacted_count |
compliance_stats |
4 tables + 1 bar chart | — | category, template, rule_name, check_id, failed, total, pass_rate, date (daily frame, opaque string, not a parsed time) |
license |
2 tables | expiration_date |
license_tier, credits, defender_category, licensed_count |
incidents |
Table | time |
category, incident_type, acknowledged, audit_count |
runtime_audits_* |
Logs | time |
severity, effect, attack_type, count, rule_name |
waas_* |
Logs | time |
attack_type, effect, protection, status_code, country, owasp_top10 |
cnns_container, cnns_host |
Logs | time |
one row per individual audit event: src/dst container or hostname, dst_port, block, rule_id |
kubernetes_audits, admission_audits, mgmt_audits |
Logs | time |
audit-family specific |
Included Dashboards
Three dashboards ship with the plugin and are provisioned automatically. All three use a Data Source variable, so they work against any configured Prisma Compute data source.
Prisma Compute Posture Overview
Defender fleet coverage (connected, disconnected, version drift, old CA, certificate expiry), vulnerability and compliance posture, the Console's pre-aggregated daily compliance trend, open incidents and licensing. Variables: Cluster, Resource Type, Compliance Template.
Recommended refresh: 5 minutes or longer.
Prisma Compute Runtime Security
Runtime policy violations for containers, hosts and serverless, application firewall events with OWASP and geography breakdowns, container network firewall hotspots, and the Kubernetes, admission and Console change trails. Every panel here honours the dashboard time range and reads events directly. Variables: Cluster, Namespace, Runtime Effect, Application Firewall Effect.
Recommended refresh: 1 minute or longer.
Prisma Compute Asset Inventory
Inventory totals, host risk and scan freshness, registry and image severity breakdowns, container and function distribution, the application firewall coverage gap, undefended functions, learned host profiles and the failing compliance checks. Variables: Cluster, Hostname, Namespace.
Recommended refresh: 15 minutes or longer — these are the rate-limited endpoints.
Limitations and Recommendations
| Limitation | Detail |
|---|---|
| Ten query types ignore the time picker | Asset and statistics queries return current state; the Console exposes no time parameter for them. Each frame carries a notice saying so. |
| Five endpoints are rate limited | Hosts, images, registry images, containers and serverless scans allow 30 requests per 30 seconds per Console, shared with every other client — your own scripts, other Grafana instances and the Console UI itself. The plugin runs queries one at a time and paces successive pages on those endpoints, but it cannot rescue an over-aggressive dashboard refresh. Use 15 minutes or longer on inventory dashboards. |
| Long ranges over high-volume audit and event types are expensive | Page size is the vendor's documented maximum of 250 records and the plugin pages every query to exhaustion — there is no bucketed/counted alternative, so a busy tenant over a long range on Runtime Audits or WAAS Events can page through very large result sets. Keep these ranges short to moderate. Hosts, Images and Registry Images always request the full record, so this cost cannot be reduced by a compact scan — the vulnerability and compliance detail behind the severity and risk-score columns is never dropped. |
| No total count before paging completes | The Console returns no count headers, so a progress or "N of M" display is not possible. |
| Offset paging is not snapshot-isolated | If the underlying data changes mid-query, rows can be skipped or duplicated. |
| No server-side collection filtering | Every query type that reports collections emits a collections column instead; filter on it in Grafana. |
| CNNS row count is not the profile count | cnns_container and cnns_host return one row per individual audit event, flattened out of the Console's per-profile audit-subtype map — a busy profile contributes many rows, not one. |
| No per-CVE rows | No query type emits one row per CVE: the scan frames carry per-severity distributions and risk scores, and vulnerability statistics are reported per severity rather than per CVE. |
| Agentless WAAS may be unlicensed | waas_agentless depends on a separately licensed feature and returns nothing on a tenant without it. |
| Multi-project self-hosted Consoles | Configure one data source instance per project Console address. |
| Read-only | The plugin issues GET requests only. The one exception is the credential exchange, which mints a session token. Acknowledging incidents and downloading exports are out of scope. |
Recommended dashboard time ranges
| Use case | Range | Notes |
|---|---|---|
| Live monitoring | 15 minutes – 1 hour | Comfortable on every tenant. |
| Short investigation | 6 – 24 hours | Comfortable here on most tenants. |
| Historical review | 7 – 30 days | Can page through large result sets on a busy tenant; narrow the filters (cluster, hostname, effect, type) to keep it fast. |
| Compliance reporting | 30 – 90 days | Prefer the compliance_daily frame, which the Console pre-aggregates. |
Support
For questions, bug reports and feature requests, contact grafanalabs.integrations@crestdata.ai.
Authors and Acknowledgment
Developed and maintained by Crest Data Systems.
License
See the LICENSE file distributed with this plugin.
References
Grafana Cloud
Connect any plugin in Grafana Cloud.
- 150+ data source integrations
- Grafana Assistant - AI that correlates your data, builds queries, and answers questions
- 10k Prometheus metrics + 50 GB logs, traces, and profiles on the free tier
- ...and more
Insights
- Adoption
Running on 6 active Grafana instances.
- Activity
Last updated 9 Oct 2026.
1 release in the past year.
- Queries
0 total queries served across all Grafana Cloud instances.
- Version
- 1.0.0
- Dependencies
- Grafana >=13.1.0
- Developer
- crestdata
Grafana Cloud
Connect any plugin in Grafana Cloud.
- 150+ data source integrations
- Grafana Assistant - AI that correlates your data, builds queries, and answers questions
- 10k Prometheus metrics + 50 GB logs, traces, and profiles on the free tier
- ...and more