
Infoblox Universal DDI Data Source for Grafana
The Infoblox Universal DDI data source plugin lets you query and visualize DNS, DHCP, and IPAM (DDI) data from Infoblox Universal DDI directly in Grafana. It is a backend plugin that connects to the Infoblox Universal DDI REST API using an API key.
Description
Monitor your entire DDI estate from Grafana: DHCP leases and server configuration, DNS records and zones, RPZ security rules, IPAM subnet utilization and IP address state, and the audit/configuration change log — all read-only, all server-side.
Features
- Twelve query types across four categories: DHCP, DNS, IPAM, and Audit Logs.
- Filter expression builder in the query editor — build
_filterexpressions field-by-field (equals, contains, comparison operators, AND/OR) instead of hand-writing the Infoblox filter syntax. - Optional time-range binding for DHCP Leases (
last_updated) and DNS Records (created_at) — off by default so current-state queries aren't silently emptied by the dashboard's time range; Audit Logs always bind tocreated_atsince it's a genuine time series. - Full pagination, following the DDI API's page-token/offset model — no row cap, so large result sets are returned in full.
- Curated dashboards bundled with the plugin, covering DHCP/DNS, IPAM, and Audit Logs.
- Secure by design: API key stored encrypted in
secureJsonData; only generic error messages surfaced to the UI.
Compatibility
| Component | Supported |
|---|---|
| Grafana | >= 12.3.0 |
| Infoblox Universal DDI API | REST API, token authentication |
| Authentication | API key (Authorization: Token <key>) |
Installation
Requirements
- A reachable Infoblox Universal DDI instance (e.g.
https://csp.infoblox.com), routable from the Grafana backend. - A valid Infoblox API key with read access to DDI resources (
dns,dhcp,ipamscopes) and the audit log.
Obtain Credentials
- Log in to the Infoblox Portal.
- Go to Administration → User API Keys and generate a new API key for the Grafana integration.
- Copy the key immediately — it is only shown once.
- Note your Infoblox Portal base URL for the Base URL field (e.g.
https://csp.infoblox.com).
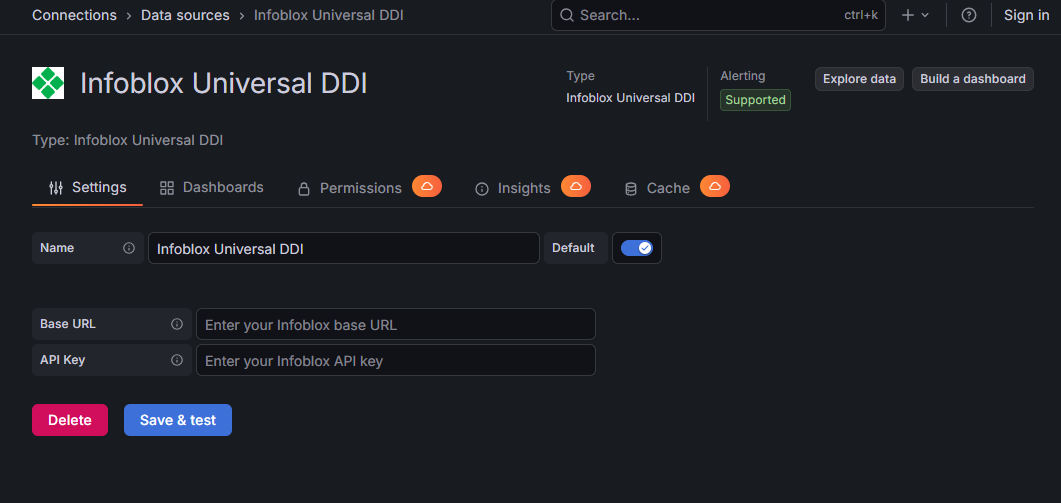
Configure the Data Source
| Field | Type | Required | Description |
|---|---|---|---|
| Base URL | string | Yes | The base URL of your Infoblox Universal DDI instance (e.g. https://csp.infoblox.com). https:// is added automatically if omitted. |
| API Key | secure string | Yes | Your Infoblox API key; stored encrypted server-side and sent as Authorization: Token <key> on every request. |
Click Save & Test after entering your credentials. The plugin calls GET /api/auditlog/v1/logs?_limit=1 to verify connectivity and authentication; a green checkmark confirms the connection is working.
Demonstration Video
Please find attached a demo video showcasing how to use the Infoblox UDDI integration.
Usage
Query Editor
| Field | Shown when | Description |
|---|---|---|
| Category | Always | Groups query types into DHCP / DNS / IPAM / Audit Logs. |
| Query Type | Always | Selects the DDI resource to query within the chosen category. |
Filter by last_updated / created_at |
dhcpLeases, dnsRecords |
Optional toggle to bound results to the dashboard time range on the relevant timestamp field. Off by default — these are current-state config objects, and a mandatory time bind would silently return zero rows for dashboard windows that don't overlap when the records were created. |
| Filters | Query types that support filtering (see Query Types below) — all except dhcpGlobal, which is a singleton with nothing to filter |
Build a _filter expression field-by-field: pick a field, an operator (==, !=, >, >=, <, <=, contains), and a value, chained with AND/OR. Timestamp fields (created_at, updated_at) show a date/time picker and offer only >, >=, <. |
Audit Logs always bind to created_at using the dashboard time range (no toggle) — it's a genuine time series, unlike the other query types.
Query Types
The plugin supports 12 query types, grouped into DHCP / DNS / IPAM / Audit Logs categories in the query editor.
DHCP
| Query Type | Endpoint | Fields | Filter example |
|---|---|---|---|
dhcpLeases — DHCP Leases |
/api/ddi/v1/dhcp/lease |
address, state, type, hostname, client_id, hardware, protocol, starts, ends, last_updated, fingerprint, fingerprint_processed, host, space, ha_group, iaid, preferred_lifetime |
state=="used", protocol=="ip4" (protocol only supports ==, not != or ~/!~) |
dhcpHost — DHCP Host |
/api/ddi/v1/dhcp/host |
id, name, address, type, comment, ophid (API/filter name for the on-prem host ID; displayed as on_prem_host_id), provider_id, current_version, ip_space, server, associated_server_id, associated_server_name, anycast_addresses |
type=="bloxone_ddi" (note the lowercase/underscored value — not "BloxOne DDI") |
dhcpFixedAddress — DHCP Fixed Address |
/api/ddi/v1/dhcp/fixed_address |
id, parent, match_type, match_value, address, name, comment, hostname, disable_dhcp, ip_space, inheritance_parent, header_option_*, compartment_id, created_at, updated_at |
match_type=="mac" |
dhcpServer — DHCP Server |
/api/ddi/v1/dhcp/server |
id, name, comment, profile_type, client_principal, server_principal, ddns_*, gss_tsig_fallback, header_option_*, hostname_rewrite_char (display-only, not filterable — see below), hostname_rewrite_enabled, hostname_rewrite_regex, created_at, updated_at |
profile_type=="server" |
dhcpGlobal — DHCP Global Config |
/api/ddi/v1/dhcp/global |
id, active_search_enable, client_principal, server_principal, ddns_*, gss_tsig_fallback, header_option_*, hostname_rewrite_*, include_domain_option12, prefer_option_12, remove_suffix_option_81 |
Not supported (singleton, one row) |
DNS
| Query Type | Endpoint | Fields | Filter example |
|---|---|---|---|
dnsRecords — DNS Records |
/api/ddi/v1/dns/record |
id, type, name_in_zone, absolute_name_spec, absolute_zone_name, zone, ttl, disabled, comment, compartment_id, delegation, dns_rdata, ipam_host, last_queried, source, subtype, created_at, updated_at, plus display-only view/view_name (not filterable — see below) |
type=="A", absolute_zone_name=="example.com." (zone takes an internal zone reference, not a domain string — use absolute_zone_name for a literal domain match) |
dnsRpzRules — DNS RPZ Rules |
/api/ddi/v1/dns/rpz_rule |
id, action, trigger, match_data, view, rpz, ttl, disabled, comment, created_at, updated_at |
match_data~"bad" |
dnsViews — DNS Views |
/api/ddi/v1/dns/view |
id, name, disabled, notify, comment, compartment_id, dnssec_enabled, dnssec_enable_validation, recursion_enabled, gss_tsig_enabled, created_at, updated_at |
— |
dnsAuthZones — DNS Authoritative Zones |
/api/ddi/v1/dns/auth_zone |
id, fqdn, view, mapping, disabled, notify, comment, compartment_id, dnssec_status, primary_type, gss_tsig_enabled, mapped_subnet, created_at, updated_at |
— |
IPAM
| Query Type | Endpoint | Fields | Filter example |
|---|---|---|---|
ipamSubnets — IPAM Subnets |
/api/ddi/v1/ipam/subnet |
id, name, address, cidr, protocol, space, dhcp_host, comment, parent, shared_network, usage, utilization_pct, used, total, threshold_*, created_at, updated_at (nested utilization/dhcp_utilization/threshold objects flattened; hostname_rewrite_char is display-only, not filterable — see below) |
cidr>=24 |
ipamAddresses — IPAM IP Addresses |
/api/ddi/v1/ipam/address |
id, address, state, protocol, hwaddr, parent, space, comment, host, interface, range, usage, dhcp_state, dhcp_client_hostname, dhcp_client_hwaddr, created_at, updated_at |
state=="used" |
Audit
| Query Type | Endpoint | Fields | Notes |
|---|---|---|---|
auditLogs — Audit & Configuration Change Logs |
/api/auditlog/v1/logs |
id, created_at, user_name, client_ip, action, result, resource_type, resource_id, resource_desc, http_method, http_url, http_code, message, app_id, request_id, session_id, session_type, subject_type, event_version, body (same content as message — body is the literal field name Grafana's Logs panel requires) |
Rendered as a Grafana Logs frame. Dashboard time range applies to created_at. |
Filter Expressions
Most query types accept a filter expression using the Infoblox DDI filter syntax:
- String equality:
field=="value" - String contains:
field~"value" - Numeric comparison:
field>=80 - Timestamp comparison:
created_at>'2026-01-16T17:17:00.000Z'(RFC3339 UTC, single-quoted) - Logical AND:
field1=="a" and field2=="b" - Logical OR:
field1=="a" or field2=="b"
Boolean fields (e.g. disabled) have no documented literal syntax in the DDI filter grammar and aren't exposed in the filter builder — filter on them client-side with a dashboard transformation instead (see the bundled "Disabled Records" panel for an example).
Timestamp fields (created_at, updated_at) are edited with a date/time picker rather than a free-text box, and offer only the ordering operators >, >=, and <. The picked instant is sent to the DDI API as an RFC3339 UTC string — the form the API compares against — so a human-formatted value like 2026-01-16 17:17:00 would never match. ==, !=, and <= are deliberately not offered: the API stores timestamps at sub-second precision, so == matches nothing, != matches everything, and <= silently drops records in the trailing fractional second of its bound. To match a single day, combine two conditions: created_at>='<day-start>' and created_at<'<next-day-start>'.
Not every field shown in a query type's "Fields" column above is filterable — some are display-only:
- Resource-reference/UUID fields (
id,view,zone,rpz,parent,space,host,ip_space,server,dhcp_host,shared_network,range,inheritance_parent) take an internal reference identifier, not a human-readable string — a literal value like a domain name or hostname will fail withInvalid identifieror a UUID-format error.absolute_zone_name/absolute_name_spec-style fields are the literal-string equivalents where available. view/view_nameondnsRecords, andhostname_rewrite_charondhcpServer/ipamSubnets, are excluded from the filter builder entirely — the live API rejects every operator this plugin offers (Operation EQ is not allowed for '<field>'), so there is no working filter syntax for them today. They're still returned as ordinary display columns.
Included Dashboards
Two dashboards are bundled under src/dashboards/ and provisioned with the plugin, each split into collapsible row sections by domain:
| Dashboard | Description |
|---|---|
| Infoblox DDI — DHCP & DNS Overview | DHCP row — active/abandoned lease counts, lease state distribution, and lease table. DNS row — record/RPZ rule counts, records by type, RPZ rules by action, view/zone tables, and full record/rule tables. |
| Infoblox DDI — IPAM Utilization & Audit Logs | IPAM row — subnet utilization heatmap, high-utilization alerts, IP address state distribution, usage breakdown, and individual address table. Audit Logs row — audit event stream, failed action alerts, events by user/resource/action, and configuration changes table. |
All bundled dashboards refresh at least every 5 minutes by default. After adding the data source, import dashboards from Dashboards → Browse → Infoblox Universal DDI folder.
Architecture
Frontend (React/TypeScript)          Backend (Go)
────────────────────────────         ──────────────────────────────────────
ConfigEditor.tsx                     datasource.go   — lifecycle, QueryData dispatch, CheckHealth
QueryEditor.tsx                      client.go       — DDIClient: REST calls, retry/backoff, pagination
FilterExprBuilder.tsx                handlers.go     — per-query-type routing
types.ts                             dataframe.go    — model → Grafana frame builders
                                      errors.go       — sanitized error mapping
                                      models/         — PluginSettings, query consts, DDI domain models
Key design decisions:
- Per-request retry with backoff:
doGETretries 429/5xx responses (honoringRetry-Afteron rate limiting) and fails fast on 4xx client errors. - Full pagination, no row cap:
listDDIfollows the DDI API's page-token/offset pagination until a short page signals the end, accumulating the complete result set. - Optional, not mandatory, time binding: only Audit Logs are unconditionally time-bound; DHCP Leases and DNS Records expose an opt-in toggle so current-state queries aren't silently emptied by the panel's time range.
Limitations and Recommendations
- No row caps: full result sets are returned. Large deployments with many DHCP leases, DNS records, or a wide audit-log time window produce large frames — narrow with filter expressions or a shorter time range.
- Boolean filtering: the DDI
_filtergrammar has no documented boolean literal syntax, so boolean fields (disabled, etc.) aren't filterable server-side — use a dashboard transformation (e.g.filterByValue) instead. - Rate limiting: the plugin honors
Retry-Afteron HTTP 429 and backs off on 5xx errors; very frequent auto-refresh on heavy dashboards can still be throttled by the API.
Support
For issues, questions, or feature requests, please reach out to grafanalabs.integrations@crestdata.ai
Authors and Acknowledgment
Developed by Crest Data.
License
This plugin is distributed under EULA License. See the LICENSE file for details.
References
Grafana Cloud
Connect any plugin in Grafana Cloud.
- 150+ data source integrations
- Grafana Assistant - AI that correlates your data, builds queries, and answers questions
- 10k Prometheus metrics + 50 GB logs, traces, and profiles on the free tier
- ...and more
Insights
- Adoption
Running on 6 active Grafana instances.
- Activity
Last updated 24 Sep 2026.
2 releases in the past year.
- Queries
0 total queries served across all Grafana Cloud instances.
- Version
- 1.0.1
- Dependencies
- Grafana >=12.3.0
- Developer
- crestdata
Grafana Cloud
Connect any plugin in Grafana Cloud.
- 150+ data source integrations
- Grafana Assistant - AI that correlates your data, builds queries, and answers questions
- 10k Prometheus metrics + 50 GB logs, traces, and profiles on the free tier
- ...and more