
Citrix Cloud Data Source Plugin for Grafana
Description
The Citrix Cloud DataSource Plugin is a Grafana backend datasource plugin that enables on-demand querying and visualization of Citrix Cloud platform data — security audit logs, administrators, Cloud Connector fleet health, licensing usage, and platform notifications — inside Grafana panels.
Citrix Cloud is the management plane for Citrix DaaS, Cloud Connectors, and related entitlements. The plugin connects directly to the Citrix Cloud REST APIs to retrieve real-time and historical data including system/audit logs, administrator accounts and access policies, Cloud Connector inventory/health/connectivity/maintenance, service entitlements, DaaS/CCD/NGS license usage, platform notifications, and resource locations.
Features
- Query and visualize Citrix Cloud platform data directly within Grafana
- Support for multiple data categories:
- Security Audit: System log events and administrator/access-policy details
- Cloud Connectors: Fleet inventory, per-connector CPU/memory/disk/network metrics, connectivity status, and maintenance windows/history
- Licensing: Service entitlements, DaaS User/Device usage (current, historical, users, devices), Concurrent (CCD) usage, active-use percentages, and NGS bandwidth usage/overage
- Notifications & Infrastructure: Platform alerts/notifications and the resource location inventory
- Time-series support for connector metrics and historical licensing usage
- Connector- and administrator-scoped filtering for detailed per-resource queries
- Built-in retry logic with exponential backoff for transient failures, plus automatic re-authentication on token expiry
- Automatic OAuth2 token management with the Citrix Cloud trust endpoint
Compatibility
| Component | Version / Detail |
|---|---|
| Grafana | >= 12.3.0 |
| Citrix Cloud API | System Log, Administrators, Connector Health, Licensing, Notifications, Resource Locations |
| Authentication | OAuth2 Client Credentials (CwsAuth Bearer= scheme) |
Demonstration Video
Please find attached a demo video showcasing how to use the Citrix Cloud integration.
Installation
Requirements
- Grafana >= 12.3.0
- A Citrix Cloud tenant with API access enabled
- A Citrix Cloud API Client (Customer ID, Client ID, and Client Secret)
- Network connectivity to the Citrix Cloud API host on port 443
Obtain Citrix Cloud Credentials
- Log in to the Citrix Cloud console as an administrator.
- Navigate to Identity and Access Management > API Access.
- Create a new API client and note the generated Client ID and Client Secret — the secret is shown only once.
- Note your Customer ID, shown in the Citrix Cloud console.
- Ensure the API client has permissions for the APIs you intend to query (System Log, Administrators, Connector Health, Licensing, Notifications).
Install the Plugin
Install the plugin from the Grafana Plugin Catalog or using the Grafana CLI:
grafana-cli plugins install crestdata-citrixcloud-datasource
After installation, restart the Grafana server for the plugin to be loaded.
Configure the Data Source
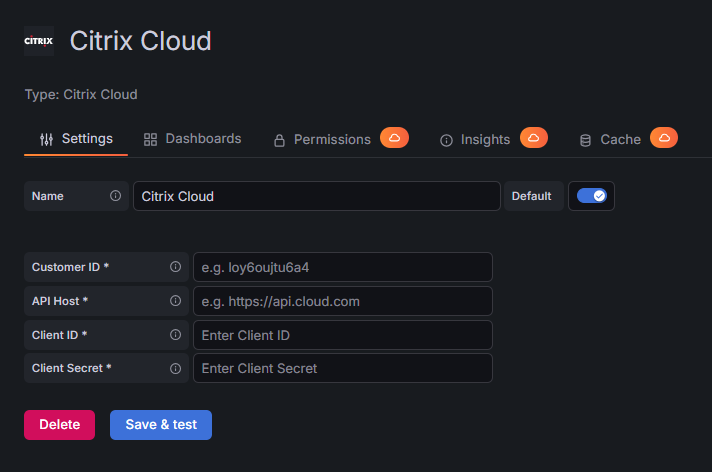
- In Grafana, navigate to Connections > Data Sources > Add data source.
- Search for Citrix Cloud and select it.
- Fill in the required configuration fields:
| Name | Type | Required | Description |
|---|---|---|---|
| Customer ID | String | Yes | Citrix Cloud Customer ID, sent as the Citrix-CustomerId header on every request. |
| API Host | String | Yes | Citrix Cloud API endpoint: https://api.cloud.com (US/EU) or https://api.citrixcloud.jp (Japan). |
| Client ID | Secure String | Yes | Citrix Cloud API Client ID used for the OAuth2 client-credentials grant. |
| Client Secret | Secure String | Yes | Citrix Cloud API Client Secret used for the OAuth2 client-credentials grant. |
- Click Save & Test. The health check will validate your credentials against the Citrix Cloud Resource Locations API.
Usage
Query Editor
Once the data source is configured, you can create panels using the query editor with the following parameters:
| Parameter | Type | Options | Default | Description |
|---|---|---|---|---|
| Category | Dropdown | Security Audit, Cloud Connectors, Licensing, Notifications & Infrastructure | Security Audit | Select the functional area to query |
| Query Type | Dropdown | Depends on category (21 total, see Resources Reference below) | — | Select the specific query within the chosen category |
| Connector | Dropdown | Populated from the live Connector inventory | — | Required for connector_metrics, connector_connectivity, connector_maintenance_history |
| Administrator ID | String | Free text | — | Required for administrator_access |
| Location | String | Free text (resource location ID) | All locations | Optional filter for connector_inventory, connector_maintenance |
| Data Aggregation | Dropdown | OneHour, SixHours, OneDay | OneHour | Aggregation for connector_metrics, connector_connectivity |
| License Model | Dropdown | Mixed, UserDevice, Concurrent | Mixed | Filter for license_active_use_current, license_active_use_monthly |
| View Type | Dropdown | MonthlyPeak, DailyPeak | — | Aggregation for license_ccd_historical |
| Severities | Multi-select | Critical, Error, Warning, Information | All | Filter for notifications |
| Priorities | Multi-select | Urgent, Important, Normal, Low | All | Filter for notifications |
| Notification State | Dropdown | Active, Dismissed, Resolved | All | Filter for notifications |
Available Query Categories
Security Audit
- System Logs: administrative changes and authentication events, filtered by the dashboard time range (up to Citrix Cloud's documented lookback)
- Administrators: the list of Citrix Cloud administrator accounts
- Administrator Access: access policies for one administrator, selected by Administrator ID
Cloud Connectors
- Connector Inventory: fleet-wide version, status, and last-contact details
- Connector Metrics: per-connector CPU, memory, disk, and network time series
- Connector Connectivity: per-connector provider connectivity status
- Connector Maintenance: maintenance window schedules for all (or one) resource location
- Connector Maintenance History: maintenance operation history for one connector
Licensing
- Service Entitlements: entitlement states, quantities, and expiry information
- DaaS UD Current / Historical / Users / Devices: User/Device license usage snapshots, trends, and per-user/per-device logon history
- CCD Summary / Historical: Concurrent license peak usage and usage trend
- Active Use Current / Monthly: active-use percentage snapshot and trend
- NGS Bandwidth Summary / Details / Overage: bandwidth usage by subscription type, per-record detail, and overage trend
Notifications & Infrastructure
- Notifications: platform alerts and notifications as a log stream, filterable by severity/priority/state
- Resource Locations: the complete resource location inventory
Time Series Handling
Connector metrics and several licensing endpoints support time-based queries:
- Connector Metrics / Connectivity: the number of days of history requested is derived from the dashboard time range (whole days, rounded up); if no time range is available, defaults to 7 days.
- License historical endpoints (
license_daas_ud_historical,license_ccd_historical,license_active_use_monthly,license_ngs_bandwidth_overage): the dashboard time range is passed through as the start/end date filter. - System Logs: uses the dashboard's exact
from/totime range. - Connector Maintenance History and Notifications fetch a fixed-size default result set from the API (no server-side date filter) and are then filtered against the dashboard time range client-side — a very wide time range will not retrieve more data than that default set.
- All other query types are point-in-time snapshots and ignore the dashboard time range.
Error Handling and Retry Strategy
Retries are performed only for transient failures:
- HTTP 429 (rate limited)
- HTTP 5xx responses (500–599)
- Network/connection-level errors
- Errors while reading the response body
Max retry attempts: 3, with exponential backoff (base delay: 3 seconds, i.e. 3s then 6s between attempts).
A single HTTP 401 triggers one forced OAuth2 token refresh and one retry of the original request; a 401 after that refresh is returned as an authentication failure and not retried further. Non-retryable: HTTP 4xx errors other than 401/429 (e.g., 403, 404) are returned immediately.
Resources Reference
| Query Type | Description | Supports Time Range |
|---|---|---|
| System Logs | System log audit events (administrative changes, authentication) | Yes |
| Administrators | List of Citrix Cloud administrator accounts | No |
| Administrator Access | Access policies for one administrator | No |
| Connector Inventory | Cloud Connector fleet inventory (version, status, last contact) | No |
| Connector Metrics | Per-connector CPU/memory/disk/network time series | Yes |
| Connector Connectivity | Per-connector provider connectivity status | Yes |
| Connector Maintenance | Maintenance window schedules | No |
| Connector Maintenance History | Maintenance operation history for one connector | Client-side only |
| Service Entitlements | Entitlement states, quantities, expiry | No |
| DaaS UD Current | Current DaaS User/Device license usage snapshot | No |
| DaaS UD Historical | Monthly DaaS User/Device license usage history | Yes |
| DaaS UD Users | Paginated list of licensed DaaS users with logon history | No |
| DaaS UD Devices | Paginated list of licensed DaaS devices with logon history | No |
| CCD Summary | Concurrent license peak usage (current/24h/month/all-time) | No |
| CCD Historical | Concurrent license usage trend (daily or monthly) | Yes |
| Active Use Current | Current active-use percentage (UD/Concurrent/Mixed) | No |
| Active Use Monthly | Monthly active-use percentage trend | Yes |
| NGS Bandwidth Summary | Bandwidth usage summary by subscription type | No |
| NGS Bandwidth Details | Detailed bandwidth usage records | No |
| NGS Bandwidth Overage | Bandwidth overage trend over time | Yes |
| Notifications | Platform alerts/notifications log stream | Client-side only |
| Resource Locations | Complete resource location inventory | No |
Included Dashboards
| Dashboard | Focus |
|---|---|
| Citrix Cloud: Security Audit | Administrator breakdowns by access type and provider type, the administrator list, per-administrator access policies, and the system log event stream |
| Citrix Cloud: Connector Fleet Monitoring | Fleet-wide totals, online/in-maintenance/version-drift counts, status and version-state breakdowns, version distribution, per-connector connectivity, and CPU/memory/disk/network utilization |
| Citrix Cloud: License & Service Entitlement | Service entitlements with expiring/expired counts, DaaS User/Device current and historical usage, licensed users/devices, CCD peak and historical usage, active-use current/monthly trends, and NGS bandwidth summary/details/overage |
| Citrix Cloud: Platform Alerts & Notifications | Notification stream filterable by severity/priority/state, severity and priority breakdowns, notifications by component, and the resource location inventory |
Most stat, pie chart, and bar chart panels in these dashboards reuse another panel's already-fetched data via Grafana's Dashboard data source and transformations, rather than issuing their own query to ruduce api calling — so a source panel's query failure or an unset dashboard variable (Connector, Location, Administrator ID all default to blank) can blanks out every panel derived from it.
Limitations and Recommendations
API Considerations:
- The plugin uses Citrix Cloud's OAuth2 client-credentials grant with the non-standard
CwsAuth Bearer=authorization scheme; the token is cached and automatically refreshed before expiry. Connector Maintenance HistoryandNotificationshave no server-side date filter — the API's default result set is fetched once and then filtered client-side against the dashboard time range.- List-returning query types are paginated to completion server-side (continuation-token or offset pagination); there is no row cap other than the query's context/timeout.
Performance tips:
- Licensing endpoints require specific Citrix entitlements — confirm your subscription includes the licensing product you are querying (DaaS, CCD, or NGS Bandwidth) if a query returns no data.
- Narrow the dashboard time range for
Connector Metrics/Connector Connectivityon large connector fleets to reduce query latency. - Use the dedicated
Administrator Accessquery (with an Administrator ID) rather than expectingAdministratorsto include access details — they are separate query types.
Support
For issues, questions, or feature requests, please reach out to grafanalabs.integrations@crestdata.ai
Authors and Acknowledgment
Developed by Crest Data.
License
This plugin is distributed under EULA License. See the LICENSE file for details.
References
Grafana Cloud
Connect any plugin in Grafana Cloud.
- 150+ data source integrations
- Grafana Assistant - AI that correlates your data, builds queries, and answers questions
- 10k Prometheus metrics + 50 GB logs, traces, and profiles on the free tier
- ...and more
Insights
- Adoption
Running on 6 active Grafana instances.
- Activity
Last updated 24 Sep 2026.
2 releases in the past year.
- Queries
0 total queries served across all Grafana Cloud instances.
- Version
- 1.0.2
- Dependencies
- Grafana >=12.3.0
- Developer
- crestdata
Grafana Cloud
Connect any plugin in Grafana Cloud.
- 150+ data source integrations
- Grafana Assistant - AI that correlates your data, builds queries, and answers questions
- 10k Prometheus metrics + 50 GB logs, traces, and profiles on the free tier
- ...and more