
Cisco ASA Data Source Plugin for Grafana
Description
The Cisco ASA DataSource Plugin is a Grafana backend datasource plugin that enables on-demand querying and visualization of Cisco ASA firewall health, traffic, and security telemetry inside Grafana panels.
Cisco ASA (Adaptive Security Appliance) is Cisco's stateful firewall and VPN platform, available as physical appliances and as the virtual ASAv. The plugin connects to the appliance's built-in HTTP(S) management (ASDM) exec interface — GET /admin/exec/<url-encoded command> — runs read-only show commands, parses the raw CLI text the device returns, and turns it into typed Grafana data frames covering CPU and memory, resource limits, connections and NAT, interfaces and routing, access lists, security-path drops, threat detection, and identity firewall data.
Features
- Query and visualize ASA telemetry directly within Grafana — no agent, no NetFlow collector, no SNMP
- 44 read-only
showcommands across three data categories:- System Health: per-core CPU, memory, perfmon rates, resource limits vs usage, flash, processes, heap integrity, cluster CPU/memory/resources
- Network & Connectivity: active connections, NAT rules and translations, interfaces, ARP and MAC tables, DNS cache, route summary, EIGRP, NetFlow export, IPsec, LISP
- Security & Threat: access-list compilation, security-path (ASP) drops and rule engine, uRPF drops, protocol counters, per-host flows, threat detection, Botnet Traffic Filter reports, logging queue, authenticated users, identity firewall, SSH and management sessions, AAA servers
- Purpose-built parser per command, each turning fixed-width or tab-separated CLI output into a typed frame
- Five bundled dashboards covering system health, connections/NAT/sessions, interfaces/routing/services, security, and threat/identity
- Read-only command allowlist — the CLI verb always comes from the plugin's registry, never from user input
- CLI-level error detection: the ASA answers an invalid command with HTTP 200, so response bodies are scanned for CLI failure markers
- Requests serialized per appliance with cancellable queueing, so one slow device cannot stall a whole dashboard
- Built-in retry logic with exponential backoff for transient failures
- TLS support with optional CA certificate verification
- Secrets stored in Grafana's encrypted secure settings
Compatibility
| Component | Version / Detail |
|---|---|
| Grafana | >= 12.0.0 |
| Cisco ASA | 9.x+ (verified against ASAv 9.24(1)) |
| API | HTTP(S) management (ASDM) exec interface, /admin/exec/ |
| Authentication | HTTP Basic, privilege level 15 |
Note: The plugin's parsers are built and tested against the CLI output format of Cisco Adaptive Security Appliance Software Version 9.24(1) only. Other releases may format
showcommand output differently, which can cause parsing to fail or return incomplete data.
Visuals
Onboarding
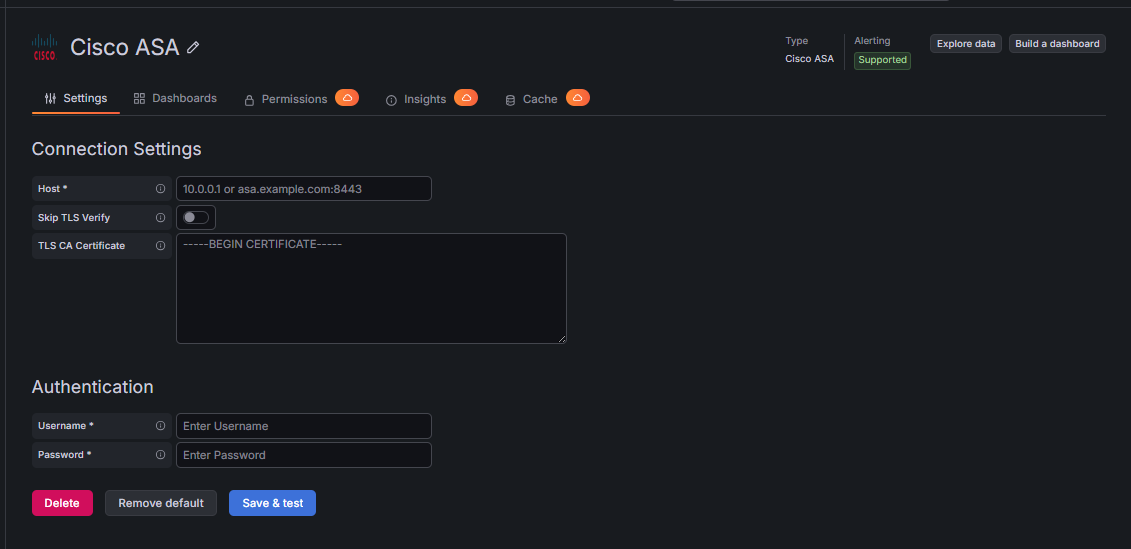
Query Editor
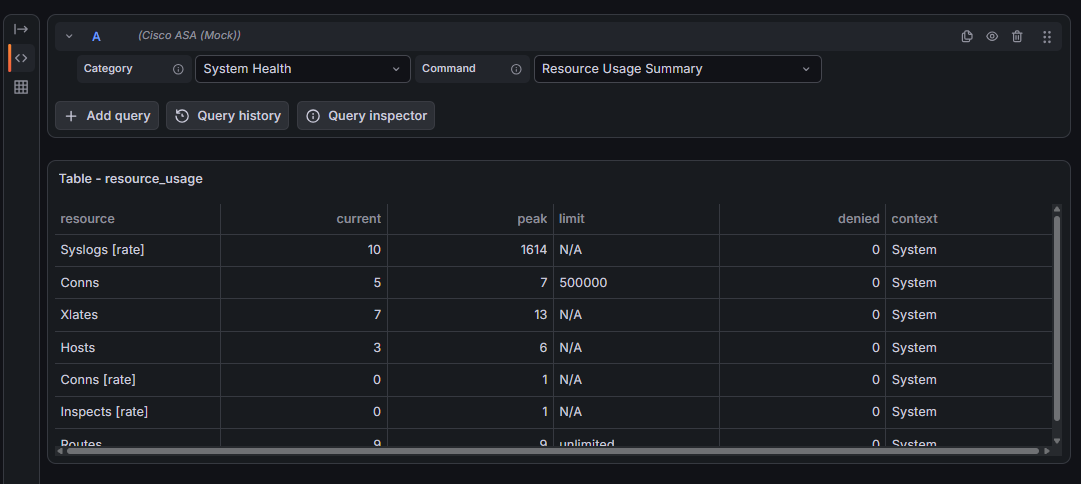
Dashboard Example
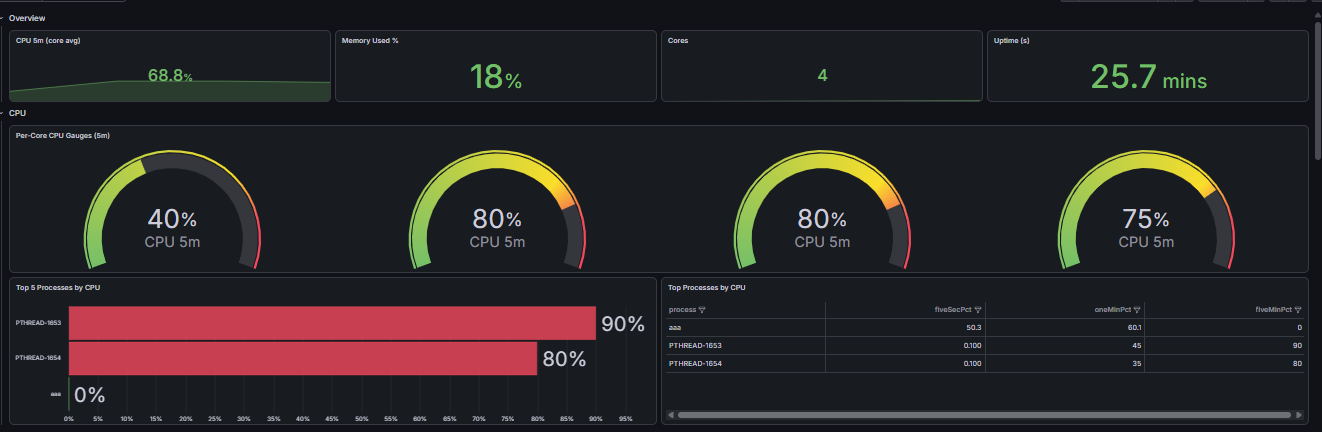
Installation
Requirements
- Grafana >= 12.0.0
- A Cisco ASA appliance (or ASAv) with the HTTP server enabled
- An ASA local or AAA account at privilege level 15
- Network connectivity from the Grafana host to the ASA management or data interface over HTTPS
Obtain ASA Credentials
- Log in to the ASA CLI (console or SSH) with configuration privileges.
- Enable the HTTP server and permit the Grafana host on the interface it will connect through.
- Create a dedicated monitoring account at privilege level 15 — the exec interface requires level 15 to run most
showcommands.
ciscoasa(config)# http server enable
ciscoasa(config)# http <grafana-host-ip> 255.255.255.255 <interface-name>
ciscoasa(config)# username grafana_ro password <strong-password> privilege 15
Install the Plugin
Install the plugin from the Grafana Plugin Catalog or using the Grafana CLI:
grafana cli plugins install crestdata-ciscoasa-datasource
After installation, restart the Grafana server for the plugin to be loaded.
Configure the Data Source
- In Grafana, navigate to Connections > Data Sources > Add data source.
- Search for Cisco ASA and select it.
- Fill in the required configuration fields:
| Name | Type | Required | Description |
|---|---|---|---|
| Host | String | Yes | ASA management or data interface IP or FQDN (e.g. 10.0.0.1). Append :port only if the HTTP(S) interface is not on 443 (e.g. asa.example.com:8443). An https:///http:// prefix and a trailing path are accepted and ignored — the connection always uses HTTPS |
| Skip TLS Verify | Boolean | No | Skip TLS certificate verification (not recommended for production) |
| TLS CA Certificate | String | No | PEM CA certificate or chain that signed the ASA HTTP trustpoint certificate; shown while verification is on |
| Username | String | Yes | ASA local or AAA username at privilege level 15 |
| Password | Secure String | Yes | Password for that account, stored encrypted |
- Click Save & Test. The health check runs
show versionagainst the device and confirms the response is genuine ASA output.
TLS Configuration
For secure production environments:
- TLS with CA Certificate (Recommended): Leave "Skip TLS Verify" off and paste the CA certificate that signed the ASA's HTTP trustpoint certificate into "TLS CA Certificate". Leave the field blank to verify against the system CA store.
- Skip TLS Verify: Only enable this for trusted environments, typically an appliance still presenting its factory self-signed certificate. This skips TLS certificate validation entirely.
Usage
Query Editor
Once the data source is configured, you can create panels using the query editor with the following parameters:
| Parameter | Type | Options | Default | Description |
|---|---|---|---|---|
| Category | Dropdown | System Health, Network & Connectivity, Security & Threat | System Health | Filters the Command list. UI-only — never sent to the device |
| Command | Dropdown | 44 read-only show commands (see Resources Reference) |
CPU Usage (Detailed) | The data to fetch. Each entry maps to one CLI command and a dedicated parser |
No command takes an argument, so the selected command is the whole query. Each command's tooltip states exactly what it returns.
Available Metric Categories
System Health
- CPU: per-core utilization over 5s/1m/5m, per-process CPU usage
- Memory: free/used/total bytes and percentage, largest internal memory chunks
- Capacity: resource current vs peak against configured limits with denied counts, flash (disk0:) usage
- Rates: perfmon per-second rates for translations, connections, inspections, AAA transactions
- Inventory & integrity: software version, model, serial, license mode, uptime, heap integrity checks
- Cluster: per-unit CPU, memory, connection counts and resource usage; cluster membership and state
Network & Connectivity
- Connections: every active flow with protocol, zones, addresses, ports, idle time
- Translation: NAT rules with translate/untranslate hit counts, active xlate entries
- Interfaces & Layer 2: interface IP/link/protocol state, ARP bindings, learned MAC addresses
- Routing: route counts and memory per source, EIGRP peers and mean SRTT
- Services: DNS resolver cache, NetFlow/NSEL export counters, IPsec counters by direction, LISP EID mappings
Security & Threat
- Access control: per-ACL element counts, permit/deny/trust totals, commit mode
- Security path: ASP drop counters by reason, rule-engine inserts/removes, uRPF anti-spoofing drops
- Traffic counters: low-level protocol counters, per-host TCP/embryonic/UDP flow counts
- Threat detection: event rates per signature across the 10-minute and 1-hour windows, service state and thresholds
- Botnet Traffic Filter: top malware sites, top malware ports, top infected hosts
- Identity & sessions: authenticated users, identity firewall per-user statistics and top users, management session quota, SSH sessions, AAA server reachability
- Logging: syslog queue depth, high-water mark, discarded messages
Time Series Handling
Every ASA show command returns the device's current state — the appliance exposes no historical or time-range query on this interface. Consequently:
- All frames are point-in-time snapshots; the panel time range does not filter device data
- Trends are built by Grafana from repeated polls, so set a panel refresh interval rather than widening the time range
- Scale the refresh interval with the weight of the command — heavy commands such as
show conn allorshow local-hostshould be polled no more often than every 5 minutes - Tables are the appropriate visualization for most commands; the bundled dashboards use time series only where repeated polling makes it meaningful
Error Handling and Retry Strategy
Retries are performed only for transient failures:
- HTTP 429 (rate limited)
- HTTP 5xx responses (500–599)
- Network/connection-level errors
- Errors while reading the response body
Max retry attempts: 3 (four attempts total), with exponential backoff (base delay: 500 ms — 500 ms, 1 s, 2 s). Per-request timeout is 10 seconds.
Non-retryable:
- HTTP 4xx errors (e.g. 401, 403, 404) are returned immediately
- CLI-level failures carried inside an HTTP 200 body — the ASA answers an invalid or unauthorized command with 200 and an error string, which the plugin detects and surfaces rather than parsing
- Cancelled queries and expired deadlines are terminal; a query Grafana has given up on never reaches the device
Requests are serialized per appliance because the exec interface shares the ASA's CLI-processing pipeline with SSH, console and ASDM. Queueing, backoff and inter-request pacing are all cancellable, so a slow device does not hold other panels hostage.
Resources Reference
System Health (14)
| Command | CLI command | Returns |
|---|---|---|
| CPU Usage (Detailed) | show cpu detailed |
Per-core CPU utilization over the 5-second, 1-minute and 5-minute windows. |
| Memory Usage | show memory |
Free, used and total system memory in bytes, with the used percentage. |
| Performance Monitor | show perfmon |
Per-second rates for translations, connections, inspections and AAA transactions — current vs average. |
| Resource Usage Summary | show resource usage summary |
Current and peak usage against the configured limit for each tracked resource, with denied counts. |
| Disk Storage (disk0) | show disk0: |
Flash storage (disk0:) capacity — total, used and free bytes. |
| Process CPU Usage | show process cpu-usage sorted non-zero |
CPU usage per running process over 5s/1m/5m, excluding idle processes. |
| Memory Chunk Top Usage | show chunkstat top-usage |
Largest internal memory-chunk allocations by name and size — useful when investigating a suspected leak. |
| Version & Uptime | show version |
Software version, hardware model, serial number, license mode and uptime. |
| Cluster Information | show cluster info |
Cluster membership — unit name, state, ID and control-link address. Returns data only when clustering is configured. |
| Heap Integrity Checks | show checkheaps |
Results of the periodic heap and buffer integrity checks, including any corruption found. |
| Cluster Connection Count | show cluster conn count |
Active and peak connection counts across the cluster. Returns data only when clustering is configured. |
| Cluster CPU Usage | show cluster cpu usage |
CPU utilization per cluster unit over 5s/1m/5m. Returns data only when clustering is configured. |
| Cluster Memory Usage | show cluster memory |
Free, used and total memory per cluster unit. Returns data only when clustering is configured. |
| Cluster Resource Usage | show cluster resource usage |
Resource usage against limits per cluster unit, with denied counts. Returns data only when clustering is configured. |
Network & Connectivity (12)
| Command | CLI command | Returns |
|---|---|---|
| Active Connections | show conn all |
Every active connection — protocol, source and destination zone, address, port and idle time. Output can be very large on a busy firewall. |
| NAT Translations | show xlate |
Active NAT translations — type, plus the real and mapped address and port on each interface. |
| NAT Rules (Detailed) | show nat detail |
Configured NAT rules in evaluation order, with translate and untranslate hit counts per rule. |
| Interface IP Summary | show interface ip brief |
Every interface with its IP address, link status and protocol state — the quickest up/down check. |
| ARP Table | show arp |
ARP table — IP-to-MAC bindings per interface, with the age of each entry. |
| MAC Address Table | show mac-address-table |
MAC addresses learned per interface, with entry type and time left before ageing out. |
| DNS Host Cache | show dns-hosts |
DNS resolver cache — resolved hostnames, their addresses and entry age. |
| Routing Table Summary | show route summary |
Route counts and memory consumption per routing source (connected, static, OSPF, EIGRP and so on). |
| EIGRP Interfaces | show eigrp interfaces |
EIGRP-enabled interfaces with peer count, transmit-queue depth and mean smoothed round-trip time. |
| NetFlow Export Counters | show flow-export counters |
NetFlow/NSEL export counters per collector, including dropped and errored records. |
| IPsec Statistics | show ipsec stats |
IPsec packet and error counters split by direction. Available counters vary by ASA release. |
| LISP EID Table | show lisp eid |
LISP EID-to-site mappings. Returns data only when LISP inspection is configured. |
Security & Threat (18)
| Command | CLI command | Returns |
|---|---|---|
| Access List Internal Summary | show access-list internal |
Per-ACL compilation summary — element counts, permit/deny/trust totals and commit mode. |
| Security Path Drop Counters | show asp drop |
Accelerated Security Path drop counters by reason — shows where the data plane is discarding traffic. |
| Security Path Rule Engine | show asp rule-engine |
Rule-engine activity per module — rule inserts, removes and the current in-use count. |
| IP Spoofing Verification Statistics | show ip verify statistics |
Unicast RPF anti-spoofing drop counts per interface. |
| System Counters | show counters |
Low-level protocol counters (packets in and out, drops) per protocol and context. |
| Local Host Connections | show local-host |
Per-host connection footprint — TCP, embryonic and UDP flow counts for each tracked host. |
| Threat Detection Rates | show threat-detection rate |
Threat-detection event rates per signature across the 10-minute and 1-hour windows, with totals and trigger counts. |
| Threat Detection Services | show threat-detection service |
State of each threat-detection service, with its threshold and hold-down period. |
| Logging Queue Status | show logging queue |
Syslog queue depth, high-water mark, and messages discarded through overflow or allocation failure. |
| Top Malware Sites | show dynamic-filter reports top malware-sites |
Botnet Traffic Filter — top malware sites by connections logged and dropped, with threat level and category. |
| Top Malware Ports | show dynamic-filter reports top malware-ports |
Botnet Traffic Filter — the ports carrying the most malware connections. |
| Top Infected Hosts | show dynamic-filter reports top infected-hosts |
Botnet Traffic Filter — internal hosts with the most malware connections. |
| Authenticated Users | show uauth |
Users currently authenticated by cut-through proxy, with their IP and the access list applied. |
| User Identity Statistics | show user-identity statistics |
Identity Firewall per-user totals — session counts alongside firewall and inspection drops. |
| Top Users by Traffic | show user-identity statistics top user |
Identity Firewall top users, ranked by traffic and session activity. |
| Session Quota Management | show quota management-session |
Management session counts per connection type and user, measured against the configured quota. |
| SSH Sessions | show ssh sessions |
Active SSH sessions with client IP, protocol version, cipher, HMAC, state and username. |
| AAA Servers | show aaa-server |
AAA server groups — protocol, address, reachability status, mean round-trip time and request counters. |
Limitations and Recommendations
Device considerations:
- Snapshot data: every command returns current state — the ASA has no time-range query on the exec interface. The panel time range does not filter device data (see Time Series Handling)
- Shared control plane: the HTTP exec interface shares the ASA's CLI-processing pipeline with SSH, console and ASDM. Requests are serialized per data source
- No pagination and no row cap: output is a single text response and every parsed row is returned. Commands whose output scales with device state —
show conn all,show xlate,show local-host,show uauth,show arp,show mac-address-table— can return tens of thousands of rows on a busy device. Narrow those panels with transformations and field filters, and prefer a summary command where one exists - Deployment-conditional commands: cluster, VPN-pool and IPsec commands return data only when the corresponding feature is configured. On ASAv, hardware-sensor data is absent
- Release-dependent output: these are CLI text parsers.
show ipsec statsin particular discovers its columns from the response, so available counters vary by ASA release
Performance tips:
- Scale panel refresh with command weight — heavy commands (
show conn all,show local-host,show access-list internal) no more often than every 5 minutes - Narrow large tables with panel transformations or field filters rather than polling more often
- Use one data source per appliance; requests to the same appliance are serialized by design
Support
For issues, questions, or feature requests, please reach out to grafanalabs.integrations@crestdata.ai
Authors and Acknowledgment
Developed by Crest Data.
License
This plugin is distributed under the Crest Data EULA. See the LICENSE file.
References
Grafana Cloud
Connect any plugin in Grafana Cloud.
- 150+ data source integrations
- Grafana Assistant - AI that correlates your data, builds queries, and answers questions
- 10k Prometheus metrics + 50 GB logs, traces, and profiles on the free tier
- ...and more
Insights
- Adoption
Running on 6 active Grafana instances.
- Activity
Last updated 21 Aug 2026.
1 release in the past year.
- Queries
0 total queries served across all Grafana Cloud instances.
- Version
- 1.0.2
- Dependencies
- Grafana >=12.0.0
- Developer
- crestdata
Grafana Cloud
Connect any plugin in Grafana Cloud.
- 150+ data source integrations
- Grafana Assistant - AI that correlates your data, builds queries, and answers questions
- 10k Prometheus metrics + 50 GB logs, traces, and profiles on the free tier
- ...and more