
CnosDB data source for Grafana
This document describes how to install and configure CnosDB data source plugin for Grafana, and to query and visualize data from CnosDB.
Installation
At first, you should add a Connection to query CnosDB.
Navigate to Configurations / Plugins, search cnosdb and then click it.
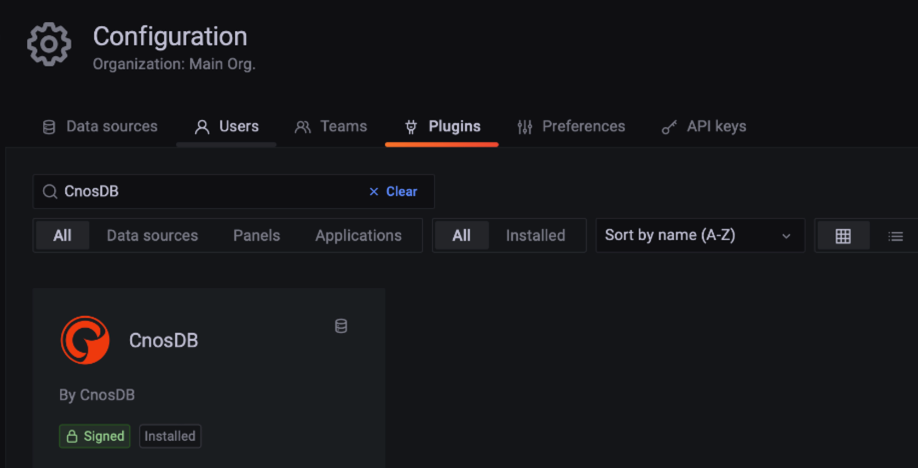
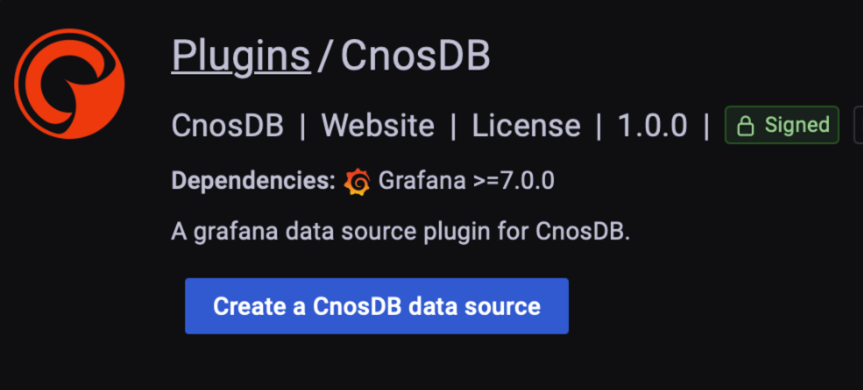
Click button Create a CnosDB data source.
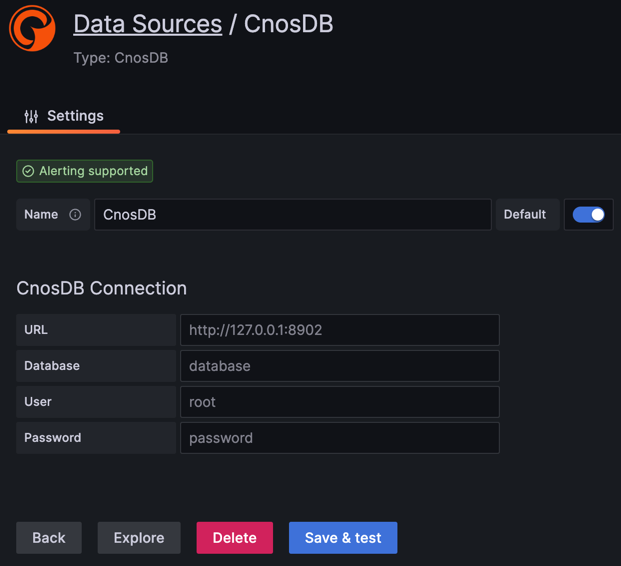
Configure the connection options, then click the Save & test button.
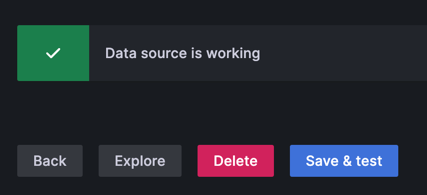
If you see "Data source is working" that means CnosDB data source connected successfully.
Usage - Dashboard
See Use Dashboards for more instructions on how to use grafana dashboard.
Navigate to Dashboards, click New Dashboard in dropped down list, then click Add a new panel. Now you can see the visual query editor.
Visual query editor
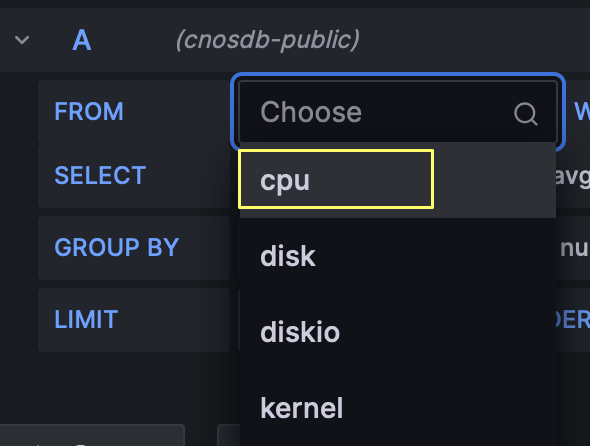
Click the area after FROM to choose the table.
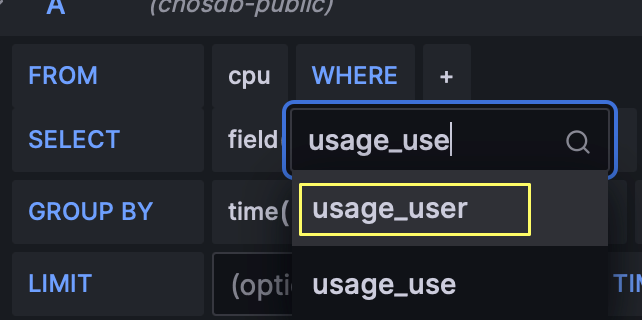
Click the area after SELECT to choose the column.
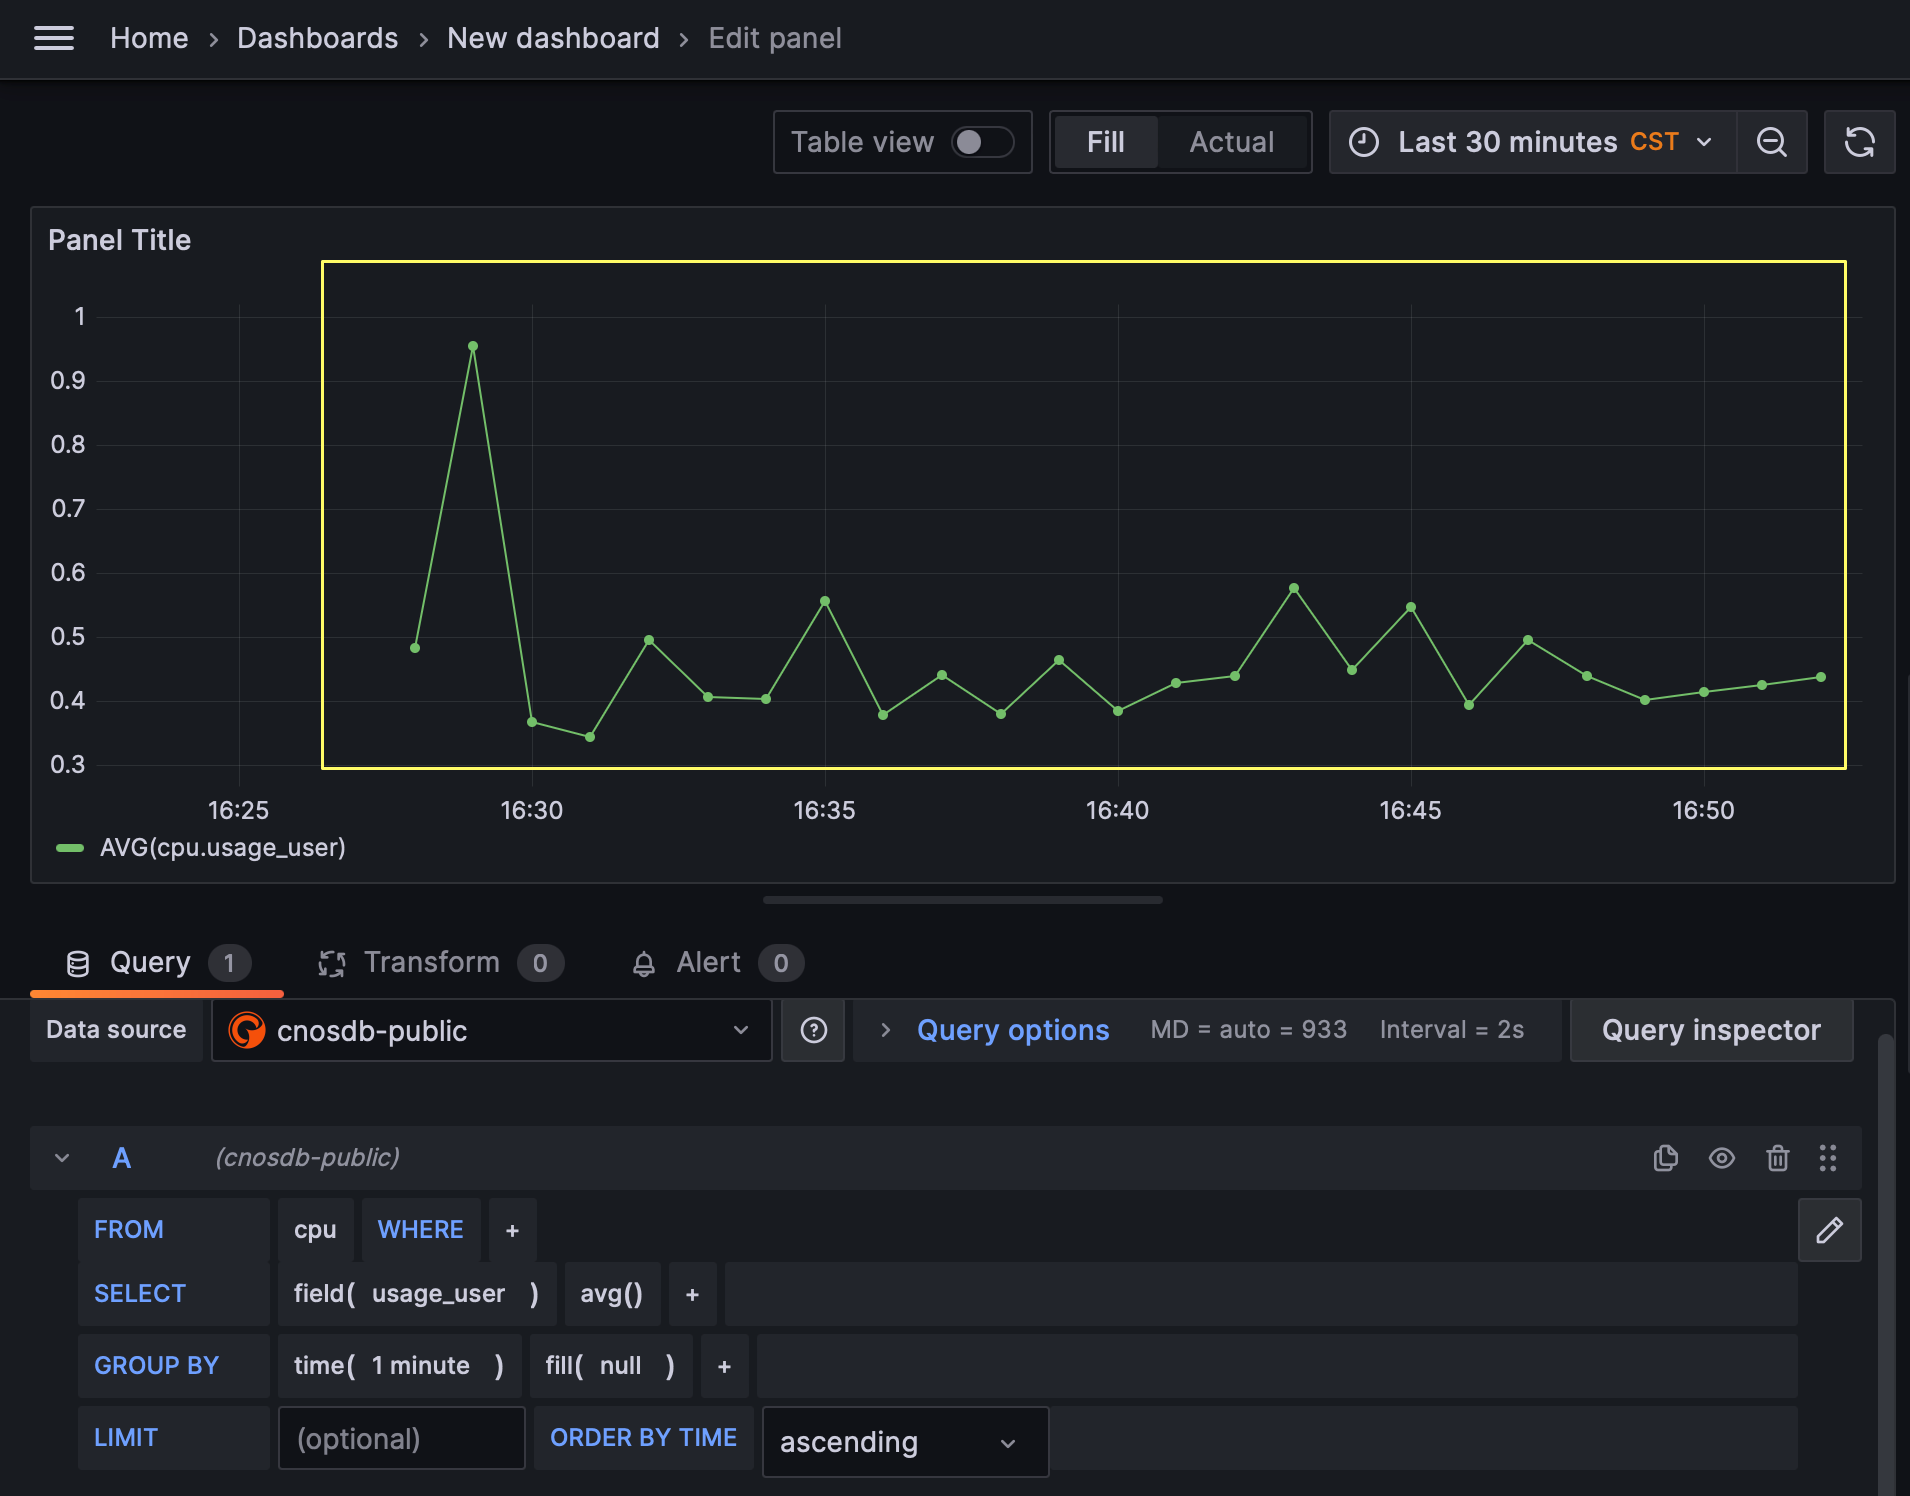
Now you can see the visualization of the query result.
Raw query editor
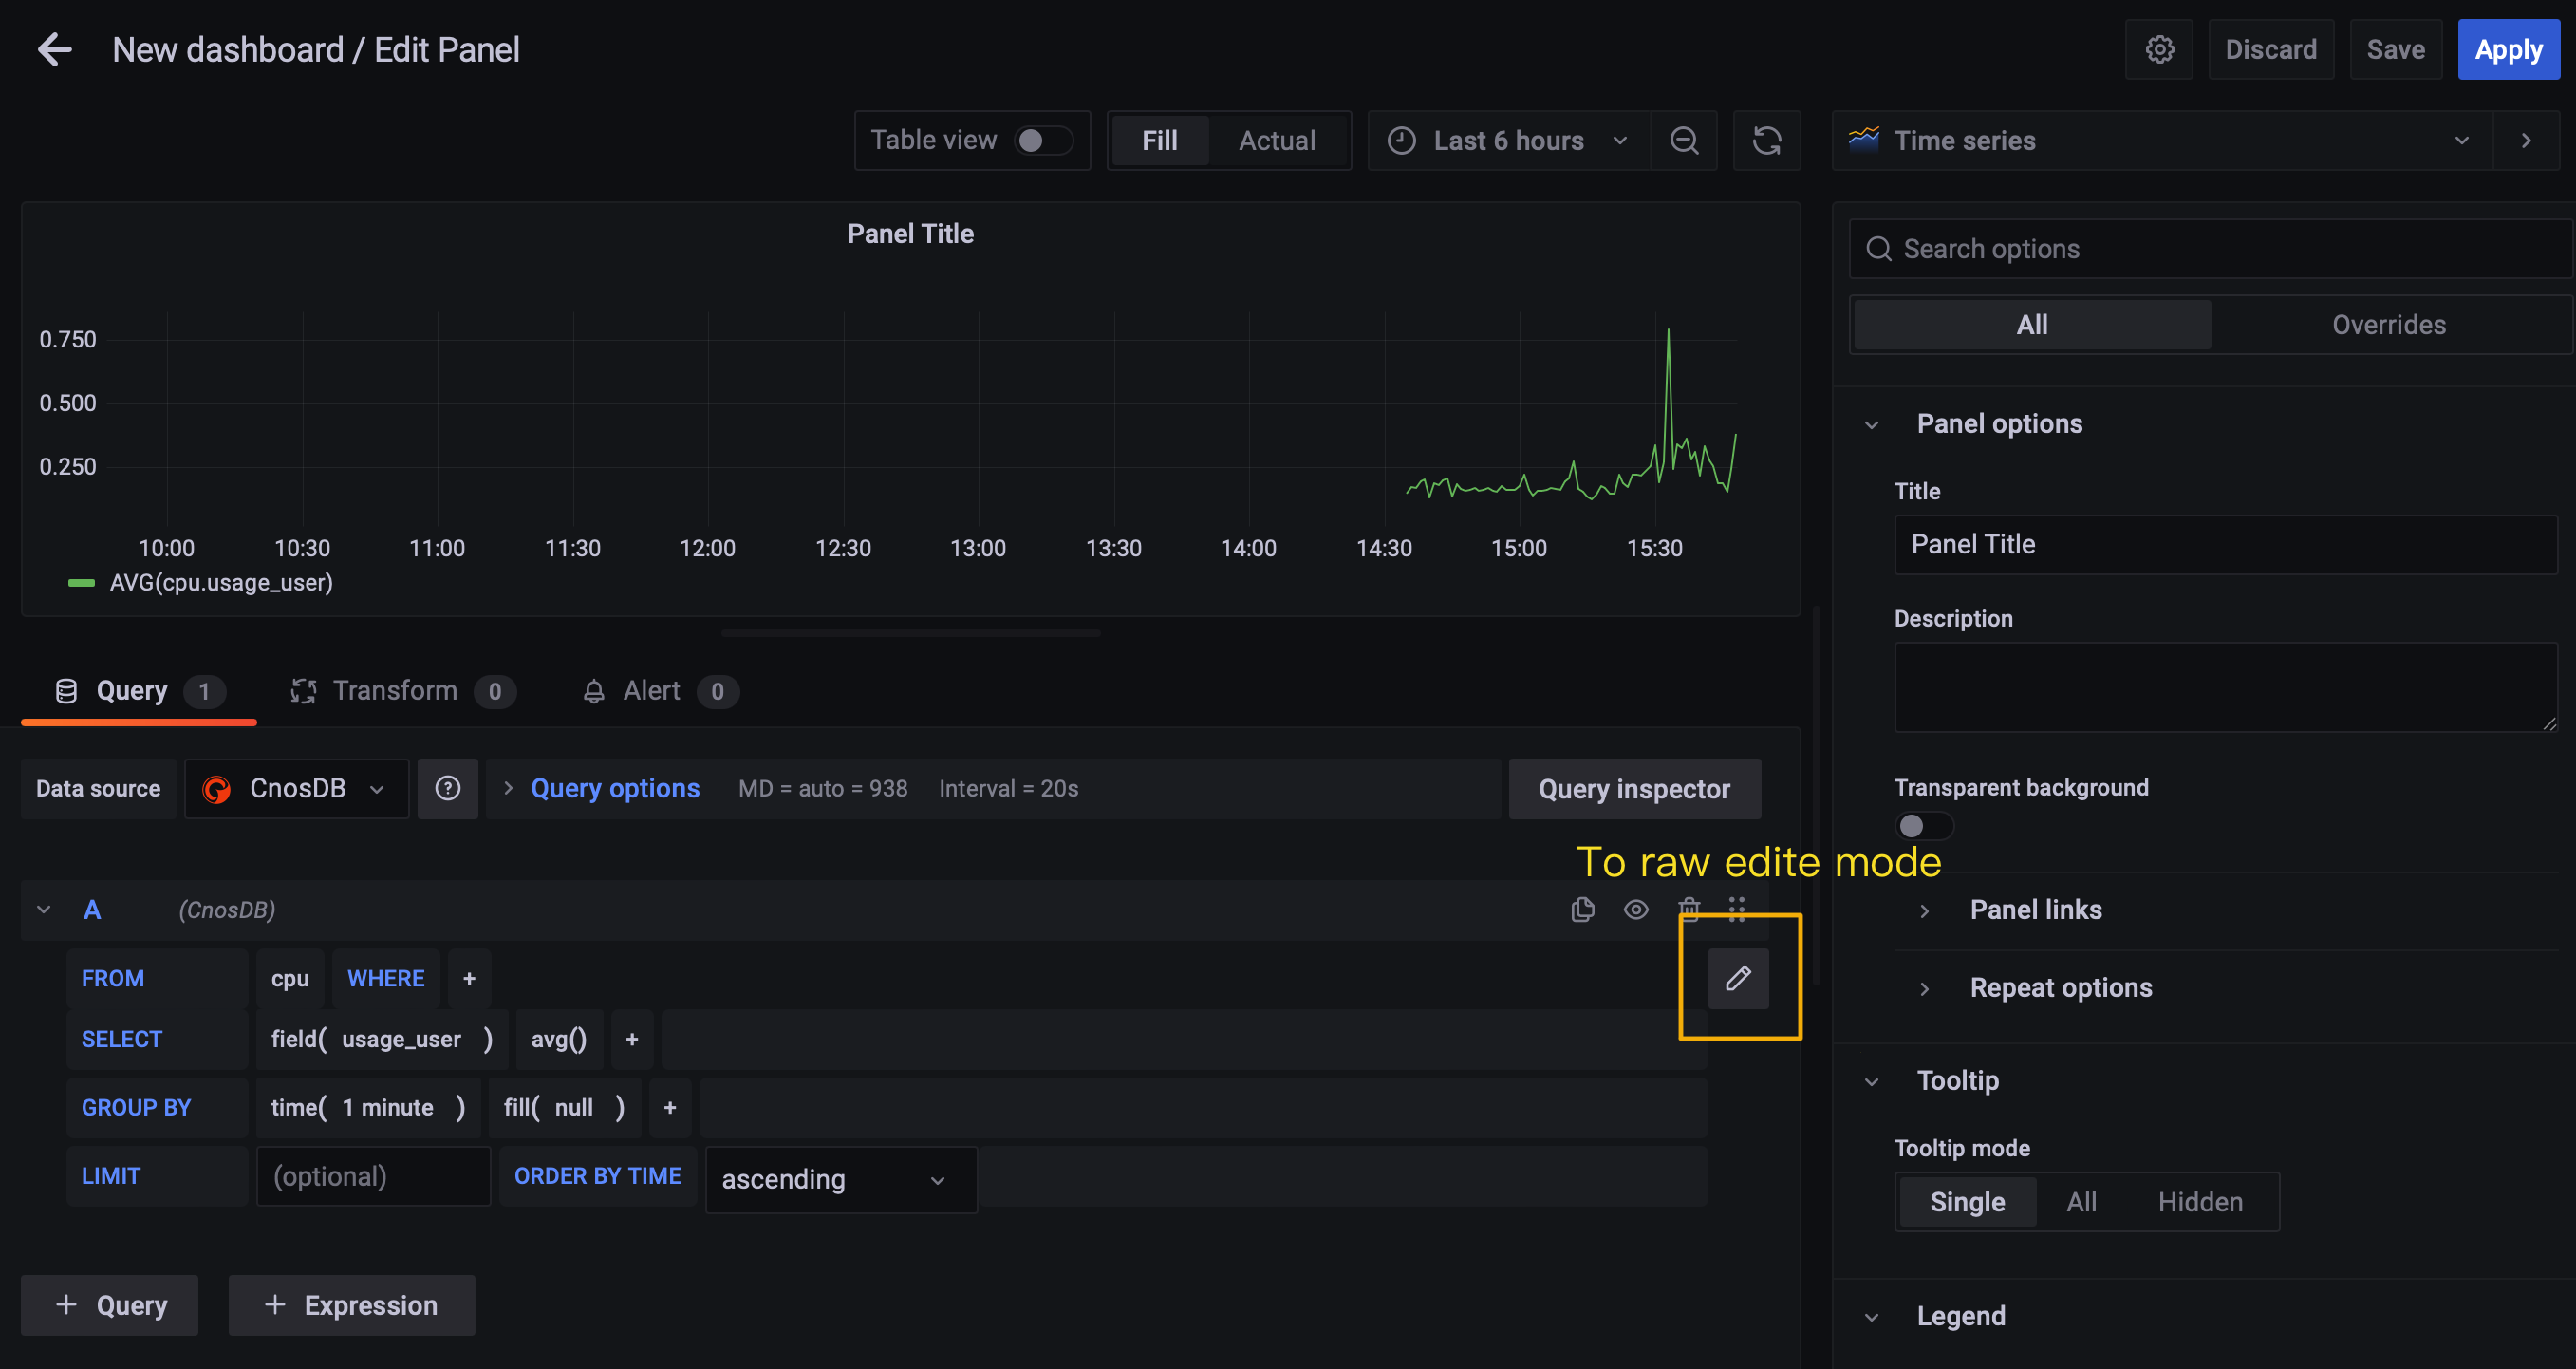
You can also enter the raw sql editor mode by clicking this button.
Now the whole visual query editor means SQL query below:
SELECT date_bin(INTERVAL '1 minute', time, TIMESTAMP '1970-01-01T00:00:00Z') AS time, avg(usage_user)
FROM cpu
WHERE $timeFilter
GROUP BY date_bin(INTERVAL '1 minute', time, TIMESTAMP '1970-01-01T00:00:00Z')
ORDER BY time ASC
You can see that SQL in raw query editor.
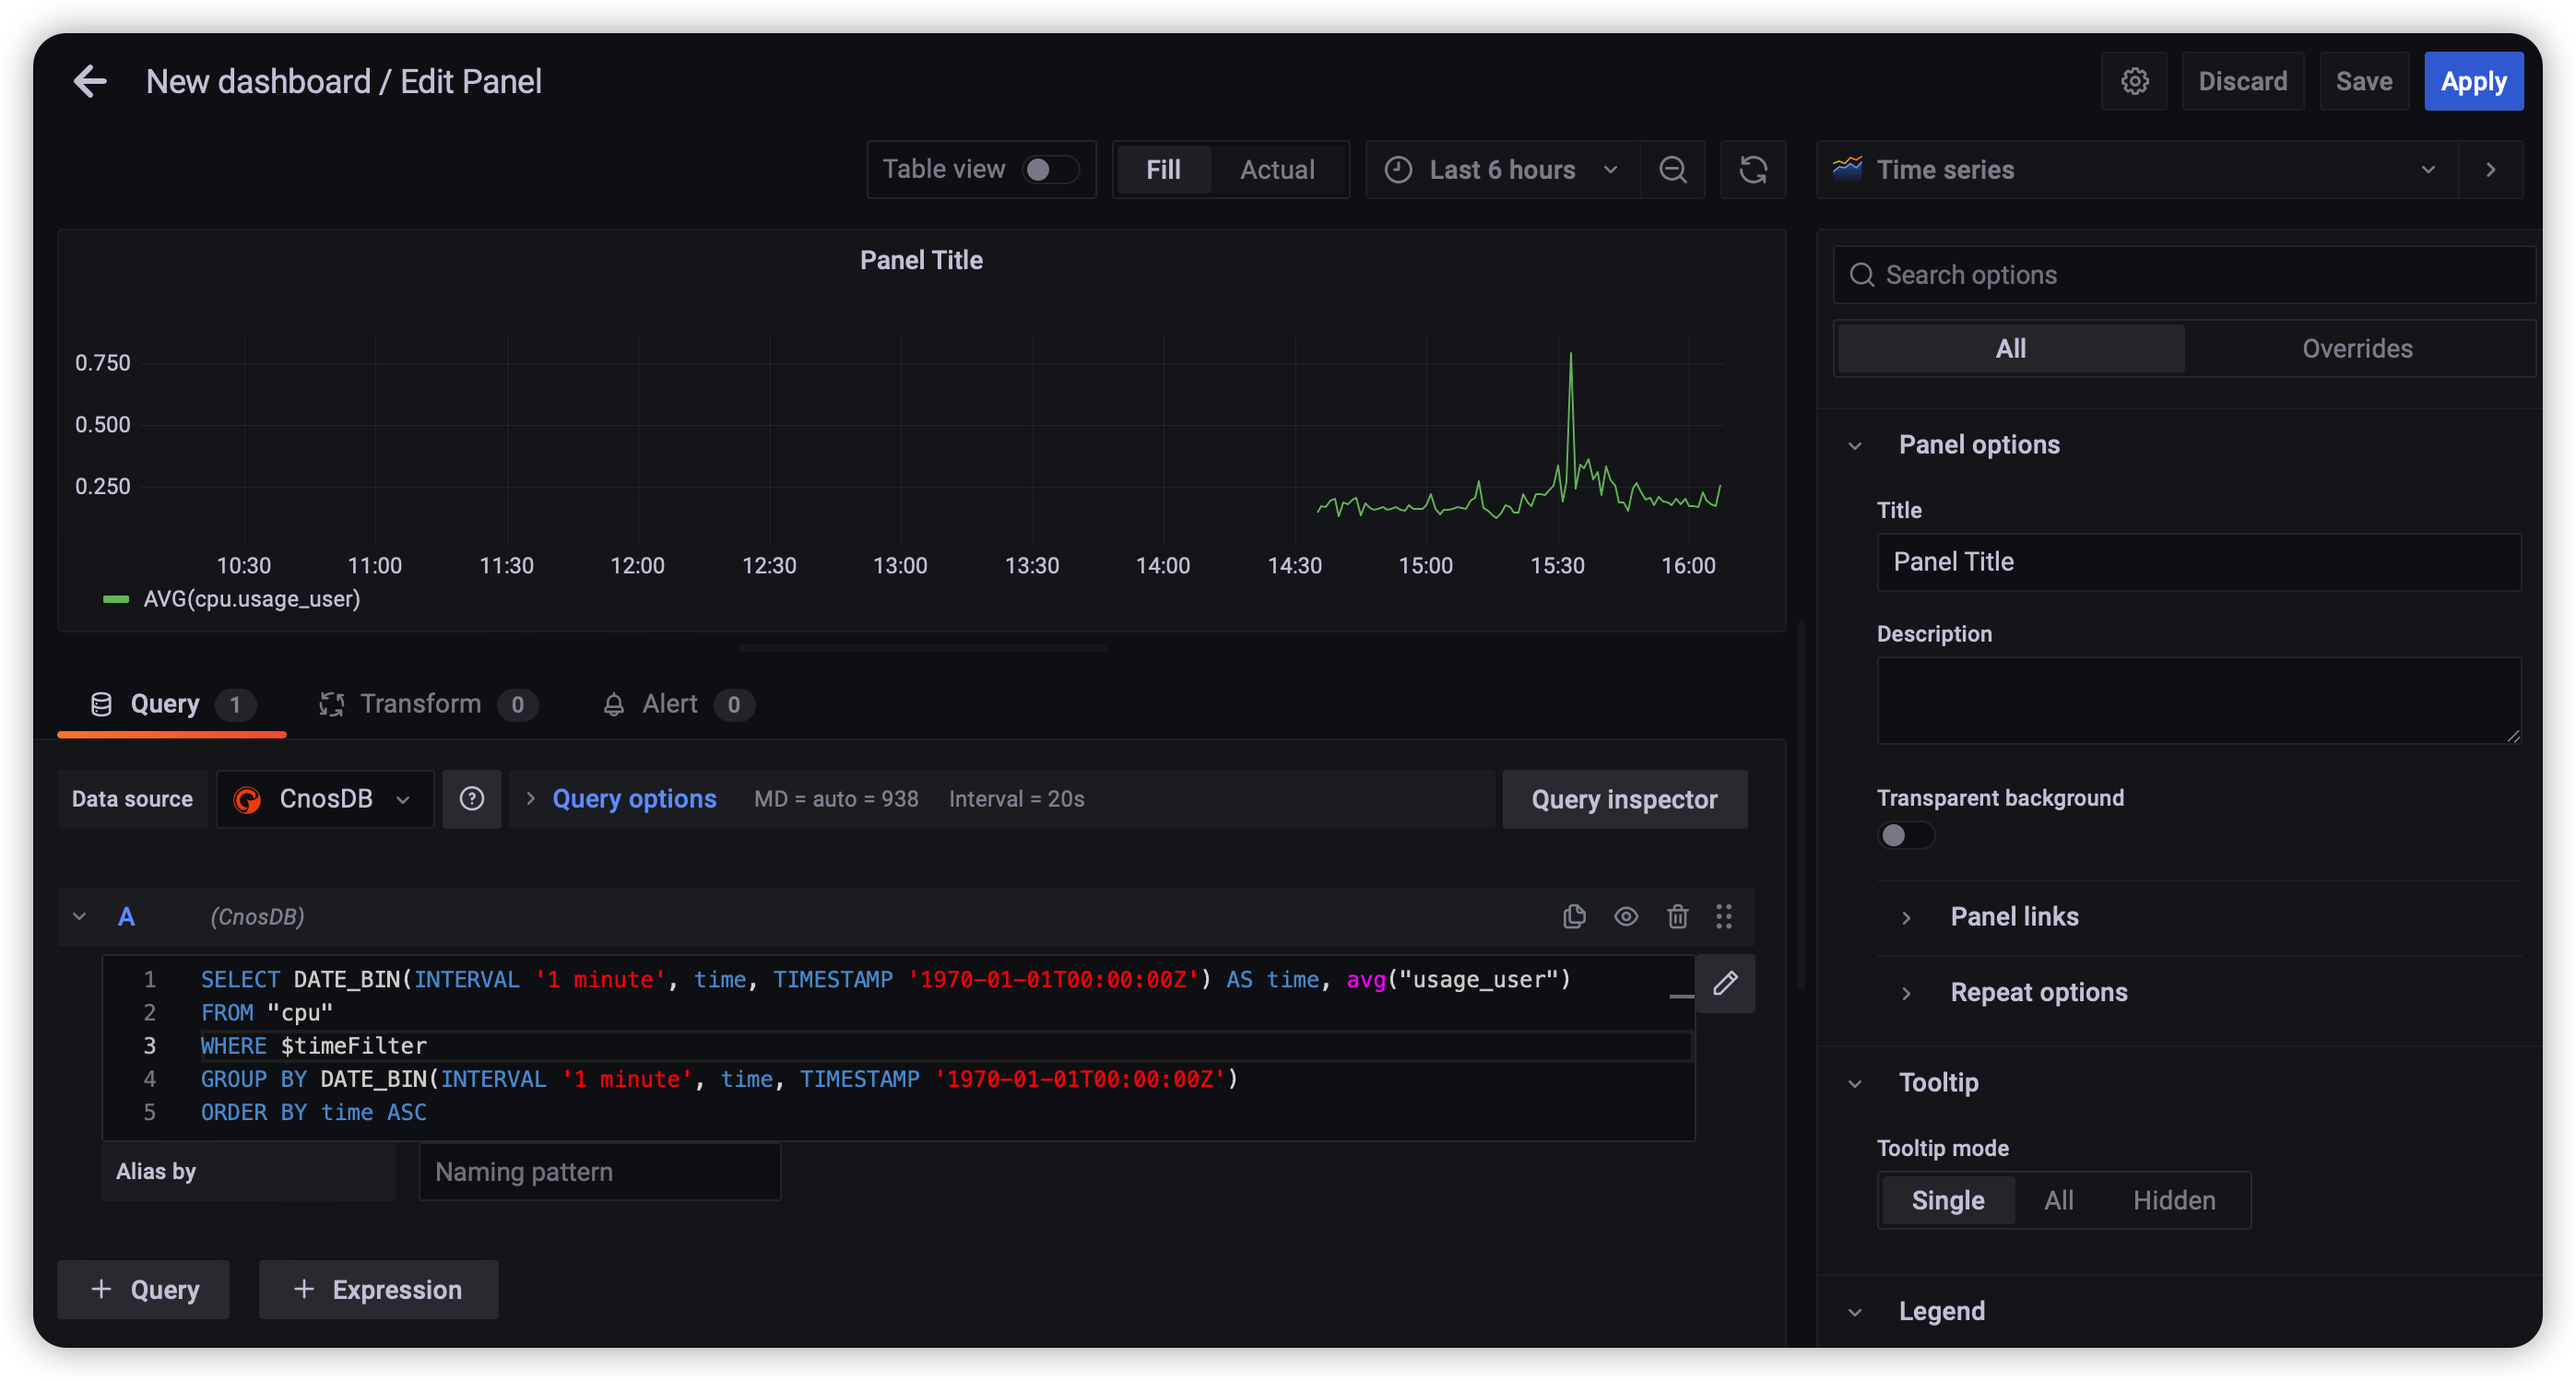
Save your panel
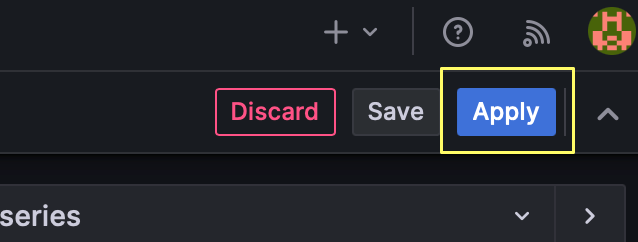
Click Apply to save the panel, and then you will be navigated to New dashboard page.
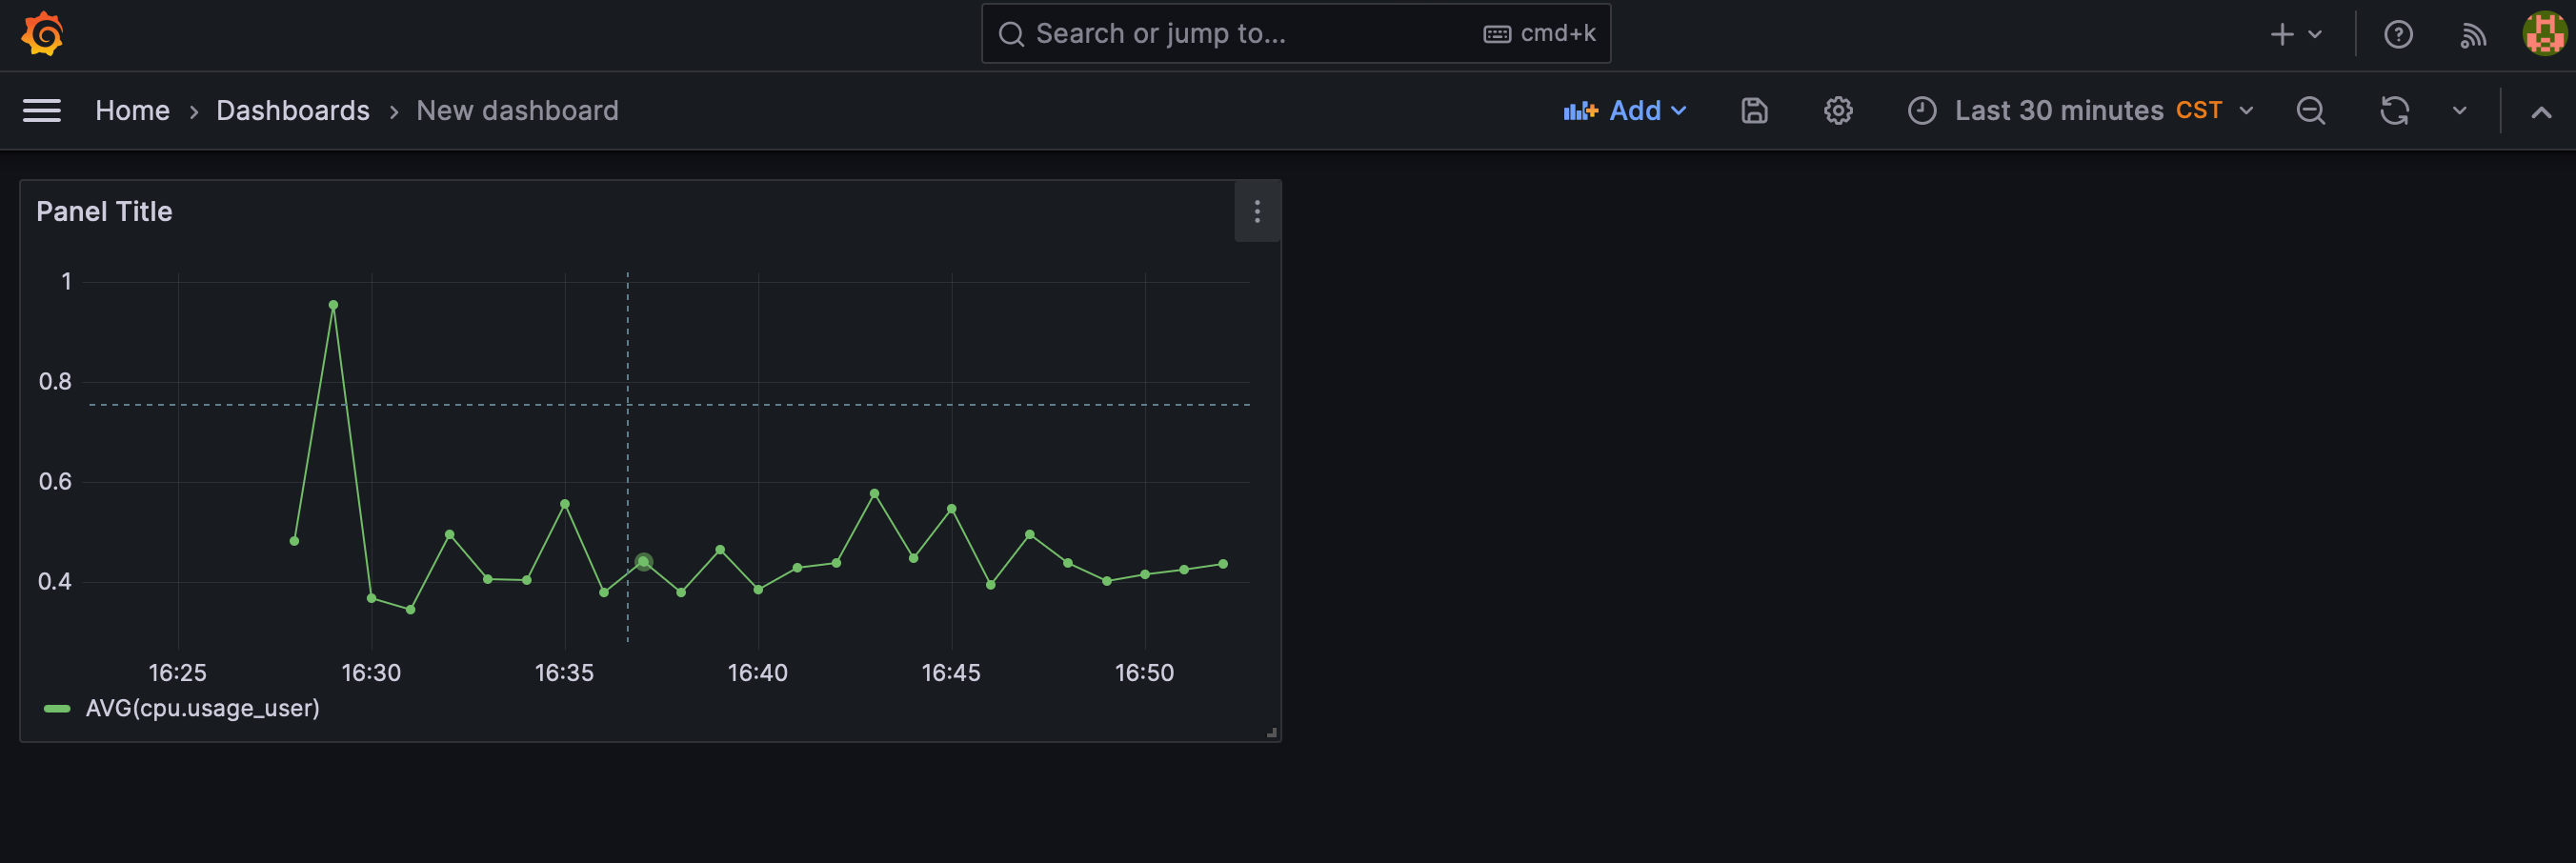
You'll see the panel we just edited on New dashboard page.
Grafana Cloud
Connect any plugin in Grafana Cloud.
- 150+ data source integrations
- Grafana Assistant - AI that correlates your data, builds queries, and answers questions
- 10k Prometheus metrics + 50 GB logs, traces, and profiles on the free tier
- ...and more
Insights
- Adoption
Running on 26 active Grafana instances.
- Activity
Last updated 1 Sep 2023.
0 releases in the past year.
- Queries
0 total queries served across all Grafana Cloud instances.
- Version
- 0.5.2
- Dependencies
- Grafana >=8.3.0
- Developer
- cnos
Grafana Cloud
Connect any plugin in Grafana Cloud.
- 150+ data source integrations
- Grafana Assistant - AI that correlates your data, builds queries, and answers questions
- 10k Prometheus metrics + 50 GB logs, traces, and profiles on the free tier
- ...and more