
Important: This documentation is about an older version. It's relevant only to the release noted, many of the features and functions have been updated or replaced. Please view the current version.
Use dashboards
Note: Looking for prebuilt Grafana dashboards? Check out our full library of dashboards and more →
The dashboard UI has the following sections to allow you to customize the presentation of data.
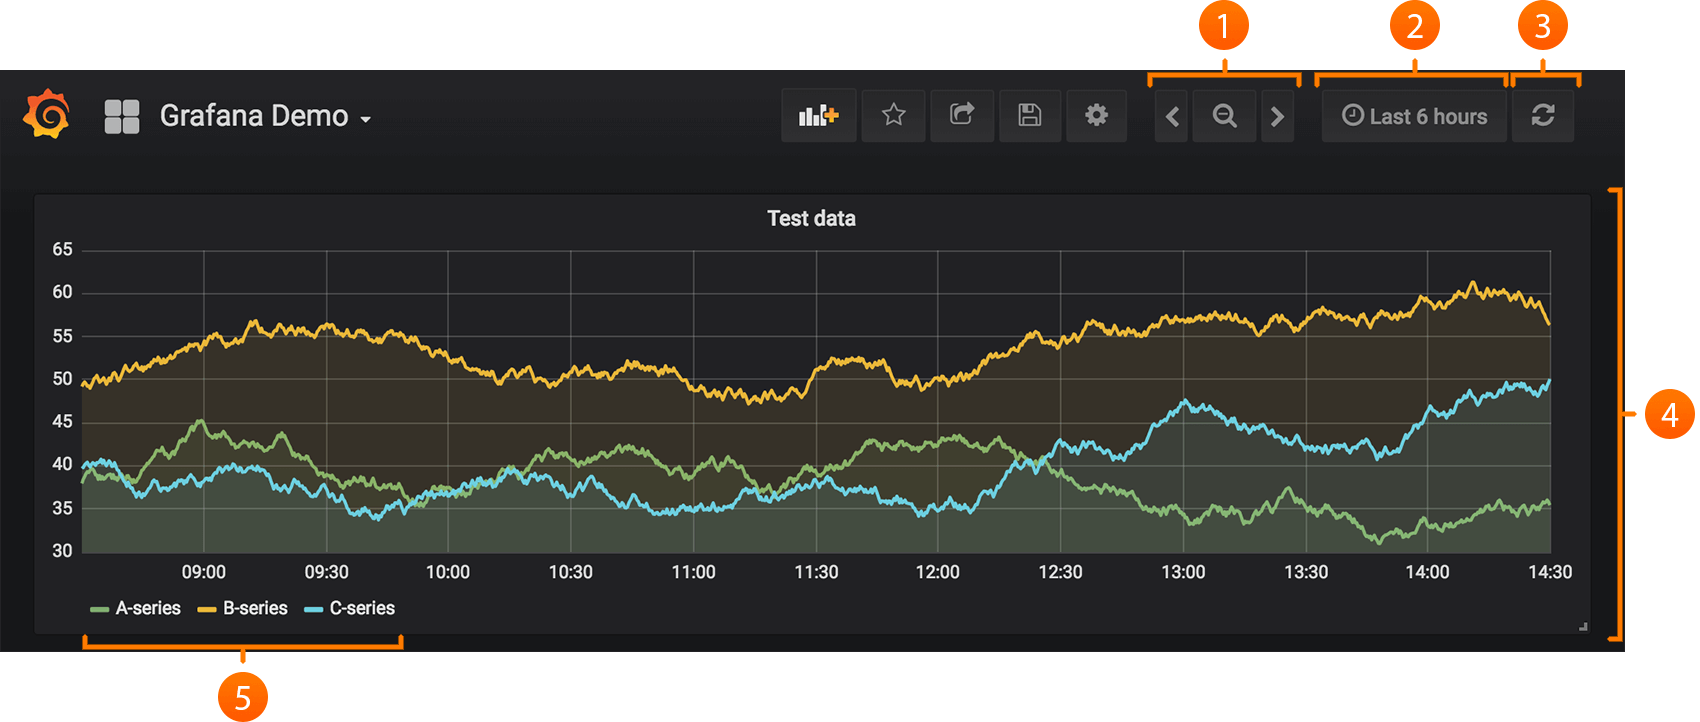
- Zoom out time range (1)
- Time picker dropdown (2). Access relative time range options, auto refresh options and set custom absolute time ranges.
- Refresh option (3) Click to trigger queries or set auto refresh.
- Dashboard panel (4) Click the panel title to open panel menu.
- Graph legend (5) Change series colors, y-axis and series visibility directly from the legend.
For more details, see Dashboard header and Dashboard rows.
Dashboard header
The dashboard header has the following sections.
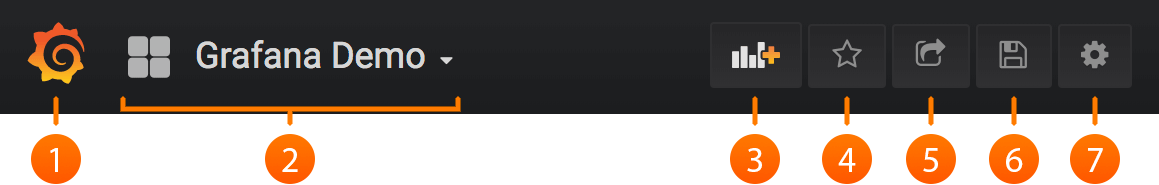
- Dashboard title (2): This also opens the dashboard search when clicked.
- Add panel (3): Use this option to add a new panel or row to the current dashboard.
- Star dashboard (4): Use this option to star (or unstar) the current dashboard. Starred dashboards show up on your own home dashboard by default. It is a convenient way to mark Dashboards that you’re interested in.
- Share dashboard (5): Use this option to share the current dashboard by link or snapshot. You can also export the dashboard definition from the share modal.
- Save dashboard (6): Use this option to save the current dashboard using its current name.
- Settings (7): Use this option to open dashboard settings. Here you change dashboard name, folder, tags as well as manage variables and annotation queries.
Dashboard panels
The main building block of dashboard is the panel. You add new panels via the Add panel button at the top of the dashboard. This will add view at the top where you can choose if you want to add a new panel, row or library panel. Library panels are panels that can be shared (reused) in many dashboards. You can move panels around by just dragging the panel header. To resize panel use the lower right corner.
Dashboard rows
A dashboard row is a logical divider within a dashboard. It is used to group panels together. Rows can be collapsed or expanded allowing you to hide parts of the dashboard. Panels inside a collapsed row will not issue any queries.
Use the repeating rows to dynamically create rows based on a template variable.
Keyboard shortcuts
Grafana has a number of keyboard shortcuts available. Press ? or h on your keyboard to display all keyboard shortcuts available in your version of Grafana.
Ctrl+S: Saves the current dashboard.f: Opens the dashboard finder / search.d+k: Toggle kiosk mode (hides the menu).d+e: Expand all rows.d+s: Dashboard settings.Ctrl+K: Opens the command palette.Esc: Exits panel when in fullscreen view or edit mode. Also returns you to the dashboard from dashboard settings.
Focused Panel
By hovering over a panel with the mouse you can use some shortcuts that will target that panel.
e: Toggle panel edit viewv: Toggle panel fullscreen viewps: Open Panel Share Modalpd: Duplicate Panelpr: Remove Panelpl: Toggle panel legend
Dashboard Search
Dashboards can be searched by the dashboard name, filtered by one (or many) tags or filtered by starred status. The dashboard search is accessed through the dashboard picker, available in the dashboard top nav area. The dashboard search can also be opened by using the shortcut F.
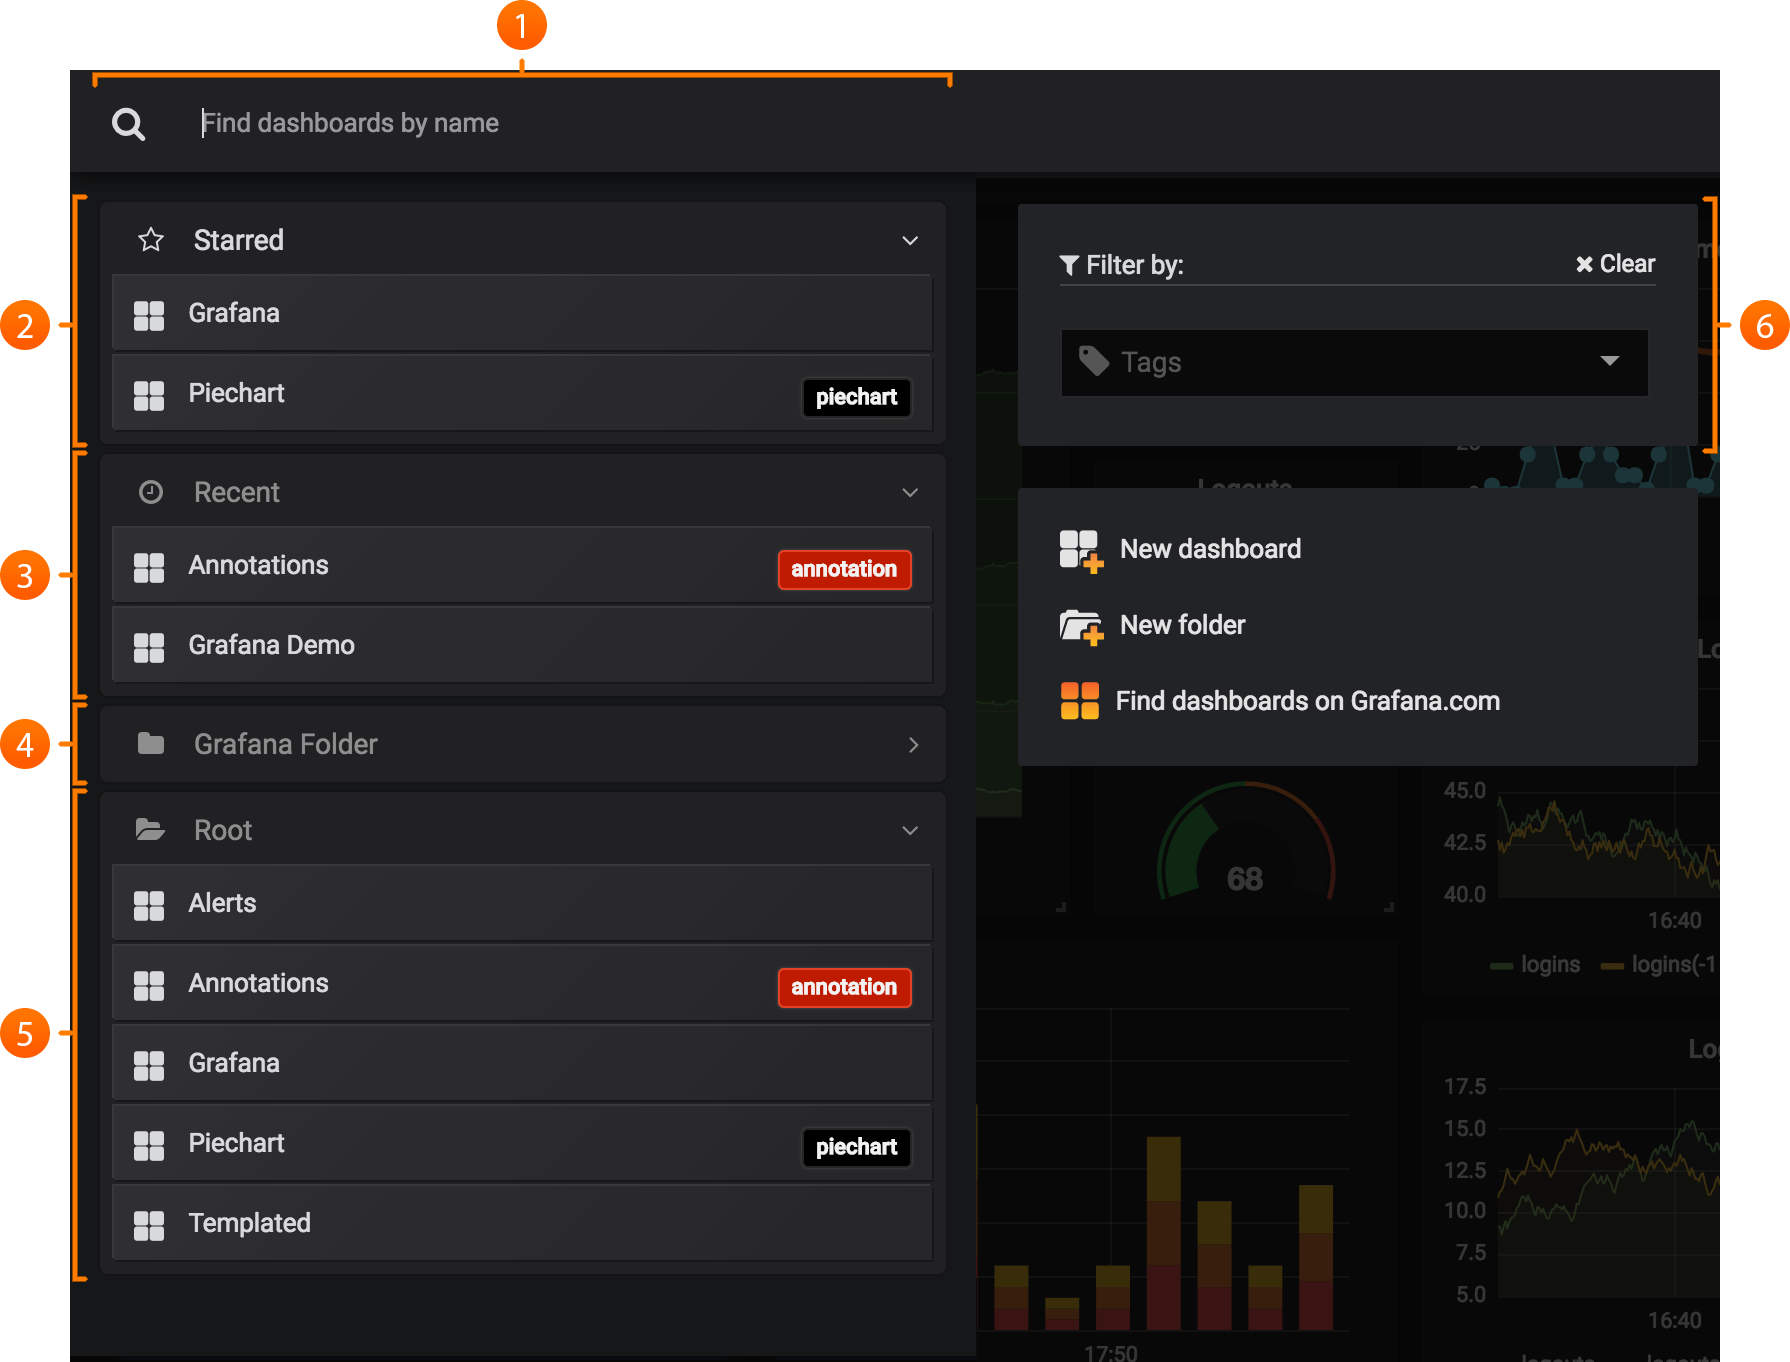
Search Bar: The search bar allows you to enter any string and search both database and file based dashboards in real-time.Starred: Here you find all your starred dashboards.Recent: Here you find the latest created dashboards.Folders: The tags filter allows you to filter the list by dashboard tags.Root: The root contains all dashboards that are not placed in a folder.Tags: The tags filter allows you to filter the list by dashboard tags.
When using only a keyboard, you can use your keyboard arrow keys to navigate the results, hit enter to open the selected dashboard.
Find by dashboard name
Begin typing any part of the desired dashboard names in the search bar. Search will return results for any partial string match in real-time, as you type.
Dashboard search is:
- Real-time
- Not case sensitive
- Functional across stored and file based dashboards.
Filter by Tag(s)
Tags are a great way to organize your dashboards, especially as the number of dashboards grow. Tags can be added and managed in the dashboard Settings.
To filter the dashboard list by tag, click on any tag appearing in the right column. The list may be further filtered by clicking on additional tags:
Alternately, to see a list of all available tags, click the tags dropdown menu. All tags will be shown, and when a tag is selected, the dashboard search will be instantly filtered:
When using only a keyboard: tab to focus on the tags link, ▼ down arrow key to find a tag and select with the Enter key.
Note: When multiple tags are selected, Grafana will show dashboards that include all.
Was this page helpful?
Related resources from Grafana Labs


