
Canvas panel plugin



Draw pictures with the Canvas visualization panel plugin, then paint by numbers with your Grafana metrics data!
Overview
Canvas is a composable panel where you place and style elements — rectangles, text, icons, images, and more — freely on a grid, then bind their properties (position, color, text, visibility) to fields from your Grafana data. It's well suited to building custom infographics, floor plans, network diagrams, and other visualizations that don't fit a standard chart type.
This plugin is the externalized version of the Canvas panel that was previously built into Grafana core.
Showcase
 |
 |
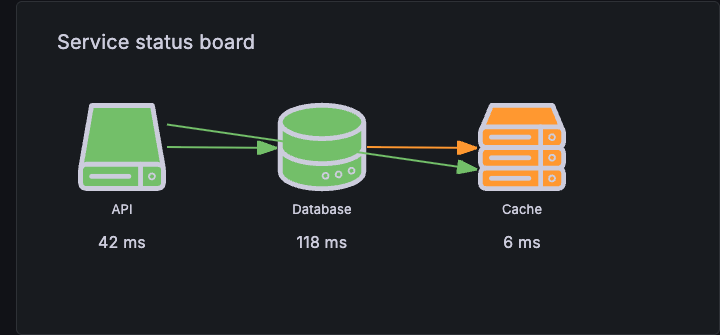
| Service status board — connected nodes with live-bound status and latency | Floor plan sensor overlay — rooms as shapes, live data-bound status icons |
 |
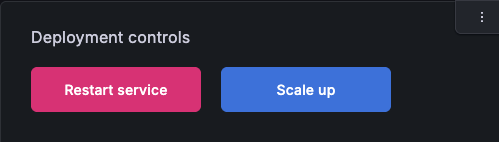 |
| Turbine and drone fleet monitor — custom elements bound to live data | Interactive action buttons — Canvas elements can trigger API calls, not just display data |
The provisioned dashboards behind these screenshots live under
provisioning/dashboards/
(canvas_showcase*.json) — run npm run server to load them locally.
Documentation
- See complete documentation at grafana.com
Changelog
CHANGELOG.md— release history
Contributing
CONTRIBUTING.md— development setup, building, testing, and linting
Grafana Cloud
Connect any plugin in Grafana Cloud.
- 150+ data source integrations
- Grafana Assistant - AI that correlates your data, builds queries, and answers questions
- 10k Prometheus metrics + 50 GB logs, traces, and profiles on the free tier
- ...and more
Insights
- Activity
Last updated 7 Oct 2026.
1 release in the past year.
- Version
- 13.3.1
- Dependencies
- Grafana >=13.2.0-0
- Developer
- Grafana Labs
Grafana Cloud
Connect any plugin in Grafana Cloud.
- 150+ data source integrations
- Grafana Assistant - AI that correlates your data, builds queries, and answers questions
- 10k Prometheus metrics + 50 GB logs, traces, and profiles on the free tier
- ...and more