
IyziTrace Documentation
A comprehensive OpenTelemetry-native observability platform built as a Grafana plugin. Transform your telemetry data into actionable insights with powerful visualization, AI-driven analysis, and intelligent service mapping.
Table of Contents
- Introduction
- Platform Features Gallery
- Get Started
- Key Concepts
- Features
- Configuration
- Access Control
- Advanced Features
- API Reference
- FAQ
- Troubleshooting
Introduction
IyziTrace is a powerful observability platform designed to provide deep insights into your distributed systems. Built on OpenTelemetry standards and running as a Grafana plugin, it combines metrics, logs, and traces into a unified, intuitive interface.
Infrastructure Monitoring, Without the Heavy Lift
Collect metrics, logs, and traces in minutes. Zero-maintenance pipelines, transparent pricing, and deep context for faster debugging.
Platform Highlights:
- 10s install time - Get up and running in seconds
- 99.95% uptime - Enterprise-grade reliability
- OpenTelemetry native - Built on open standards
- Usage-based pricing - Transparent, predictable costs
What is IyziTrace?
IyziTrace offers:
- Unified Observability: Seamlessly correlate metrics, logs, and traces
- Service-Centric View: Understand your microservices architecture at a glance
- Infrastructure Monitoring: Real-time insights into your hosts and containers
- AI-Powered Analysis: Get intelligent recommendations and anomaly detection
- Agent Management: Manage and monitor OpenTelemetry collectors remotely
- Inventory Management: Track and discover all infrastructure entities and relationships
- OpenTelemetry Native: Built on open standards for maximum compatibility
Why IyziTrace?
Observability Only You Need
No complex setups, no maintenance — all the context for your logs, metrics and traces.
Full-stack Infrastructure Overview: See servers, runtimes, services and operations in a single layered view. From CPU usage to business operations, IyziTrace gives you an instant, end-to-end snapshot of your system health.

Service Dependency Topology: Visualize all services and their dependencies as interactive service maps. Click any node to see details including infrastructure info, resources, health status, and connected applications.

Deep Service Performance: Drill into individual services to analyze latency percentiles (P50, P75, P90, P95, P99), throughput, Apdex scores, and operation rates with real-time performance charts.

Distributed Trace Analysis: Follow the complete journey of requests across services with detailed Gantt chart timelines, span attributes, and operation type filtering.

AI-Powered Insights: Get instant system health analysis, anomaly detection, and optimization recommendations from the AI Assistant with context-aware data analysis.

Agent Fleet Management: Manage and monitor your OpenTelemetry collectors with real-time topology views, configuration management, metrics dashboards, and centralized log collection.

Built for Modern Platforms
From Kubernetes to serverless, gain real-time visibility with zero heavy lifting:
Kubernetes & Containers
- Autoscaling insights
- Pod restart tracking
- Resource bottleneck detection
- OTel + kube integrations without the YAML jungle
APM & Backend Services
- Latency, errors, throughput, and saturation in one place
- Trace + log correlation makes RCA straightforward
- Real-time performance monitoring
SLOs & Alerting
- Define SLOs on any metric
- Route alerts to Slack/PagerDuty
- Reduce noise with multi-signal rules
Cost Under Control — No Surprises
Transparent pricing so you always know what you're paying for — no hidden fees, no guesswork, just predictable costs.
Price by Telemetry
Pay just for the telemetry you care about. Our pricing is transparent and based on how many logs, spans, and metric data points you send — not bytes stored or seat count. Send all the metadata you need without hidden costs.
Cost Control
Use OpenTelemetry agents and the OTEL Collector's pipelines to manage ingestion, downsampling, and routing. Keep costs predictable while retaining what matters.
World Class Observability
Our customers praise IyziTrace as a powerful platform with excellent user experience and support. IyziTrace simplifies observability for every developer, providing deep insights into logs, metrics, and traces — because details matter.
Architecture
IyziTrace is deployed as a Grafana Plugin and connects to:
- Tempo: For distributed tracing data
- Loki: For log aggregation and querying
- Prometheus: For metrics collection and querying
Platform Features Gallery
IyziTrace provides a comprehensive set of features designed to give you complete visibility into your distributed systems:
Infrastructure & Service Topology
1. Overview – Regions & Infrastructures
See your entire infrastructure at a glance. The overview page presents regions, infrastructure hosts with CPU/memory metrics, services grouped by infrastructure, and operations — all in a single scrollable view with advanced filtering.
- Regions with health status indicators
- Infrastructure cards with real-time CPU & memory usage
- Service cards grouped by infrastructure host
- Operations grouped by service
- Full filter panel with service, type, operation, status, labels, and fields
2. Overview – Operations & Data Table

Drill down into operation-level details and view all infrastructure data in a sortable, expandable table. Expand any infrastructure to see its services, and expand services to see operations with detailed metrics.
- Operation cards grouped by service
- Expandable data table with status, error/warning/degraded ratios
- Per-service metrics: Type, Port, Avg, Min, Max, P50–P99, Calls, Calls/s, Operations
3. Service Map – Infrastructure Topology
Visualize your entire infrastructure topology with interactive region-based grouping. Click any infrastructure node to see its details including IP address, OS version, type, resource usage, health status, and connected applications.
- Region-based infrastructure grouping
- Infrastructure detail drawer with resources and applications
- Health status indicators (healthy, warning/degraded, error)
- Minimap for navigation
4. Service Map – Dependency Graph

View the complete service dependency graph for any infrastructure. See all services and their interconnections with metrics including average latency, min/max latency, calls count, and status badges.
- Full service dependency visualization
- Service detail drawer with operations list
- Quick navigation to Logs, Metrics, and Traces
- Fullscreen mode for detailed analysis
5. Service Map – Detailed View

Zoom into specific service connections with detailed metrics per node. Each service card shows average/min latency, calls count, operation types (HTTP, RPC, MESSAGING, etc.), and health status.
- Per-service metrics on every node
- Operation type badges
- Connection lines showing request flow
- Service info panel with full details
Performance Monitoring
6. Services Overview

Track all services with summary cards showing average, min, and max latency along with call counts. Below, interactive charts display request rates, error rates, and duration percentiles (P50) over time, with a sortable services table.
- Service summary cards with latency metrics
- Requests chart (stacked bar chart per service)
- Errors chart (line chart per service)
- Duration chart with configurable percentiles
- Sortable services table with Type, Port, Avg/Min/Max Latency, Requests, Calls/s, Operations, Status, and Error Ratio
7. Service Detail – Call Metrics
Analyze detailed call metrics for any service. View operation count, total call count, max/min latency spans, and interactive charts for latency percentiles (P50, P75, P90, P95, P99), operation rate, Apdex score, and key operations.
- Summary cards: Operation Count, Total Call Count, Max/Min Latency Span
- Latency chart with P50–P99 percentiles
- Operation Rate chart
- Apdex Score chart
- Key Operations chart
8. Service Detail – Operations Tab

Switch to the Operations tab to see per-operation latency breakdown with P50 tooltips, operation rates, and Apdex scores — all with interactive time-series charts.
- Per-operation P50 latency visualization
- Operation-level performance breakdown
- Time-correlated charts for comparison
Distributed Tracing
9. Traces Overview

View all traces across your system with summary cards showing max latency, min latency, average latency, and total span count. The trace list includes Trace ID, Service, Trace name, Duration, Start/End Time, and per-service span counts.
- Summary cards with latency statistics and span distribution chart
- Sortable trace table with service span count columns
- Clickable Trace IDs for detailed inspection
- Search and filter capabilities
10. Trace Detail
Inspect individual traces with a complete Gantt chart timeline view. Filter by operation type (HTTP, MESSAGING, CACHE, DATABASE, RPC), view parent-child span relationships, and inspect span details including attributes, resources, and events.
- Trace header with root service, duration, timestamp, and span count
- Operation type filter chips
- Gantt chart with color-coded spans and status codes
- Span Details panel: Span Name, Span ID, Start Time, Duration, Service, Span Kind, Status Code
- Expandable attribute groups: app, network, peer, server, rpc, thread, type, operation, host
Log Management
11. Centralized Log Explorer

Search, filter, and inspect logs from any service. Expand any log entry to see the full message, telemetry information (SDK, version, language), basic information, runtime details, and additional attributes with clickable trace/span IDs.
- Log list with Timestamp, Level (color-coded), Service, and Message
- Expandable log detail view with structured sections
- Telemetry Information badges (SDK, Version, Language)
- Basic Information: Log ID, Timestamp, Level, Service, Namespace, Version, Host Name
- Runtime Information: OS Type, OS Description, Architecture
- Additional Attributes with clickable trace_id, otelTraceID, span_id, otelSpanID links
- Pagination controls
AI-Powered Analysis
12. AI Assistant – Chat Interface

The AI Assistant provides a full-page intelligent analysis interface. Quick action cards (Quick Overview, Service Health, Find Anomalies, Recommendations) give instant insights. Context toggles let you include Regions, Infrastructures, Applications, Services, and Operations data.
- AI Configuration status with Active/Inactive indicator
- Quick action cards for common analyses
- Context toggles for data scope selection
- Model selector (e.g., deepseek/deepseek-chat)
- Suggested questions for quick start
- Request and token usage tracking
13. AI Assistant – Analysis Response
AI responses include structured summaries, key findings with severity indicators, and actionable recommendations. Results show token count and timestamp with copy functionality.
- Structured response format: Summary, Key Findings, Recommendations
- Severity-coded findings (🔴 critical, 🟡 warning, 🟢 healthy)
- Copy button for sharing results
- Token count and timestamp metadata
Agent Management
14. Agent Manager – Agents List

Manage and monitor all registered OpenTelemetry agents. View agent status (Online/Offline), name, version, group assignment, last seen timestamp, and labels. Search, filter by active status, and perform actions on agents.
- Agent list with Status, Name, Version, Group, Last Seen, Labels
- Search and filter controls
- "Show active only" toggle
- Delete action per agent
- Tabs: Agents, Topology, Groups, Configs
15. Agent Topology
Visualize your agent infrastructure as interactive topology cards. View agents grouped by instance or group, with metrics (Metrics count, Logs count, Throughput), and a resource tree showing Agent Groups and individual agents with online/offline status.
- Instance and Group view modes
- Agent cards with metrics and group assignment
- Resource sidebar with Agent Groups tree
- Individual agent status indicators
16. Agent Groups

Organize agents into logical groups for easier management. View group name, agent count, configuration assignment, creation/update dates, labels, and perform edit/delete actions.
- Groups table with Name, Agents count, Config, Created, Updated, Labels
- Create Group button
- Edit and Delete actions per group
17. Agent Configuration

Create and edit OpenTelemetry Collector configurations with a built-in YAML editor and live pipeline visualization. The pipeline view shows Receivers, Processors, and Exporters for Traces, Metrics, and Logs with validation status.
- YAML configuration editor with syntax highlighting
- Live pipeline visualization (Receiver → Processor → Exporter)
- Separate pipeline views for Traces, Metrics, and Logs
- Configuration validation indicator (Valid/Invalid)
- Target group selector and save functionality
18. Agent Detail – Metrics

Monitor individual agent performance with detailed telemetry metrics. View Spans Rate, Metric Points Rate, and Log Records Rate over time with interactive charts showing accepted data across receivers.
- Tabs: Overview, Config, Metrics, Logs
- Time range selection (1h, 6h, 24h)
- Receivers, Processors, Exporters breakdown
- Interactive rate charts with Min, Max, Mean statistics
19. Agent Detail – Logs

View agent-specific logs with severity filtering and search. Logs show timestamp, severity level (Info, Error), and message content for troubleshooting agent issues.
- Severity filter dropdown
- Search within logs
- Time range selection
- Color-coded log entries by severity
Inventory Management
20. Inventory Dashboard

Get a complete overview of all discovered infrastructure entities and their relationships. Summary cards show Total Entities, Total Relations, Entity Types, and Relation Types. Resource breakdown cards display Hosts, Containers, Kubernetes Pods, Services, Databases & Cache, and Messaging Systems.
- Summary cards: Total Entities (4,202), Total Relations (4,379), Entity Types (10), Relation Types (8)
- Resource breakdown: Hosts, Containers, Kubernetes Pods, Services, Databases & Cache, Messaging Systems
- All Entity Types with counts (process, container, service, host, cloud.region, etc.)
- Recent Entities list with type badges and timestamps
- Tabs: Dashboard, Tree View, Table View
21. Inventory Tree View

Explore your infrastructure hierarchy in an interactive tree structure. Navigate from cloud regions → hosts → services → containers with expandable nodes. Switch between Tree View and Category View.
- Hierarchical entity tree: cloud.region → host → services → containers
- Expand/Collapse all functionality
- Search across entities
- Tree View and Category View toggle
- Entity type badges with color coding
22. Inventory Company View

23. Inventory Service Detail

24. Inventory Table – Entities

25. Inventory Table – Relations

Customization
26. Exception Tracking

Track and analyze exceptions across services. View ExceptionType, Count, Service, Operation, Type (messaging, rpc, etc.), and ExceptionMessage with search and pagination.
27. Exception Detail

Inspect individual exceptions with full context. Quick action cards link to Service Details, Trace Graph, and Span Details. Key-Value Pairs table shows all span attributes including serviceName, host.name, traceID, spanID, messaging details, resource information, and more.
- Navigation: Previous/Next Exception
- Quick actions: View Service Details, See the error in trace graph, View Span Details
- Complete key-value pairs with clickable trace/span links
Get Started
Installation
Step 1: Install from Grafana Marketplace
- Log in to your Grafana instance
- Navigate to Configuration → Plugins
- Search for "IyziTrace"
- Click Install
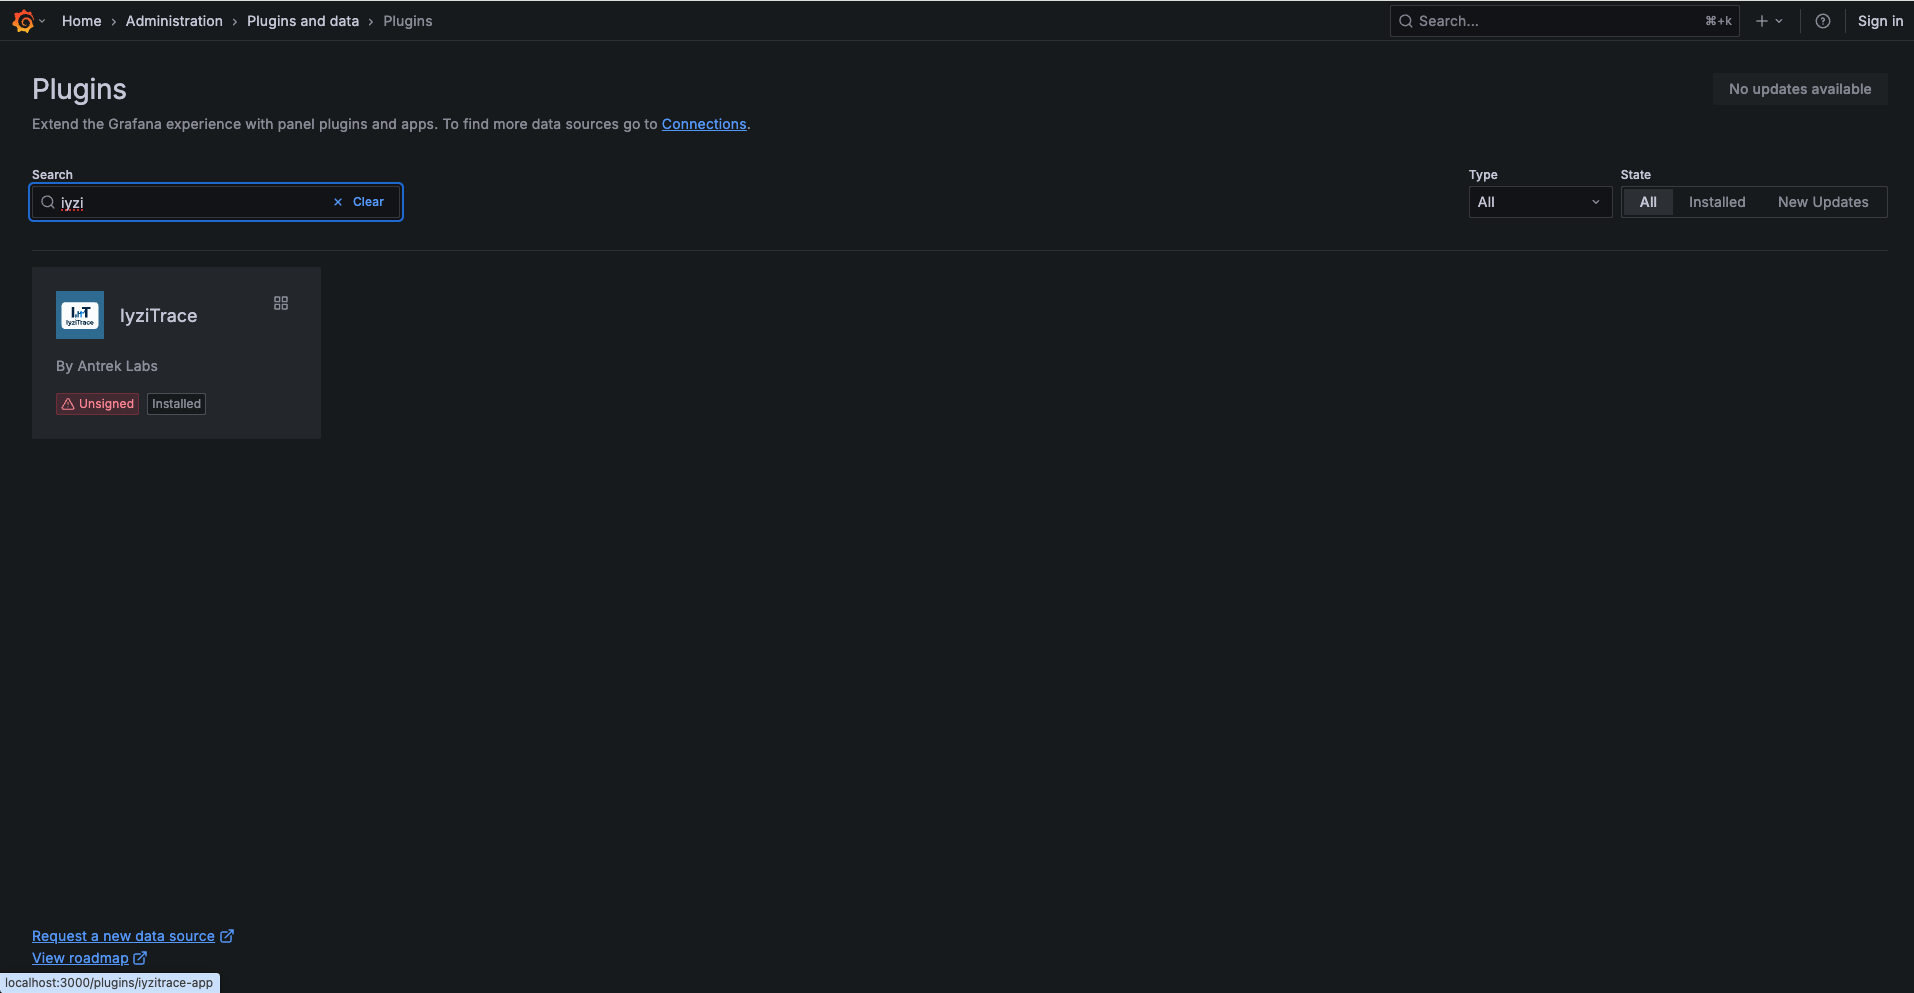
Alternatively, install via CLI:
grafana-cli plugins install iyzitrace-app
Step 2: Enable the Plugin
- Go to Configuration → Plugins
- Find IyziTrace in your installed plugins
- Click Enable
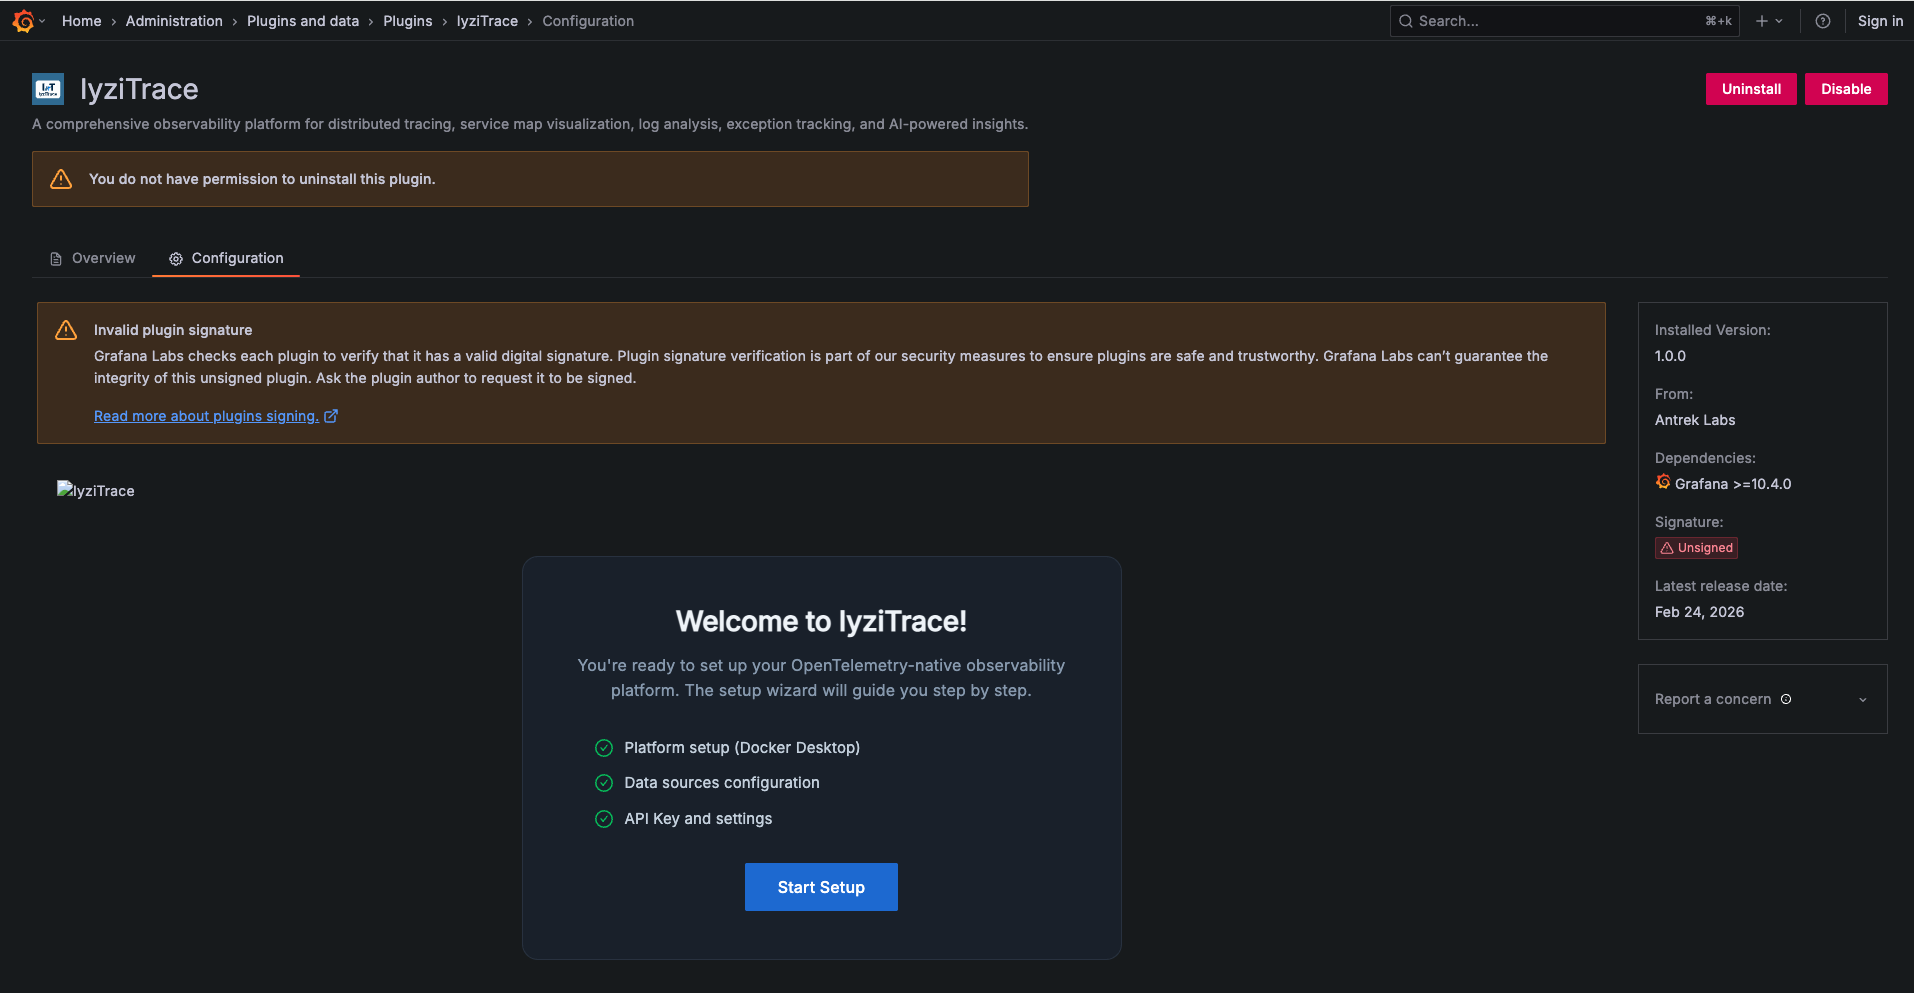
Setup Wizard
IyziTrace includes a guided setup wizard to get you started quickly:
Step 1: Platform Connection

Connect to your IyziTrace Observability Platform:
- Enter your Platform URL (e.g.,
http://localhost) - Choose Authentication Type: Open Access or API Key Protected
- If API Key Protected, enter your Platform API Key
- Click Verify Connection to test connectivity
- Click Continue to proceed
Step 2: Configure Data Sources

Automatically configure Prometheus, Loki, and Tempo data sources:
- Review the auto-detected data source endpoints
- Click Configure Data Sources to set them up in Grafana
- Verify all data sources show green checkmarks
- Click Continue to proceed
Step 3: Verification

The wizard verifies your setup:
- Check that all data sources are properly connected
- Verify data is flowing through the platform
- Click Finish to complete the setup
Initial Configuration
After completing the setup wizard, you can fine-tune your configuration in Settings:

Settings Tabs:
- Platform: Configure platform URL and authentication
- Data Sources: Manage Prometheus, Loki, and Tempo connections
- AI: Configure AI assistant with OpenRouter API key and model selection
- Definitions: Define metric and label patterns
- Privacy: Privacy and data handling settings

Quick Start Guide
Once configured, you'll see the Home Page with module status and views:

Module Status shows active modules (e.g., 10/11 active), and Section Cards provide quick navigation:
- Overview – Infrastructure & service topology
- Service Map – Visual dependency graph
- Services – Performance monitoring
- Traces – Distributed trace analysis
- Logs – Centralized log management
- Exceptions – Exception tracking
- AI Assistant – AI-powered insights
- Teams – User & team management
- Agents – OpenTelemetry agent management
- Inventories – Infrastructure inventory
Each card shows Explore and Active/Inactive status. Below, the Views section shows saved monitoring views with live metrics.
Key Concepts
Resources
In IyziTrace, everything revolves around resources. A resource represents a component in your system:
- Infrastructure: Physical or virtual hosts (e.g., servers, containers)
- Services: Applications or microservices running on infrastructure
- Operations: Individual functions or API endpoints within services
Resources follow OpenTelemetry semantic conventions and include attributes like:
cloud.regionhost.namehost.ipos.typeservice.nameservice.version
Service Infrastructure Mapping
IyziTrace automatically discovers relationships between services and infrastructure:
- Auto-Discovery: Based on
host_nameandcloud_regionlabels - Manual Mapping: Drag-and-drop orphan services to infrastructure
- Persistent Mapping: Mappings are saved and persist across sessions
Time Picker

All views support flexible time range selection:
- Quick Ranges: Last 5 minutes, 15 minutes, 30 minutes, 1 hour, 3 hours, 6 hours, 12 hours, 24 hours, 2 days
- Custom Range: Select specific start and end times with absolute date-time picker
- Relative Ranges: "now-1h" to "now"
Time ranges are preserved when navigating between views.
Filtering

IyziTrace provides powerful filtering capabilities:
- Service: Filter by service name
- Type: Filter by service type
- Operation: Filter by operation name
- Status: Filter by health status
- Exception Type: Filter by exception type
- Labels: Add custom label filters
- Fields: Add custom field filters
- Options: Limit, Interval, Page Count, Order By, Direction
- Apply / Reset: Apply filters or reset to defaults
Features
Landing Page
The Home Page provides an at-a-glance overview of your observability setup.
Key Features:
- Module Status: Shows active module count (e.g., 10/11 active)
- Section Status Cards: Quick view of all modules with Active/Inactive status
- Overview, Service Map, Services, Traces, Logs, Exceptions, AI Assistant, Teams, Agents, Inventories
- Quick Navigation: Click "Explore" on any card to jump to that section
- Views Section: Saved monitoring views with live metric panels
- Overview Dashboard, Top Services, Trace Metrics, Log Statistics, Exception Summary, Topology Snapshot
- Each view shows live metrics refreshed in real-time
Overview
The Overview page provides a comprehensive view of your entire infrastructure and service topology.
Layout:
The page is organized into horizontal scrollable sections:
- Regions: Cloud regions with health indicators (Healthy, Error)
- Infrastructures: Host cards with OS type, CPU usage, memory usage, and Applications button
- Services: Services grouped by infrastructure with type badges, avg duration, and calls/sec
- Operations: Operations grouped by service with expandable details
Data Table Features:
- Expandable rows: Infrastructure → Services → Operations
- Columns: Name, OS Version, IP Address, Type, Status, Error Ratio, Warning Ratio, Degraded Ratio
- Service sub-table: Name, Type, Port, Sum, Avg, Min, Max, P50–P99, Calls, Calls/s, Ops, Status
Service Map
The Service Map provides a visual representation of service dependencies and data flow.
Two Views Available:
1. Infrastructure Topology Map
Shows infrastructure nodes grouped by region with health status:
- Region-based grouping (e.g., Linux-farm, Onprem)
- Infrastructure cards with health badges (HEALTHY, ERROR)
- Click any node to open detail drawer with:
- Infrastructure info (IP Address, OS Version, Type)
- Resources (CPU, Memory, Usage)
- Health status with monitoring status
- Applications list
- "View Services Map" link
2. Service Dependency Map
Detailed service dependency graph showing all connections:
- Service nodes with metrics (Avg Lat, Min Lat, Max Lat, Calls)
- Connection lines showing request flow
- Service detail drawer with:
- Service Info (Name, Type)
- Metrics (Avg Lat, Min Lat, Max Lat)
- Health status
- Operations list with type badges and latency
- Quick links: Logs, Metrics, Traces
Services
The Services page provides comprehensive performance monitoring.
Service Summary Cards:
- Each service shows: Avg. Lat, Min. Lat, Max. Lat, Count
- "View full details" link for each service
Performance Charts:
- Requests: Stacked bar chart showing request volume per service
- Errors: Line chart showing error rates per service
- Duration: Line chart with configurable percentiles (P50, P90, P95, P99)
Services Table:
- Columns: Name, Type, Port, Avg Latency, Min Latency, Max Latency, Requests, Calls Per Second, Operations, Status, Error Ratio, Warning Ratio
- Expandable rows to see operations within each service
- Search and sort capabilities
Service Detail:
Click any service to see detailed analytics:
- Summary cards: Operation Count, Total Call Count, Max/Min Latency Span
- Call Metrics tab: Latency (P50–P99), Operation Rate, Apdex Score, Key Operations
- Operations tab: Per-operation latency breakdown
Traces
The Traces page helps you analyze distributed traces across your microservices.
Summary Cards:
- Max Latency, Min Latency, Avg Latency, Total Span Count
- Mini chart showing span distribution
Trace List:
- Columns: TraceId, Service, Trace, Duration, Start Time, End Time, per-service span counts
- Clickable Trace IDs for detailed view
- Search bar for filtering
Trace Detail:
Click any trace to see:
- Trace header: Trace ID, root service, duration, timestamp, total spans
- Operation Type Filters: HTTP, MESSAGING, CACHE, DATABASE, RPC
- Gantt Chart Timeline: Visual span timeline with:
- Color-coded spans by status (200, 308, etc.)
- Parent-child relationship indentation
- Duration labels on each span
- Span Details Panel:
- Span Name, Span ID, Start Time, Duration
- Service, Span Kind, Status Code String
- Tabs: Span Attrs, Resource, Events
- Expandable attribute groups: app, network, peer, server, rpc, thread, type, operation, host
Logs
The Logs page provides powerful log aggregation and search capabilities.
Log Stream:
- Columns: Timestamp, Level (color-coded), Service, Message
- Expandable log entries with detailed view
- Pagination with configurable page size
Expanded Log Entry:
- Message: Full log message content
- Telemetry Information: SDK badges (Telemetry SDK, SDK Version, SDK Language)
- Basic Information: Log ID, Timestamp, Level, Service, Service Namespace, Service Version, Host Name
- Runtime Information: OS Type, OS Description, Architecture
- Additional Attributes: Complete key-value pairs with clickable links for trace_id, otelTraceID, span_id, otelSpanID, cloud_region, code_file_path, code_function_name
Views
The Views section (on the Home page) allows you to save and manage custom monitoring views.
Creating a View:
- Navigate to any page (e.g., Overview, Services, Traces)
- Apply your desired filters
- Click Save View button
- Enter a name and description
- Click Save
View Cards: Each saved view shows:
- View name and page type
- Created date
- Live metric panels with real-time data
- View, Edit, Delete actions
Available View Types:
- Overview Dashboard: Regions, Infrastructures, Healthy Services, Traces
- Top Services: Service-specific latency metrics
- Trace Metrics: Total Traces, Avg Latency, Max Latency, Total Spans
- Log Statistics: Total Logs, log level breakdown
- Exception Summary: Total Count, exception type breakdown
- Topology Snapshot: Regions, Infrastructures, Applications, Services
Exceptions
The Exceptions page helps you track and analyze errors across services.
Exception List:
- Columns: ExceptionType, Count, Service, Operation, Type, ExceptionMessage
- Color-coded type badges (messaging, rpc, etc.)
- Clickable exception types for detail view
- Search and pagination
Exception Detail:
Click any exception to see:
- Exception type and message header
- Event ID and timestamp
- Quick Actions:
- View Service Details
- See the error in trace graph
- View Span Details
- Key-Value Pairs: Complete span attributes including:
- serviceName, host.name, traceID, spanID
- Messaging details (client, consumer group, operation, system, destination)
- Resource details (container.id, host.arch, os.type, os.description)
- Previous/Next Exception navigation
AI Assistant
The AI Assistant provides intelligent insights and recommendations powered by AI.
Features:
1. Full-Page Analysis Interface
- Configuration Status: API key status (Active/Inactive)
- Quick Action Cards: Quick Overview, Service Health, Find Anomalies, Recommendations
- Context Toggles: Enable/disable Regions, Infrastructures, Applications, Services, Operations
- Model Selection: Choose AI model (e.g., deepseek/deepseek-chat)
- Usage Tracking: Request count and token usage
2. Suggested Questions
Pre-built questions for quick start:
- "What services have the highest latency?"
- "Are there any critical issues?"
- "Show me error rate trends"
- "Which services are degraded?"
- "Analyze infrastructure health"
3. AI Analysis Response
Structured responses with:
- Summary: Overview of findings
- Key Findings: Severity-coded items (🔴 critical, 🟡 warning, 🟢 healthy)
- Recommendations: Numbered action items
- Token count and timestamp
- Copy button for sharing
Agent Manager
The Agent Manager provides comprehensive management of OpenTelemetry collectors.
Agents Tab:
- All registered agents with Status, Name, Version, Group, Last Seen, Labels
- Search agents and filter by active status
- Delete action per agent
- Click any agent to open the detail drawer
Agent Detail Drawer:
The drawer provides four tabs:
Overview: Agent basic information and status
Config: Current configuration details

Metrics: Telemetry performance metrics
- Spans Rate, Metric Points Rate, Log Records Rate
- Receivers, Processors, Exporters tabs
- Interactive charts with Min, Max, Mean statistics
Logs: Agent-specific logs
- Severity filtering (All Severities, Info, Error, etc.)
- Search within logs
- Time range selection (1h, 6h, 24h)
Topology Tab:
- Visualize agents as interactive topology cards
- Instance and Group view modes
- Resource sidebar with Agent Groups tree
- Per-agent metrics (Metrics, Logs, Throughput)
Groups Tab:
- Organize agents into logical groups
- Group details: Name, Agent count, Config, Created, Updated, Labels
- Create, Edit, and Delete groups
Configs Tab:
- YAML configuration editor with syntax highlighting
- Live pipeline visualization (Receiver → Processor → Exporter)
- Pipeline views for Traces, Metrics, and Logs
- Validation status indicator
Inventory Manager
▶️ Inventory Manager Demo (video)
The Inventory Manager provides complete infrastructure discovery and relationship tracking.
Dashboard Tab:
- Summary cards: Total Entities, Total Relations, Entity Types, Relation Types
- Resource breakdown: Hosts, Containers, Kubernetes Pods, Services, Databases & Cache, Messaging Systems
- All Entity Types with counts
- Recent Entities list with type badges
Tree View Tab:
- Hierarchical entity tree (cloud.region → host → services → containers)
- Expand/Collapse all functionality
- Entity search
- Tree View and Category View toggle
Table View Tab:
- Tabular view of all entities with sortable columns
- Entity detail view with full attribute list
- View all entity relationships
- Source, Relation Type, and Target columns
Configuration
Settings
Access settings via the Settings menu item.
Tabs:
- Platform: Platform URL and authentication settings
- Data Sources: Configure Prometheus, Loki, and Tempo connections
- AI: Configure AI assistant (OpenRouter API key, model, temperature, max tokens)
- Definitions: Define metric and label patterns
- Privacy: Privacy and data handling settings
Datasources
Default Datasources:
- Prometheus (Observability Platform): Primary metrics source
- Loki (Observability Platform): Primary logs source
- Tempo (Observability Platform): Primary traces source
All data sources are automatically configured through the platform with endpoints pointing to the Observability Platform query APIs.
Definitions
Define how IyziTrace interprets your metrics:
Label Definitions:
- Service Label Name: Label for service names (default:
service_name) - Operation Label Name: Label for operation names (default:
span_name) - Type Label Name: Label for operation types (default:
span_kind)
Metric Definitions:
Add custom metrics for:
- Latency metrics (e.g.,
http_request_duration_seconds) - Error metrics (e.g.,
http_requests_total{status="5xx"}) - Throughput metrics (e.g.,
http_requests_total)
AI Configuration
API Key:
- Enter your OpenRouter API key
- Key is stored securely in Grafana
- Required for AI Assistant features
Model Settings:
- Model: Select AI model (GPT-4, Claude, DeepSeek, etc.)
- Temperature: Controls randomness (0.0-1.0)
- Max Tokens: Maximum response length
Access Control
Teams
IyziTrace supports multi-tenancy through teams.

Creating a Team:
- Navigate to Teams
- Click Create Team
- Enter:
- Team Name: Unique identifier
- Display Name: Human-readable name
- Description: Team purpose
- Click Save
Team Detail:

Page Permissions
Control which pages team members can access:

Available Pages:
- Home
- Overview
- Service Map
- Services
- Traces
- Logs
- Exceptions
- AI Assistant
- Teams
- Settings
- Agent Manager
- Inventory Manager
Permission Levels:
- Admin: Can access all pages and manage teams
- User: Can access assigned pages only
- No Access: If a team has no page assignments, they see all pages (default behavior)
Advanced Features
Service-Infrastructure Mapping
Auto-Discovery:
IyziTrace automatically maps services to infrastructure based on:
- Host Name Matching: If service and infrastructure share same
host_name - Cloud Region Matching: If they're in the same
cloud_region
Manual Mapping:
For services that can't be auto-mapped:
- They appear in "Orphan Services" section
- Drag the service card
- Drop it on target infrastructure
- Mapping is saved persistently
Orphan Services
What are Orphan Services?
Services discovered in your telemetry but not mapped to any infrastructure:
- Services without matching
host_name - Services from external systems
- Services in different regions
- Manually instrumented services
Why Map Them?
Mapping orphan services:
- Completes your topology view
- Enables infrastructure-level filtering
- Shows complete dependency graph
- Improves resource attribution
Search and Filter
Global Search:
Each section supports search:
- Real-time: Results update as you type
- Case-insensitive: Matches regardless of case
- Contains logic: Matches partial strings
- Multi-field: Searches across multiple fields
API Reference
IyziTrace exposes various APIs for programmatic access.
Datasource APIs
Prometheus Queries:
import { getQueryData } from './api/provider/prometheus.provider';

const data = await getQueryData('up{job="api"}');
Tempo Queries:
import { getQueryData } from './api/provider/tempo.provider';

const traces = await getQueryData('{}', startTime, endTime, limit);
Loki Queries:
import { getQueryData } from './api/provider/loki.provider';

const logs = await getQueryData('{service_name="api"}', startTime, endTime, limit);
Settings APIs
Get Plugin Settings:
import { getPluginSettings } from './api/service/settings.service';

const settings = await getPluginSettings();
Save Plugin Settings:
import { savePluginSettings } from './api/service/settings.service';

await savePluginSettings({
  serviceInfraMapping: {...},
  aiConfig: {...}
});
Service Map APIs
Get Regions:
import { getRegions } from './api/service/service-map.service';

const regions = await getRegions(filterModel);
Get Orphan Services:
import { getOrphanServices } from './api/service/service-map.service';

const orphans = await getOrphanServices(filterModel);
AI APIs
Ask AI:
import { askAI } from './api/service/ai.service';

const response = await askAI('What services have high error rates?', context);
FAQ
Q: How do I start sending data to IyziTrace?
A: Use the Setup Wizard to configure your platform connection and data sources. Then configure your applications to send:
- Traces to Tempo (via OTLP)
- Logs to Loki
- Metrics to Prometheus
Q: Why don't I see my services?
A: Ensure:
- Your datasources are connected (check Settings → Data Sources)
- Data is being sent to Prometheus/Tempo/Loki
- Metrics contain required labels (
service_name, etc.) - Check definitions in Settings → Definitions match your label names
Q: How do I map orphan services?
A: Drag the service from "Orphan Services" section and drop it on the target infrastructure card.
Q: Can I use IyziTrace without AI features?
A: Yes! AI Assistant is optional. All core features work without it.
Q: How do I manage OpenTelemetry agents?
A: Navigate to Agent Manager from the sidebar. You can view all agents, organize them into groups, create/edit configurations, monitor metrics, and view logs.
Q: What is the Inventory Manager?
A: The Inventory Manager automatically discovers and tracks all infrastructure entities (hosts, containers, services, cloud regions, etc.) and their relationships. It provides Dashboard, Tree View, and Table View for exploring your infrastructure.
Q: How are permissions enforced?
A: Permissions are enforced through team-based access control. Admins see everything; team users see only assigned pages.
Q: Can I export my data?
A: Yes:
- Tables support CSV export
- Traces can be exported as JSON
- Use the datasource APIs to fetch raw data
Q: How do I troubleshoot missing infrastructure?
A: Check that:
- Prometheus is scraping
__inv_basemetric - Host inventory is being collected
- Required labels (
host_name,cloud_region) are present
Q: What OpenTelemetry version is supported?
A: IyziTrace supports OpenTelemetry 1.0+ and is compatible with OTLP protocol.
Q: Can I customize metric definitions?
A: Yes! Go to Settings → Definitions to add custom metric patterns.
Q: How do I configure alerts?
A: Alerts are managed through Grafana's native alerting system. Create alert rules based on your datasources.
Troubleshooting
Common Issues
1. "No data found"
Symptoms: Empty pages, no services, no traces
Solutions:
- Verify datasources are connected and healthy
- Check that applications are sending data
- Confirm time range includes data
- Review datasource logs for errors
2. "Orphan services not disappearing after mapping"
Symptoms: Mapped services still show in orphan section
Solutions:
- Refresh the page
- Check plugin settings were saved
- Verify mapping API call succeeded
- Clear browser cache
3. "AI Assistant not responding"
Symptoms: AI chat shows errors or no response
Solutions:
- Verify API key is configured
- Check OpenRouter account has credits
- Test API key in OpenRouter dashboard
- Review browser console for errors
4. "Services not auto-mapping"
Symptoms: Expected services appear as orphans
Solutions:
- Verify
host_namelabel matches infrastructure - Check
cloud_regionmatches - Ensure both service and infrastructure exist
- Review auto-discovery logic in service-map.service.ts
5. "Agent Manager not showing agents"
Symptoms: Agent list is empty
Solutions:
- Verify OpenTelemetry agents are configured with OpAMP
- Check agent connectivity to the platform
- Verify platform URL is correct in Settings
- Review agent logs for connection errors
6. "Inventory showing no entities"
Symptoms: Inventory dashboard shows zero entities
Solutions:
- Verify the platform is running and accessible
- Check that telemetry data is being sent
- Ensure infrastructure discovery is configured
- Review platform logs for errors
Debug Mode
Enable debug logging:
// In browser console
localStorage.setItem('debug', 'iyzitrace:*');
This will log detailed information about:
- API calls
- Data fetching
- Rendering
- State changes
Getting Help
For additional support:
- Check this documentation
- Review GitHub Issues
- Contact support team
- Join community discussions
Navigation

IyziTrace provides a clean sidebar navigation with access to all modules:
- 🏠 Home
- 📊 Overview
- 🔗 Service Map
- 📈 Services
- 📋 Traces
- 📝 Logs
- ⚠️ Exceptions
- 🤖 AI Assistant
- 👥 Teams
- ⚙️ Settings
- 🔧 Agent Manager
- 📦 Inventory Manager
- 🌓 Light Mode toggle
Meta
Version: 1.1.0
License: Proprietary — see EULA
The plugin is distributed under the IyziTrace Grafana Plugin End-User Licence Agreement. The free edition may be used at no charge, including commercially; Demo, Pro and Max require a licence token and may be used only for the term that token names.
The IyziTrace Observability Platform is licensed separately under AGPL-3.0 with a commercial option.
Questions? Comments?
Send them to: support@iyzitrace.com
Start Observing in Minutes
No credit card required. Start your observability journey today!
Ready to get started?
- Install the IyziTrace plugin from Grafana Marketplace
- Run the Setup Wizard to configure platform and data sources
- Start sending telemetry data
- Explore your systems with powerful visualizations
- Manage your agents with the Agent Manager
- Track your inventory with the Inventory Manager
Need help? Contact us at support@iyzitrace.com
Legal & Compliance
©2026 IYZI Trace Inc. Built with ❤️ by the IyziTrace Team
Grafana Cloud
Connect any plugin in Grafana Cloud.
- 150+ data source integrations
- Grafana Assistant - AI that correlates your data, builds queries, and answers questions
- 10k Prometheus metrics + 50 GB logs, traces, and profiles on the free tier
- ...and more
Insights
- Adoption
Running on 1 active Grafana instance.
- Activity
Last updated 9 Sep 2026.
2 releases in the past year.
- Version
- 1.1.0
- Dependencies
- Grafana >=12.3.0
- Developer
- Antreklabs
Grafana Cloud
Connect any plugin in Grafana Cloud.
- 150+ data source integrations
- Grafana Assistant - AI that correlates your data, builds queries, and answers questions
- 10k Prometheus metrics + 50 GB logs, traces, and profiles on the free tier
- ...and more