In this webinar, we'll cover TraceQL, our new query language designed for distributed tracing in Grafana Tempo, its basic mechanics and how to write a query.
Learn what lessons Dutch EdTech industry leader Topicus.Education learned from deploying Grafana Enterprise and Grafana Enterprise Logs as their monitoring platform
Mambu provides a cloud banking platform to hundreds of customers in more than 65 countries. Learn why they turned to Grafana Enterprise for vendor-neutral, open source observability.
With roughly 100 million global active users, Roblox relies on Grafana, Tempo, and more to ensure that their infrastructure remains healthy and scalable
DeliveryHero turned to Grafana, Mimir, and Loki to keep their systems healthy and applications functional so that their large global ecosystem of riders, restaurants, shops, partners, and end customers remain loyal and satisfied
To monitor the global landscape of SAP HANA Cloud clusters, SAP combined Grafana Enterprise and Grafana Loki with other components in a fully automated deployment.
Learn how in the lead up to Black Friday, Emma Sleep turned to Grafana Cloud, k6, and Loki to implement an observability strategy that would ensure the best user experience and system stability.
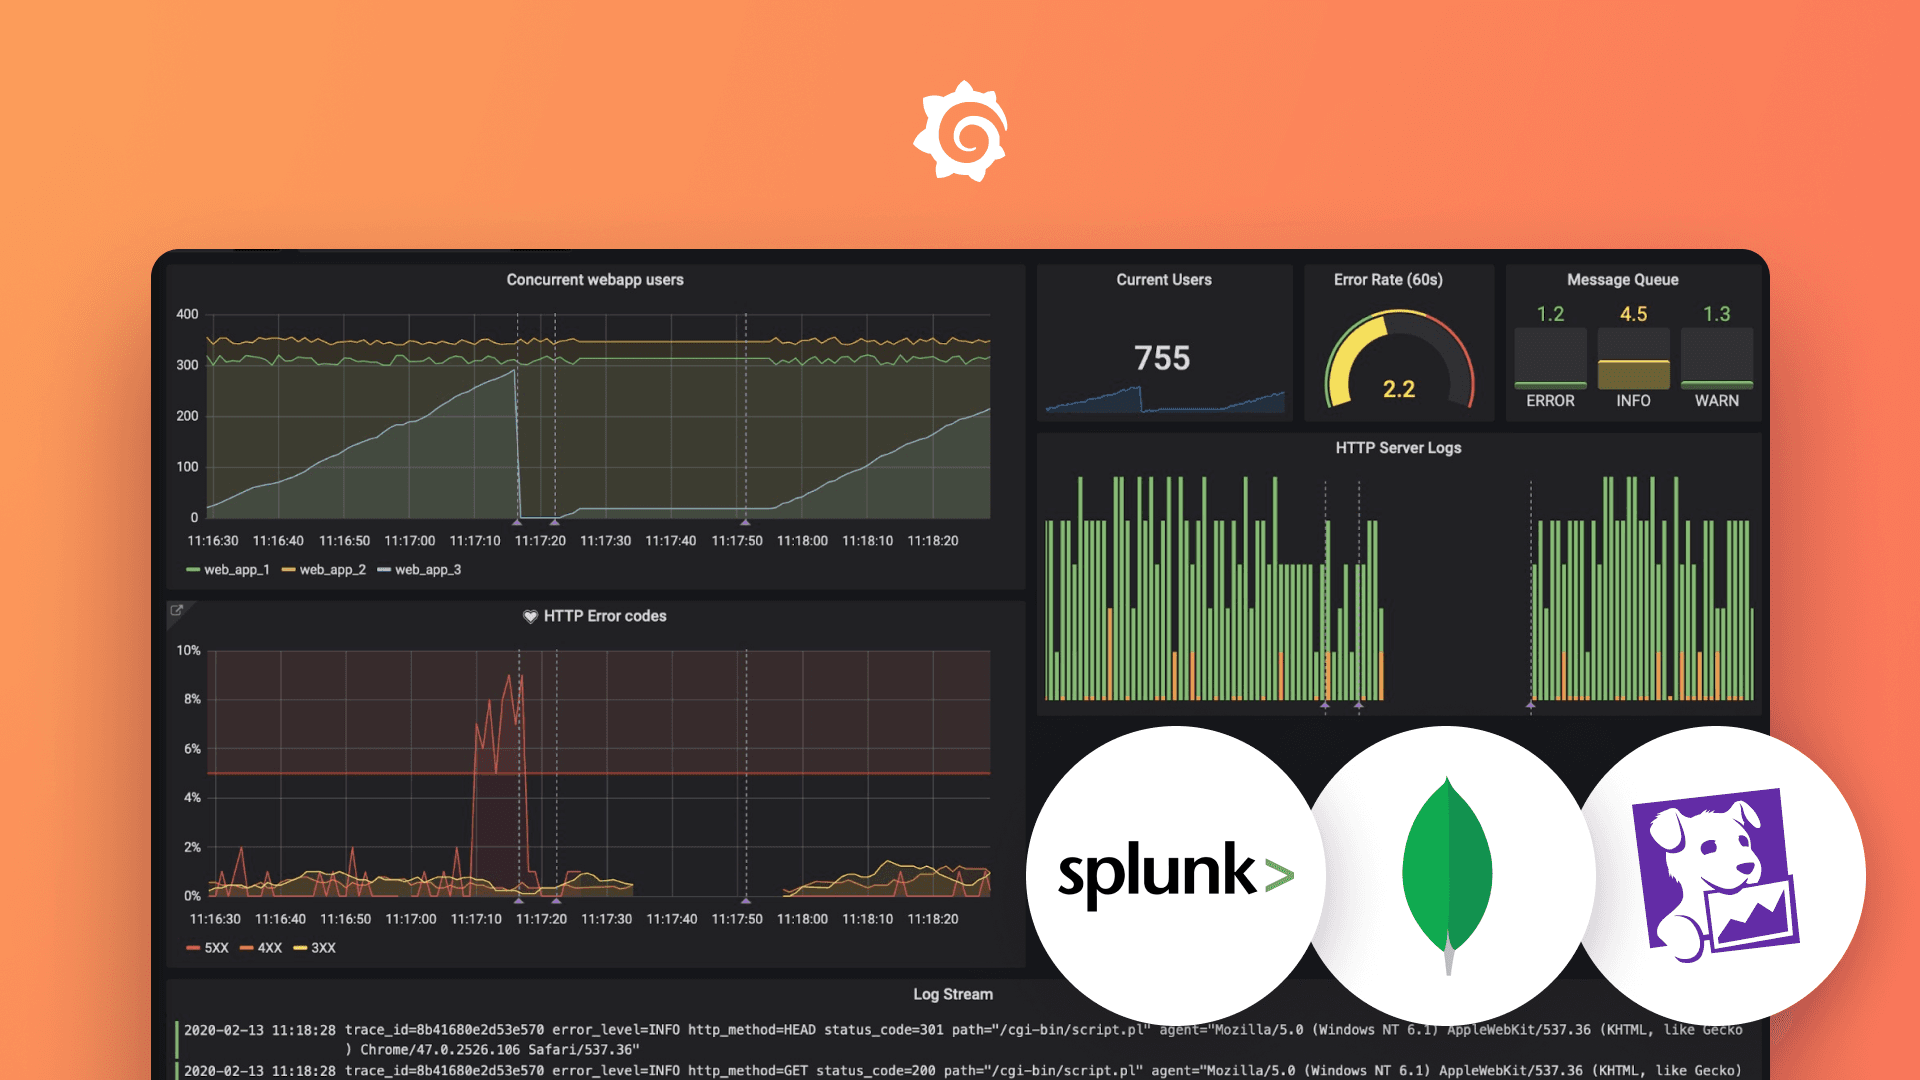
In this webinar, learn how to leverage Grafana's plugin ecosystem for access to 80+ data sources, including plugins for Datadog, Splunk, MongoDB, and more.
In this talk, the Defense Unicorns team will describe the problem space that Big Bang looks to address and demonstrate a live deployment with the Loki-Grafana-Tempo-Mimir (LGTM) stack.
In this session, Lead Site Reliability Engineers Chaya Vavilala and James Wojewoda will share how Beeswax eliminated alert fatigue, increased reliability of their monitoring infrastructure, and scaled to meet record growth with Grafana Cloud.
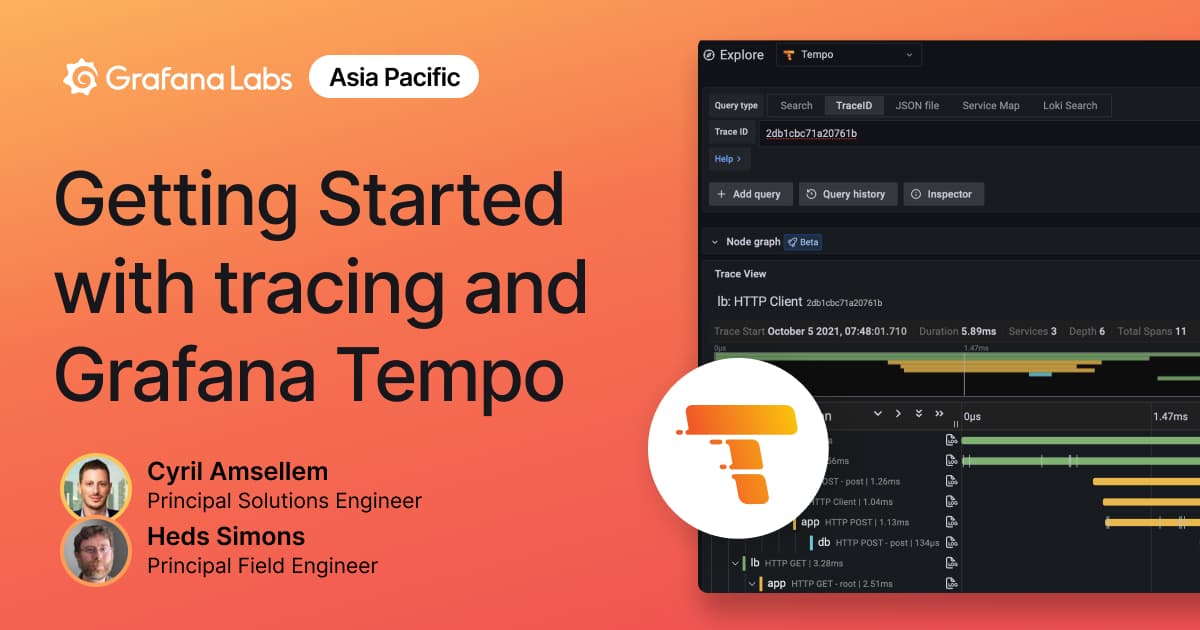
Watch this webinar to learn about distributed tracing, and how Grafana Tempo’s tracing solution is highly scalable with less operational cost and complexity.

%3Aquality(90)%2F&w=3840&q=75)








%3Aquality(90)%2F&w=3840&q=75)
%3Aquality(90)%2F&w=3840&q=75)