
Stop switching tools to find answers: Grafana Assistant now works across 30+ data sources



When you're the on-call engineer and something breaks, you can quickly find yourself deep in a series of tools you don't regularly use—switching tabs, copying query results, and manually stitching together a picture of what's happening and why.
People are increasingly turning to AI to get around this, but the results can be a mixed bag.
For example, many of today's observability, data warehousing, or project management tools come equipped with powerful AI assistants that can help you get answers quicker. But those assistants can only see the data they were built on top of. Alternatively, you could extend the AIs through MCPs or built-in integrations, but those connections don't configure or maintain themselves.
As a result, AI that is designed to reduce the cognitive load of juggling multiple tools ends up adding another silo to an already fragmented stack.
We think there's a better way.
At Grafana Labs, we've always had a "big tent" philosophy. You don’t have to migrate your data or standardize on a single vendor. Grafana connects to the tools and data sources your teams already trust and surfaces everything together. And now we're extending that same promise to AI with Grafana Assistant.
Extending Assistant to more than 30 data sources
Getting an answer usually means opening several tools and piecing the story together yourself. Assistant collapses that into one step: ask it a question, and it searches across whatever you're already using to find the answer, rather than you doing the searching.
Assistant is built on Grafana's native data source architecture. Instead of asking you to bring your data to it, it comes to your data. It currently supports more than 30 data sources, so if your teams are already querying those sources in Grafana (either through Grafana Cloud or Grafana 13), Assistant can now reason over, query, and visualize from them, too.
Observability platforms you already run
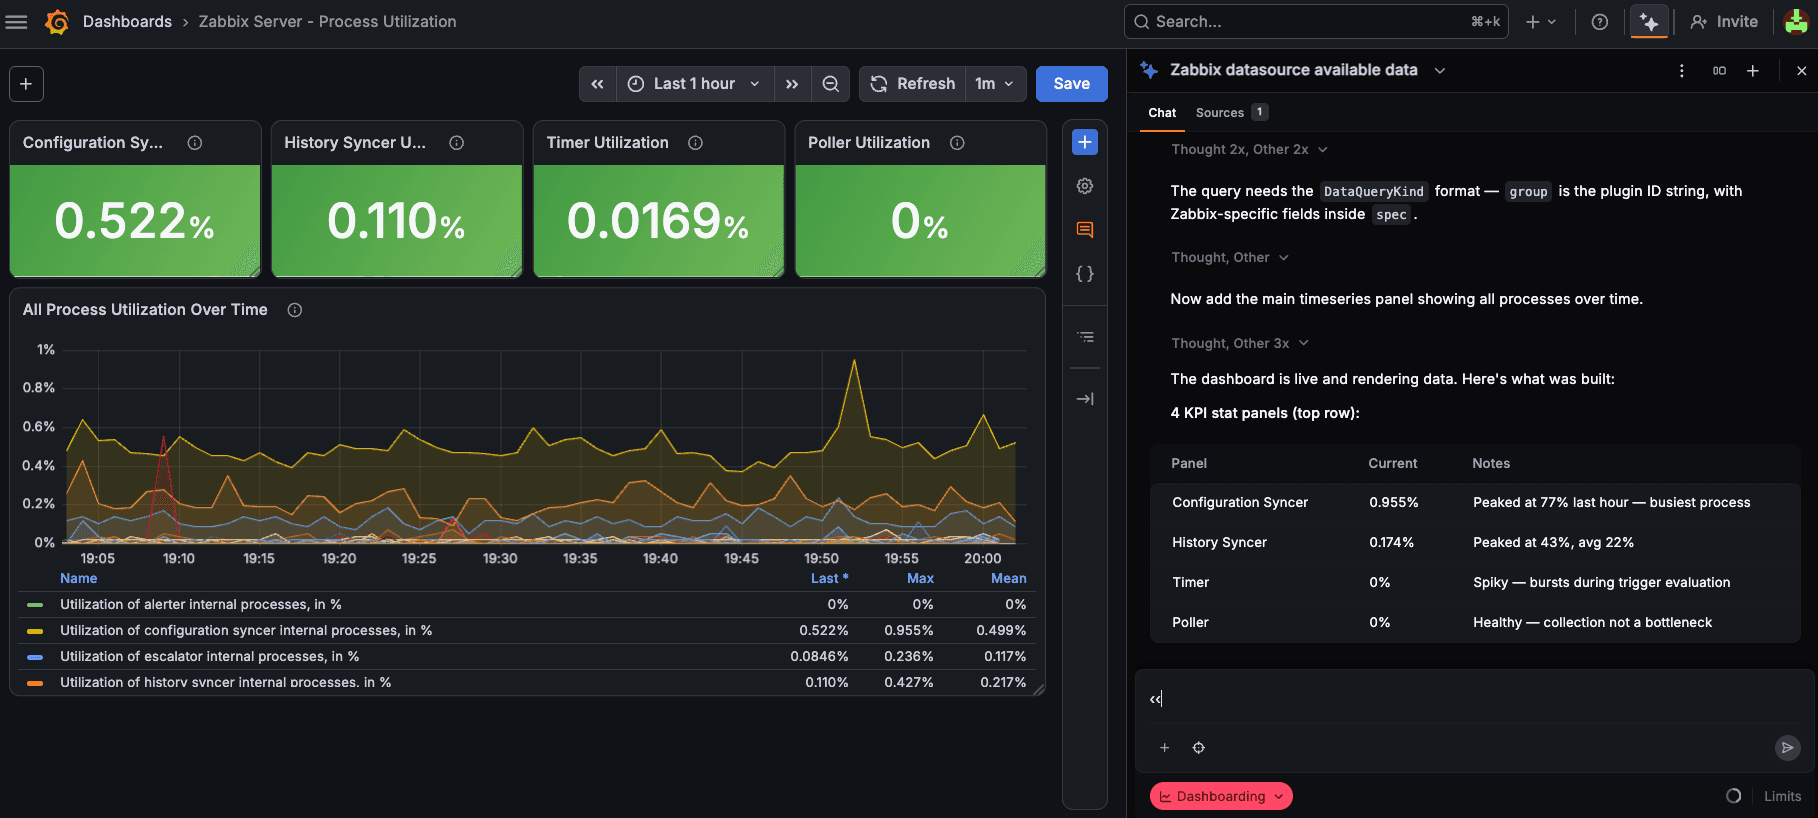
It's common for organizations to run more than one observability platform. Different teams adopt different tools, acquisitions bring new stacks, and migrations take time. Whatever the reason, your telemetry is often spread across multiple systems.
Assistant now queries directly from AppDynamics, Azure Monitor, Dynatrace, Honeycomb, New Relic, Splunk, and Zabbix. That means you can ask a single question and get answers that draw from across your entire observability stack, without context-switching or manually correlating data between platforms.
If an alert fires and you need to know whether it's isolated or showing up across systems, you shouldn't have to check each tool separately. With Assistant, you don't have to.
Note: Already have Assistant enabled? Click on the blue boxes throughout this post to test some data source prompts in your own environment.
Check whether the current alert is isolated or appearing across my New Relic, Dynatrace, AppDynamics, Honeycomb, and Zabbix data sources.
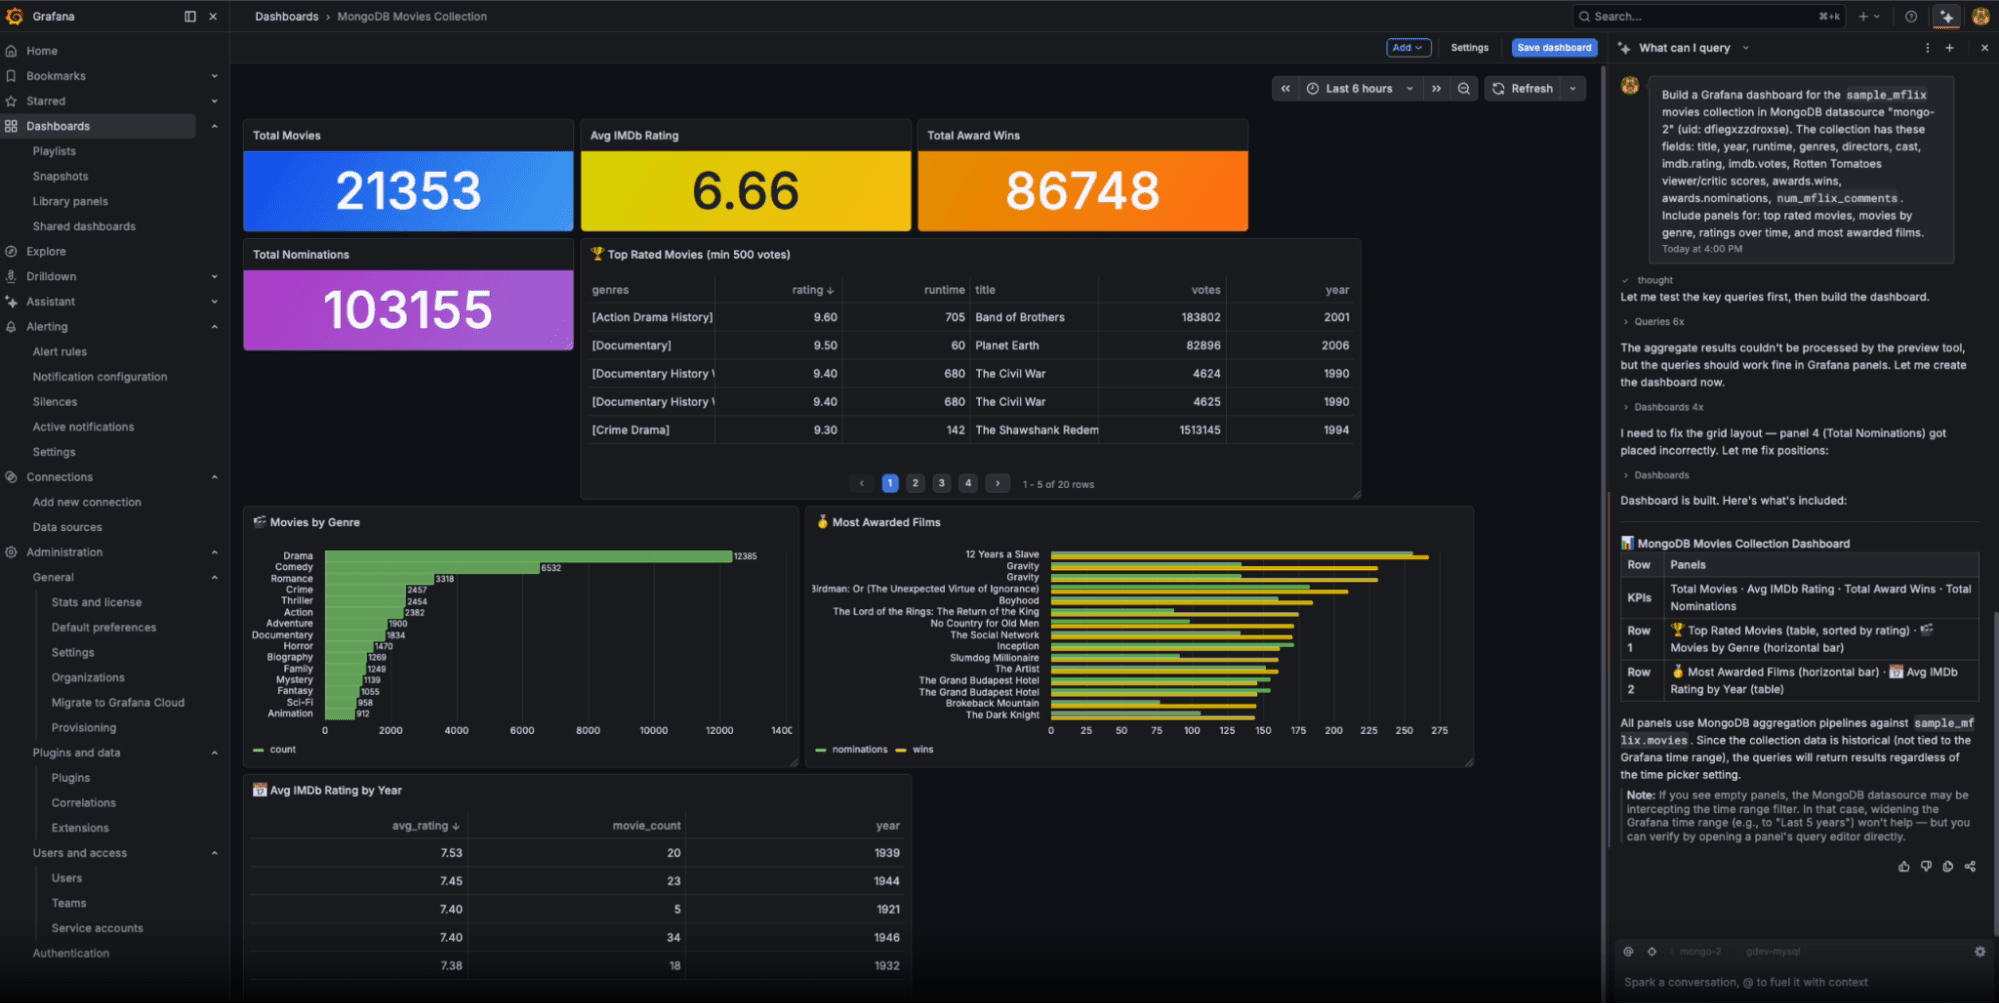
Application performance doesn't exist in isolation from the data layer. Slow queries, unexpected write volumes, and schema issues often sit upstream of the symptoms you see in your monitoring tools. Assistant now connects to MongoDB, Oracle, and Snowflake so you can bring database context into the same conversation as your metrics, logs, and traces.
Ask whether a spike in API latency correlates with query performance in Oracle. Understand how a new feature rollout is affecting write throughput in MongoDB. Surface cost trends from Snowflake alongside the infrastructure metrics that drive them. The investigation lives in one place.
Does the recent spike in API latency correlate with query performance in Oracle?
How is the latest feature rollout affecting write throughput in MongoDB?
Show cost trends from Snowflake alongside the infrastructure metrics that drive them.
Your work, connected to your systems
Assistant can query Jira without additional MCPs. That makes it possible to start connecting what your systems are doing with what your teams are working on. Which deployments happened in the same window as an incident? Which team owns the service that's throwing errors? What's the current status of the ticket tied to this alert?
These are questions that engineers answer by jumping between tools today. With Jira now available to Assistant, they're questions you can ask in a single conversation.
Which deployments happened in the same window as this incident, and what's the status of the related Jira ticket?
What you can do with it
For each of these data sources, Assistant can query and read your data using natural language, correlate signals across multiple sources in a single investigation, and visualize results directly as Grafana dashboards. You're not just getting answers in a chat window. You're getting answers you can share, pin, and act on.
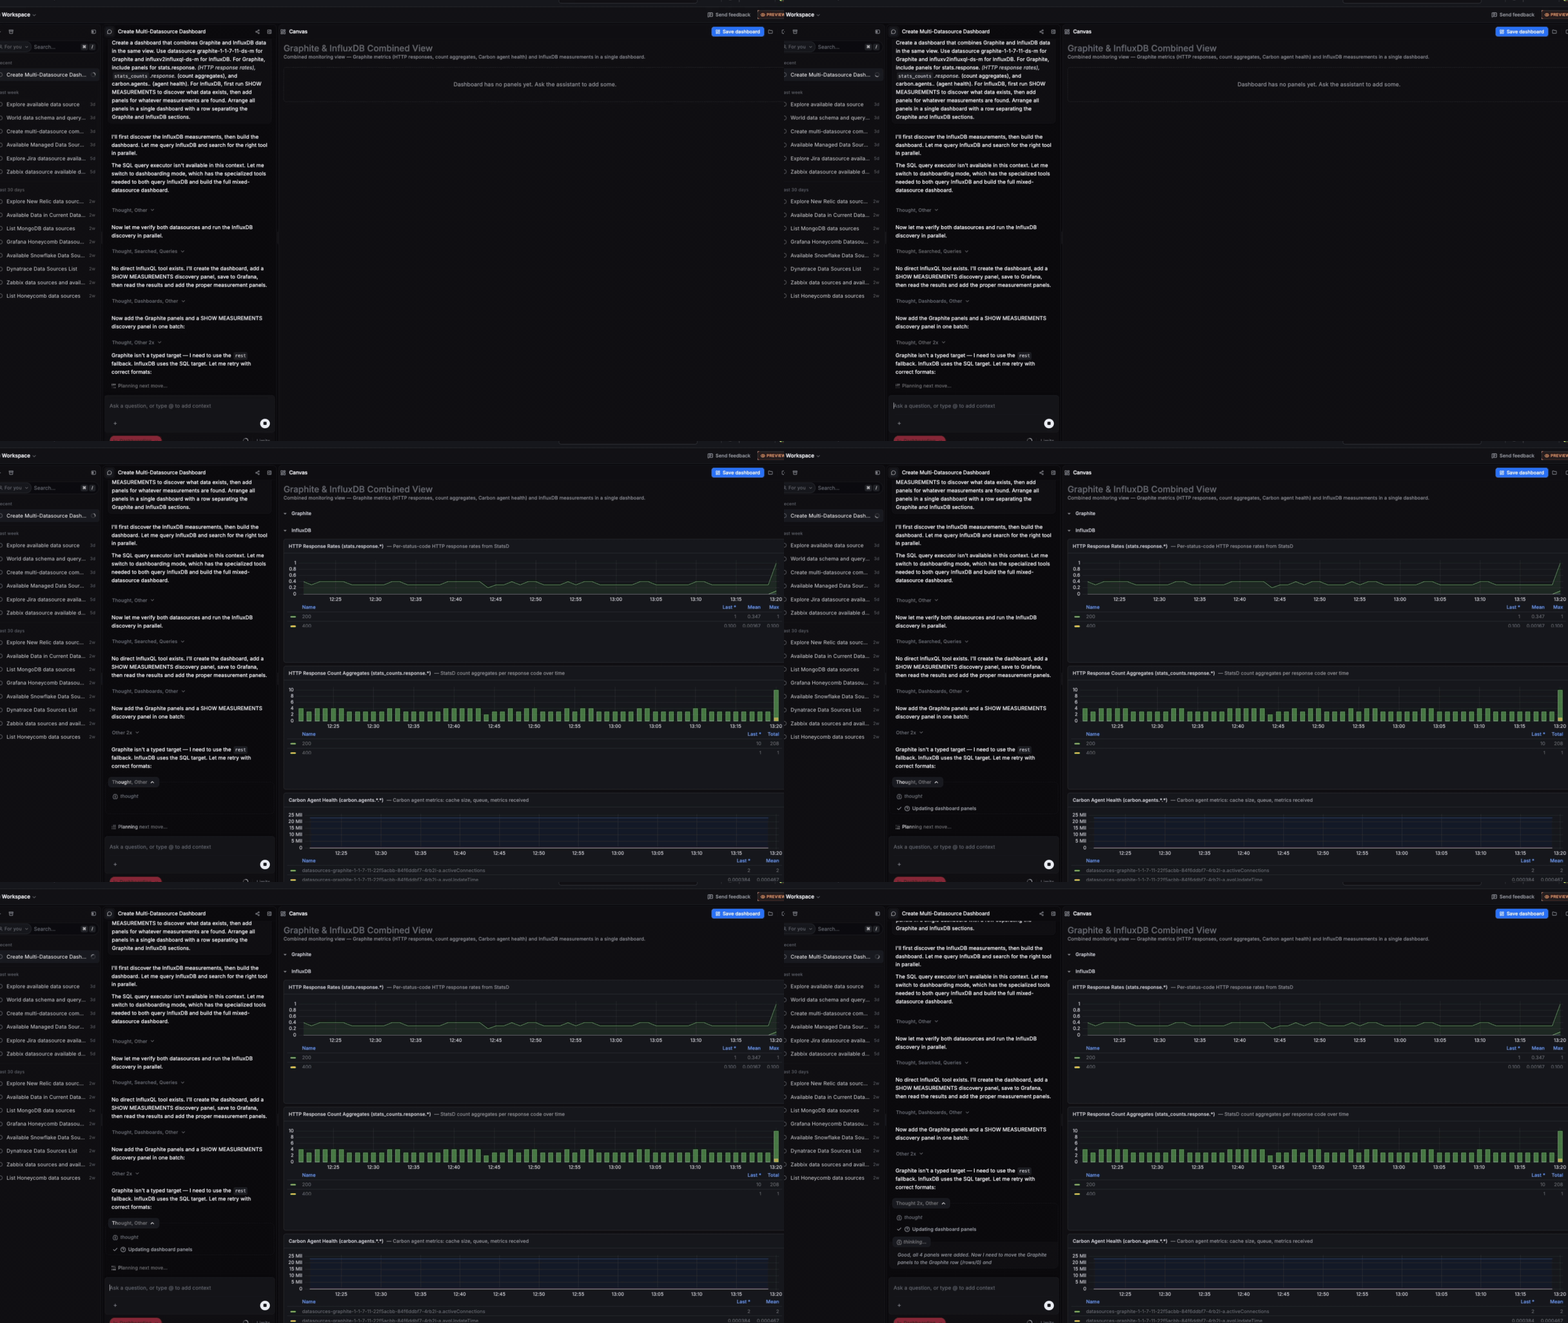
To illustrate this better, let's walk through a common scenario involving a multi-system investigation where the challenge isn't that the data doesn't exist—It's that it's scattered.
Imagine your checkout service starts throwing errors at 11 a.m. on a Tuesday. The alert fires in Grafana, so you open Assistant to ask what's happening. From there:
- Assistant pulls latency and error rate from your Dynatrace APM data, noticing a spike that started 14 minutes ago.
- You then ask it to dig deeper, and it crosses over to your MongoDB instance, where it finds a sharp increase in average query latency across the database; read and write operations are both taking noticeably longer than baseline.
- You ask Assistant whether anything changed recently and it surfaces a Jira ticket from two days ago—a schema migration that went out in the last deployment.
- You ask it to visualize all of this together, and it builds a dashboard: latency over time, database query time, the deployment marker, and the error rate, all in one view.
That investigation, which would normally mean five open tabs and 30 minutes of manual correlation, just happened in a single conversation.
And what changes isn't just speed—it's the quality of the answer. Investigations that used to end at "the service is slow" because that's as far as one tool's data would take you can now follow the thread all the way to the root cause.
My checkout service started throwing errors around 11am today. Pull latency and error rate from Dyantrace, check MongoDB query latency, find any recent deployments in Jira, and visualize it all as a dashboard.
The list keeps growing
Assistant now supports more than 30 data sources, and that number keeps growing. Every new addition is another signal your team no longer has to chase manually, another tool you no longer have to leave during an investigation, another part of your stack where AI can help you move faster.
The big tent was always about reducing fragmentation. This is what that looks like for AI.
Grafana Cloud is the easiest way to get started with metrics, logs, traces, dashboards, and more. We have a generous forever-free tier and plans for every use case. Sign up for free now!


