

Grafana 13 release: get value from your data faster, manage operations at scale, and more!
Who says 13 is unlucky? With the release of Grafana 13, we're giving the community the most streamlined, flexible, and intuitive Grafana experience yet.
Unveiled during the opening keynote of GrafanaCON 2026, the latest major release is all about helping you get value from your data faster, whether you’re spinning up dashboards, operating Grafana at scale, or extending the platform as your requirements change.
For those of you who couldn’t join us in Barcelona for GrafanaCON, you can explore some Grafana 13 highlights below and check out the Grafana 13 deep dive session when it's available on demand. (And if you want to read all the headlines from our biggest community event of the year, check out our GrafanaCON announcements blog.)
For a complete list of Grafana 13 updates, refer to our Grafana documentation, our What’s New documentation, and the Grafana changelog, and be sure to watch the TL;DR video below.

Note: If you upgraded to Grafana 13 prior to April 16, please see an important note about Git Sync in our docs.
Get meaningful insights from data faster
For many teams, the challenge isn’t collecting metrics—it’s turning that data into clear, actionable insights on demand. Too often, valuable data exists, but the path to a useful dashboard is slow or uncertain.
That’s why with Grafana 13 we’ve been focused on helping you move from a blank canvas to meaningful visualizations and insights in just a few clicks. Here's how:
Use pre-built dashboards based on your data
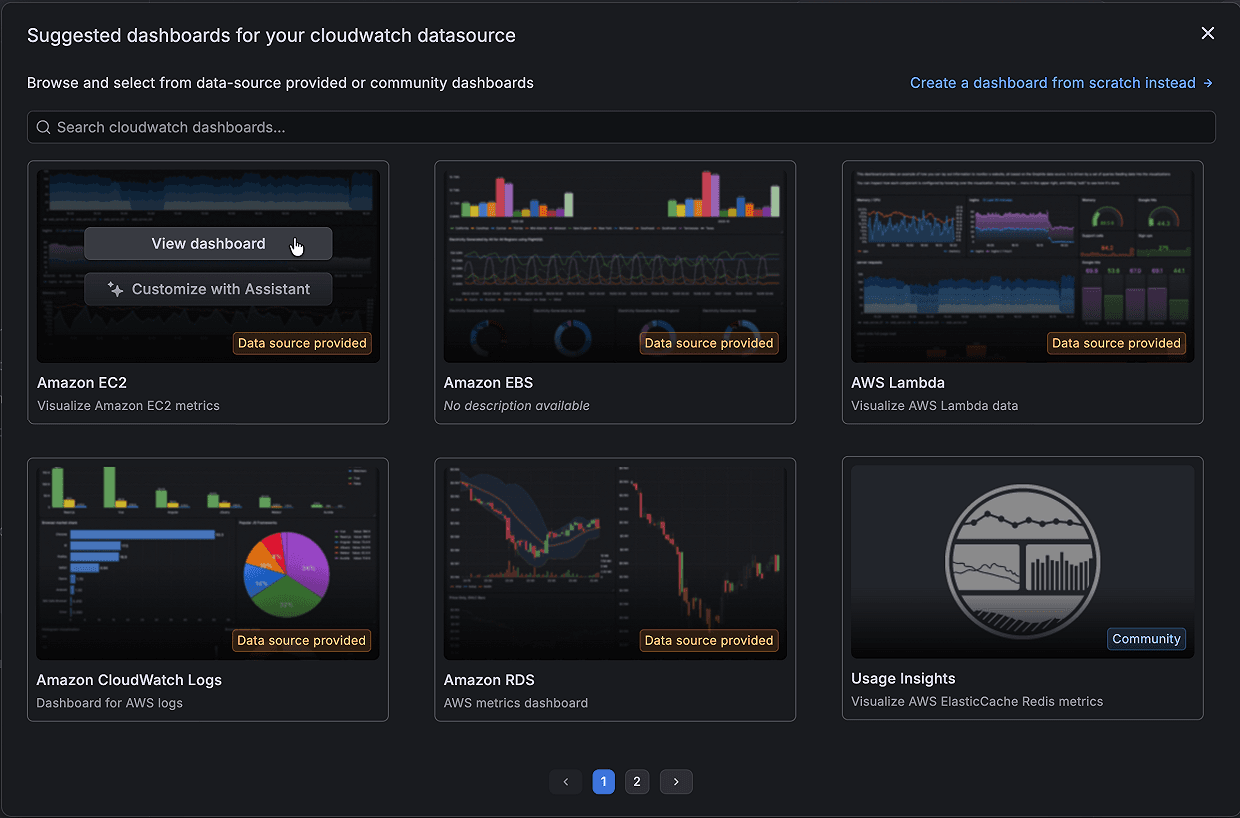
With suggested dashboards in Grafana, you can access pre-built dashboards that are tailored to your specific data sources. In Grafana 13, we’ve made significant improvements to make these dashboards even easier to find, evaluate, and use.
Grafana will automatically surface suggested dashboards for you if there is an existing dashboard available for your data source. (Instead of the Build a dashboard button, you will be able to choose a From suggestions option.)
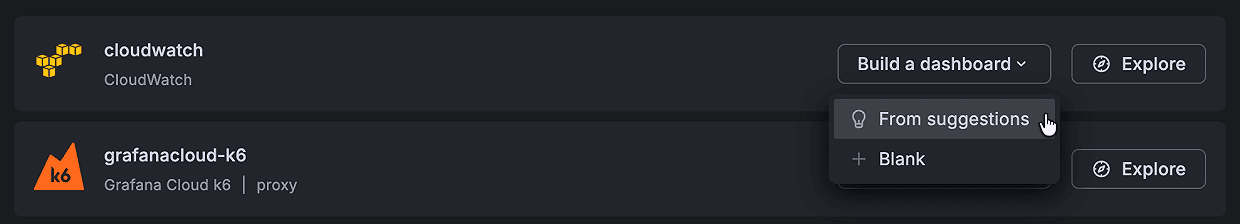
From there, you will see a curated list of provisioned dashboards that Grafana Labs will maintain for supported data sources alongside community dashboards you can reference, with built-in search capabilities to help you find specific dashboards quickly.
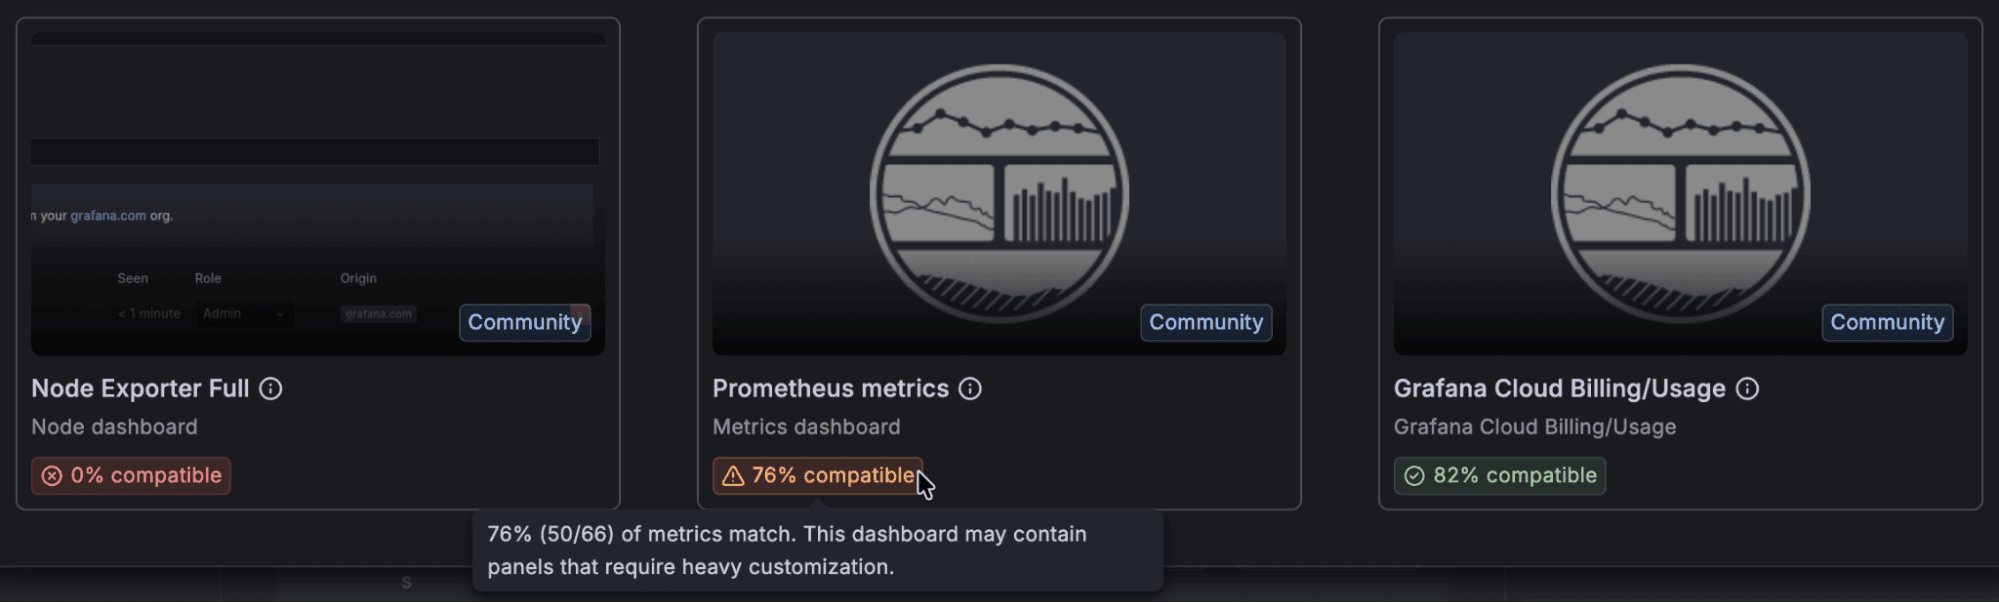
For Prometheus users, Grafana goes one step further by evaluating how well a suggested dashboard matches the exact metrics available in your data source. Each dashboard is assigned a compatibility score, helping you quickly understand how much customization may be required before it becomes useful.
Suggested dashboards are available in public preview in all editions of Grafana. To learn more about these and other updates, please visit our docs.
Discover smarter ways to represent your data
Visualization suggestions help you find and compare different dashboard panels and pinpoint the best way to showcase your data for your use case and end users.
In Grafana 13, we've refined the suggestions for visualization types so that they are not only based on the data surfaced by queries in a panel. They now leverage metadata from your data sources, such as data frame types in the data plane, to recommend specific visualization types best suited to your data.

Even better? When you preview a visualization using the Suggestions feature, you'll get a full-sized preview of the targeted suggestion in the panel editor before you select it.
Visualization suggestions are now generally available in all editions of Grafana.
Cut down on repetitive query work
Writing queries is one of Grafana’s most powerful features, but also one of the most tedious. With saved queries, teams can save, share, and reuse their queries, reducing duplicate work, speeding up onboarding, and ensuring everyone builds on proven best practices.
Here are the latest updates.
New interface and improved filtering experience
We’ve refreshed the saved queries interface to make discovery and management easier with a new dialog box, improved organization, and persistent filters that remember your preferences.

Faster panel creation
You can now create panels directly from saved queries. Grafana will automatically generate a panel with a recommended visualization, without having to go into panel edit mode. This helps you move from query to dashboard faster.
More flexibility with variables
You can now substitute variables when selecting a saved query without modifying the original query. This makes saved queries more portable and reusable in environments where variable names or available values differ between dashboards.
These new features are currently available in public preview in Grafana Cloud and Grafana Enterprise. To learn more, please visit our docs.
Build complex queries faster
We’ve redesigned the query editor to make complex panels easier to build and manage. The new experience gives you a unified view of your entire data pipeline, including queries, expressions, transformations, and alerts, with clearer feedback and faster access to key settings.

Updates include:
- Streamlined pipeline management: A new sidebar shows queries, expressions, and transformations as color-coded cards with state indicators (error, hidden, disabled).
- Per-query data source selection: Each query now has its own data source picker, making multi-source panels more intuitive.
- Inline alert visibility: A dedicated Alerts tab shows all alert rules tied to the panel, with color-coded status so you can quickly assess alert health.
- Improved query options access: A footer surfaces key panel-level options like max data points and time overrides, with inline indicators to highlight deviations from defaults.
The redesigned query editor is available in private preview in all editions of Grafana.
Build dashboards, analyze data, and more with AI
A big announcement to come out of the GrafanaCON 2026 opening keynote: Grafana OSS and Grafana Enterprise users can now access Grafana Assistant, our AI-powered agent in Grafana Cloud, as an additional tool to quickly and easily gain insights to your data. With the help of Grafana Assistant, you can customize suggested dashboards and templates, streamline your use of SQL expressions, and so much more.

To learn more, please read our Assistant everywhere blog post.
New and improved data visualizations
It wouldn’t be a Grafana release without some new ways to visualize your data. Here are a few data visualization highlights in Grafana 13.
Revamped gauge panel
The updated gauge panel is now generally available in all editions of Grafana, offering a range of new data representation options based on your needs.

You can learn more about the gauge visualization in our docs.
Graphviz panel to visualize dynamic workflows
The new Graphviz panel plugin lets you render diagrams defined in the Graphviz DOT language mapped to live data from any data source.
You can now map metrics to service topologies, infrastructure dependencies, business workflows, or any structure where relationships matter as much as values. This helps you understand at which point a process or flow is failing, and act fast.

The Graphviz panel plugin is available in private preview for all editions of Grafana.
Faster configuration with panel styles
You can now apply panel styles to quickly update your panels without adjusting multiple options manually.
Panel styles gives you a curated set of configurations, such as colors, thresholds, and display options, so you can get to a more polished visualization with a single click.

Panel styles are currently supported in time series, gauge, bar gauge, stat, and bar chart visualizations, and are in public preview in all editions of Grafana.
Copy-paste panel styles
Styling panels in Grafana used to require a lot of manual work: editing each panel individually, or duplicating one just to reuse its look and then swapping out the query.
With the new copy-and-paste feature, you can copy the styling from one panel and apply it to another in just a couple of clicks.
This feature is available for core panels, and you can only copy styles between panels of the same type (for example, stat to stat or gauge to gauge). It’s currently experimental in all editions of Grafana, and you can enable it with the panelStyleActions feature toggle.
Navigate and streamline your data with dynamic dashboards
As teams add more visualizations and connect more data sources to Grafana, dashboards quickly become larger and more complex. This can lead to cluttered layouts, empty panels, and excessive scrolling, making dashboards harder to navigate and maintain.
Enter dynamic dashboards, a dashboarding experience that’s more intuitive, responsive, and scalable to support growing teams.
"With dynamic dashboards, it feels like the limits do not exist anymore,” said Dawid Dębowski, Software Engineer at G2A.COM. “You can make the dashboards fully dynamic by hiding the parts that are not needed based on variables or queries, and you can better organize the dashboard thanks to awesome tabs. The possibilities seem endless."
Dynamic dashboards is now on by default for all Grafana Cloud users and in self-managed Grafana instances. Every new and existing dashboard uses the new layout engine, editing experience, and dashboard structure automatically. Your existing dashboards are migrated to the new schema (more on this below) when you open them. No manual steps required.

Since public preview earlier this year, we’ve specifically focused on refining the editing experience within dynamic dashboards. Updates include:
- New dashboard creation page with a default layout selector, so you start with the right layout from the beginning.
- Variables and annotations in the sidebar with drag-and-drop reordering, inline editing, and color indicators for annotations.
- Drag-and-drop panel creation from the sidebar directly onto the canvas.
- Deeper nesting up to three levels, so you can place rows inside tabs inside rows.
- Paste panels using the new Add mode of the sidebar.
- Sidebar docks in edit mode and floats in view mode. The sidebar defaults to docked when editing and undocked when viewing, so it takes up space only when you need it. Your preference is remembered per mode.
What this means for provisioned dashboards: a new dashboard schema
Dynamic dashboards uses a new dashboard schema (v2). Dashboards provisioned as code (using the API, Terraform, or Git Sync) continue to work. V1 dashboards are migrated to v2 automatically when loaded.
For details on the v2 schema and provisioning, refer to the dashboard schema documentation.
And to learn more about dynamic dashboards, refer to the dynamic dashboards documentation.
Operate Grafana at scale
Grafana 13 is here to make Grafana easier to configure and maintain at scale. The goal is simple: help admins spend less time firefighting and more time enabling their organization, with safer changes, lower operational risk, and better support for running Grafana across teams and environments.
Manage observability as code: the latest in Git Sync
As your Grafana instance scales, managing dozens (or even hundreds) of dashboards through the UI can quickly become overwhelming. Tracking changes gets murky, dashboards multiply, and consistency suffers.
Git Sync addresses this challenge by bringing a native GitOps workflow into your Grafana instance. This enables teams to version dashboards, submit pull requests, and manage approvals seamlessly.

Git Sync is now generally available in all editions of Grafana, and includes new features that give you more flexibility and control when managing dashboards as code, including GitHub App authentication and support for GitLab, BitBucket, and pure Git.
To learn more about Git Sync, check out our documentation and this blog post.
Keep instances healthy with Grafana Advisor
Grafana Advisor, now generally available in all editions of Grafana, helps you keep your Grafana instance running smoothly and securely. It automatically performs regular health checks on your Grafana server, providing actionable insights and recommendations for maintaining optimal system performance.
Admins can use Advisor to uncover issues, such as:
- Data sources with a failing health check, which would result in failed queries
- Outdated plugins that may be insecure or missing the latest fixes and features
- Misconfigured SSO settings
The Advisor also integrates with Grafana Assistant, giving you AI-powered guidance to quickly remediate identified issues.
For more information, refer to our documentation.
Extend Grafana through an open ecosystem
In line with our big tent philosophy, we believe you should be able to query and visualize your data, regardless of where your data lives. As a result, we’re always working to expand and enhance our line-up of Grafana data sources.
New Enterprise data source: IBM DB2
For many organizations, IBM DB2 is the database powering their most critical systems. Now you can bring DB2 data directly into Grafana and visualize it alongside the rest of your telemetry.
The new IBM DB2 Enterprise data source, now in public preview, lets you connect to your DB2 databases and run SQL queries right within Grafana Cloud or Grafana Enterprise.
You can:
- Write full SQL queries with syntax highlighting in the query editor.
- Format results as tables for detailed records or as time-series for trend charts.
- Use template variables to make dashboards dynamic and reusable.
- Surface annotations to mark events or milestones on your graphs.
- Drive Grafana alerting directly from DB2 query results
Whether you’re analyzing business records or tracking operational performance, you have full control over how your DB2 data is explored and visualized.
The IBM DB2 Enterprise data source is one of several Enterprise data sources we’ve recently added to our line-up, alongside SolarWinds and Jenkins.
Introducing the Grafana Marketplace
The Grafana Marketplace, also announced at GrafanaCON 2026, is a new platform that allows independent software vendors (ISVs), systems integrators (SIs), and developers in the Grafana community to sell and distribute plugins developed for Grafana.
The marketplace is currently in its pilot phase. To learn more, including how to get involved, please see our marketplace blog post.
Learn more about Grafana 13
For an in-depth list of all the new features in Grafana, check out our Grafana documentation, the Grafana changelog, or our What’s New documentation.
Join the Grafana Labs community
We invite you to engage with the Grafana Labs community forums. Share your experiences with the new features, discuss best practices, and explore creative ways to integrate these updates into your workflows. Your insights and use cases are invaluable in enriching the Grafana ecosystem.
Upgrade to Grafana 13
Download Grafana 13 today or experience all the latest features by signing up for Grafana Cloud, which offers an actually useful forever-free tier and plans for every use case. Sign up for a free Grafana Cloud account today.
Our Grafana upgrade guide also provides step-by-step instructions for those looking to upgrade from an earlier version to ensure a smooth transition.
A special thanks to our community
We extend our heartfelt gratitude to the Grafana community!
Your contributions, ranging from pull requests to valuable feedback, are crucial in continually enhancing Grafana. And your enthusiasm and dedication inspire us at Grafana Labs to persistently innovate and elevate the Grafana platform.
For more information on this and all the other exciting updates from GrafanaCON 2026, check out our announcements blog post.

