

Automatically discover and remediate root causes with Grafana Assistant Investigations
You can use Grafana Assistant Investigations to automatically discover incidents and help find root causes—and this AI-powered Grafana Cloud feature recently got a major upgrade to give you even more confidence in its findings.
You can read more about the behind-the-scenes effort in our new engineering blog Unprompted, where we get into harness engineering, context compaction, benchmarking, and keeping agents alive and working well in long-running sessions. In this post, we'll focus on how you can get the most out of this product iteration in conjunction with our other features.
Keep reading to learn about all the ways Assistant Investigations, currently in public preview, can help you improve your incident response so you can run your own “human on the loop” auto-remediation workflows at scale in Grafana Cloud.
Investigate anything with Assistant Investigations
At its core, Assistant Investigations is a highly sensitive and tuned background agent that’s capable of investigating anything within the observability space or developer lifecycle. It’s your problem finder and validator.
- Find instrumentation gaps in your setup: Task Assistant Investigations with looking at your metrics, logs, traces, profiles, services, and labels, and correlate that with your code to spot any improvements for your setup.
- Define degradation criteria and evaluate against them: Build a skill with Grafana Assistant that captures certain criteria you want to meet. Schedule AI-assisted investigations on top of them and get a report every day if you’re still within your operational parameters.
- Use profiles to raise PRs to make your software faster: Kick off an AI-assisted investigation with the purpose of looking at profiles and improving latency in your login and registration service. Based on a correlation of telemetry data, you’ll get improvements posted to GitHub either as issue, PR, PR draft, or branch.
- Analyze your user drop-off rate across services: As long as the data is available, Assistant Investigations can also look at business metrics for you. That way, you can correlate high latency with churn in your checkout process or timeouts on your payment provider with chargebacks. You connect the dots between business impact, value capture, and your telemetry.
Customize Assistant Investigations to fit your specific needs
Assistant Investigations also gives you full customization, just like Grafana Assistant. And it follows our "big tent" philosophy, so you can use the tools and agents you prefer. For example, you can:
- Use MCP server integrations to wire up your entire stack to Grafana Cloud and give Assistant Investigations access to all necessary systems
- Connect to code via GitHub and GitLab; bring in business data from Snowflake or Salesforce; look at feature flags in LaunchDarkly; or manage CI/CD with Jenkins.
Common use cases for Assistant Investigations
Next, let's look at some of the use cases that can make Assistant Investigations so valuable to your observability practice.
Multiplayer your problem
With Assistant Investigations, there’s no need to tackle problems alone. When your on-call colleague kicks off an investigation for a problem and pages another team, the other team can easily jump into the conversation. They can retrieve the investigation, steer it, ask follow-up questions, or provide valuable context.
With the Assistant workspace and its canvas, multiple users can put down relevant information so that whoever reviews the investigation during the incident or after it can see what’s going on.
Kick start your response by connecting to alerts and incidents
Incidents don't happen on your schedule, and every minute counts when you need to get your systems back online. With Assistant Investigations, you can easily integrate with Grafana Alerting and Grafana Cloud IRM to kick off an investigation when alerts fire or incidents are declared.
If you have GitHub, GitLab, or Cursor configured, you can also close the loop and raise PRs automatically.You can even configure Assistant to send Slack messages into a group channel to nudge colleagues to review the auto-fix.
With Alerting’s outgoing webhooks, you can go further down the customization route by sending a POST request to another agent that has access to Grafana Cloud via our hosted MCP server or gcx. This allows you to kick off any agentic workflow to act on alerts how you need to.
And the next time an alert fires and the investigation comes back with a false-positive, just ask Assistant to improve your alert.
Catch up on what changed overnight
Thanks to agentic coding, software moves faster than ever—and we’re here to move fast with you. With Assistant's automation capabilities, you can kick off structured investigations on a time basis and have the reports sent back to Slack to you personally or in a channel.
Don't let your users be the first one to tell you when something breaks. Even if you don't have the right alert set up, the next time your checkout service sees increased latency and churn, you’ll catch it faster. And if you set up a GitHub or GitLab integration, you can create the PR to fix it right from Slack
One piece of the larger Assistant ecosystem
Now let's look at a practical example that highlights how versatile the Assistant ecosystem is and where Assistant Investigations fits in. If you're not using Assistant already, you can read along to get a sense for what it can do. Or, if you're already using Assistant, you can follow these same steps in your environment.
To do so, we'll use the workspace feature, which lets you manage multiple Assistant conversations from a dedicated page.
- Open Assistant and select Open in Workspace from the conversation menu.
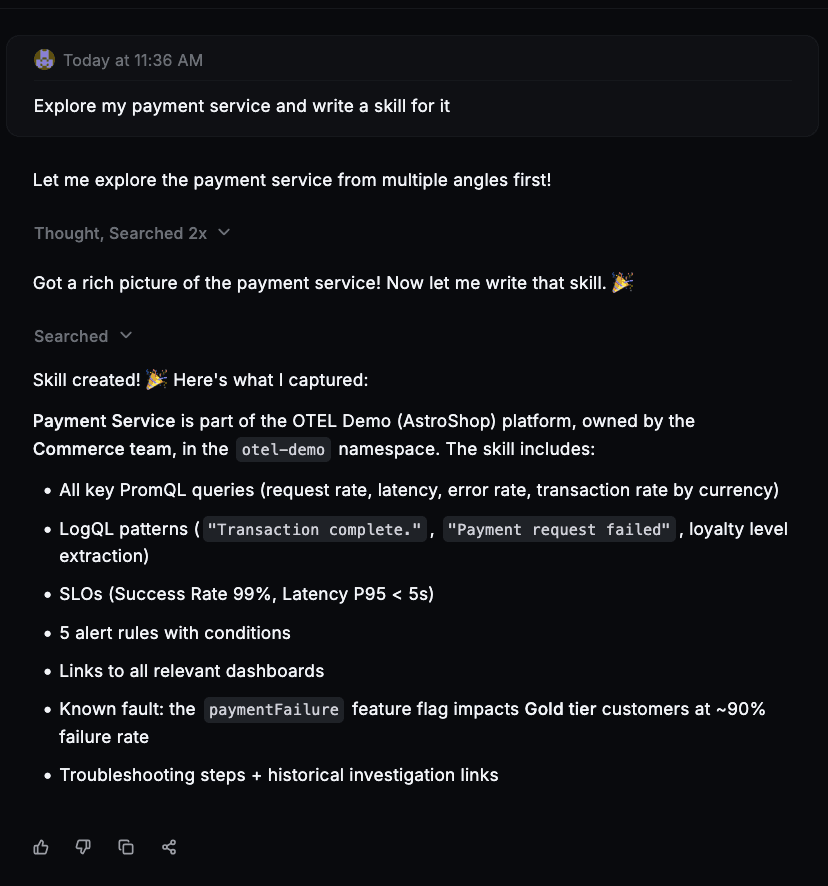
- Ask about a service of your choice. For the purposes of this example, I picked a demo payment service, but you can run this with any service you have enabled to support Assistant and Assistant Investigations.
- Ask Assistant to explore your service and write a skill for it.
Congrats, you’ve customized Assistant with your first skill! Next time you talk about the payment service, the context from the skill gets pulled in.
Next, let's re-use that skill in Assistant Investigations.
- Go to Assistant > Settings > Integrations > IRM webhooks and configure it for the incidents and alerts you want Assistant Investigation to run on.
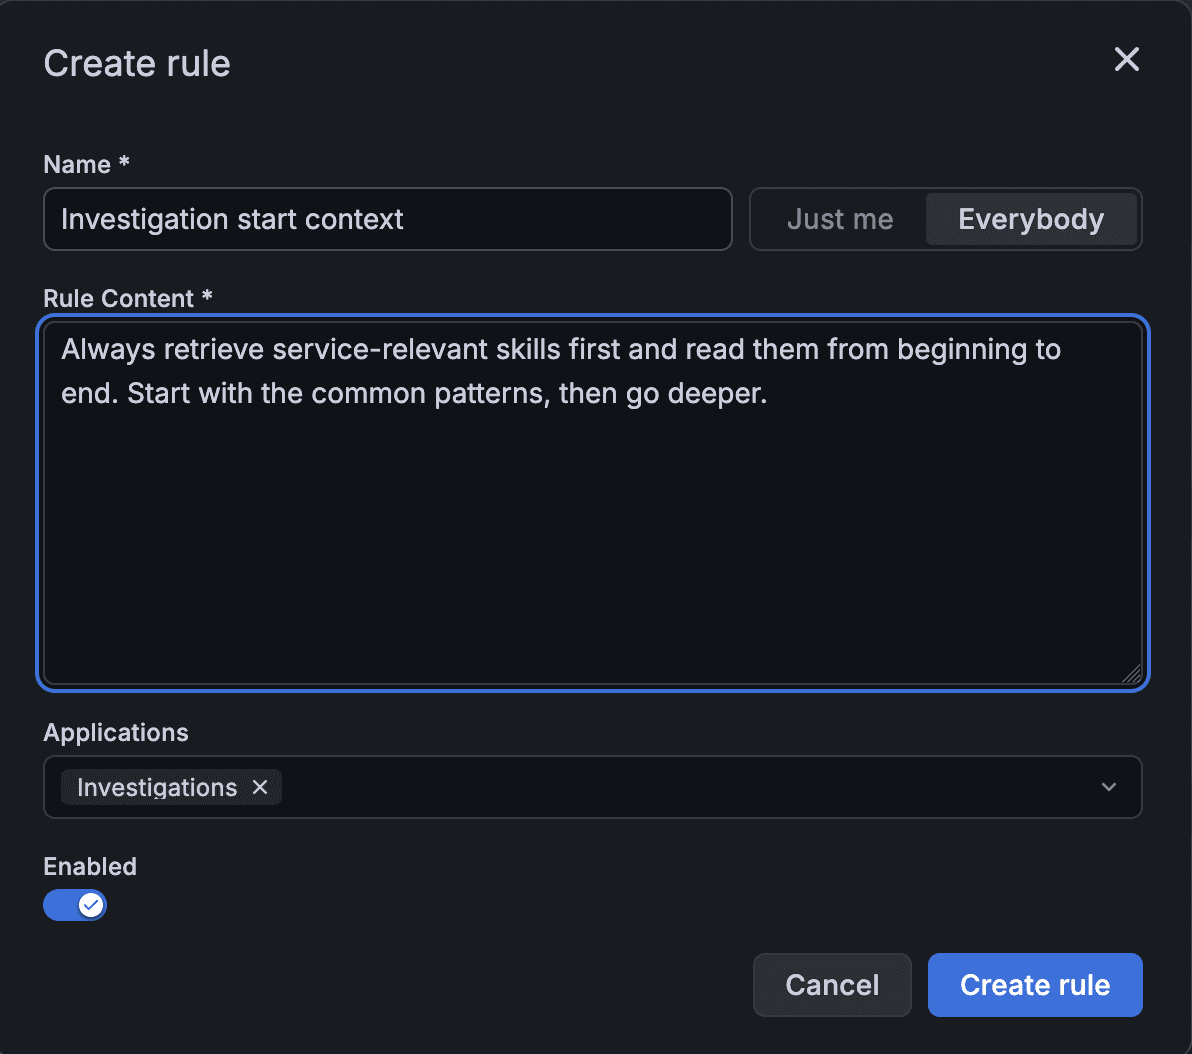
- Go to Assistant > Settings > Custom rules and add a rule scoped to Investigations that says to always search for skills when an AI-assisted investigation starts and to pick the service-relevant skills.
Whenever Assistant Investigation is triggered, you can be sure it follows your runbook now.
Note: You can set custom rules and skills to “Just me” or “Everybody.” With “Everybody,” everyone profits from your setup without having to set up anything themselves. Once configured, it applies to the whole stack.
Finally, let’s layer on some automations.
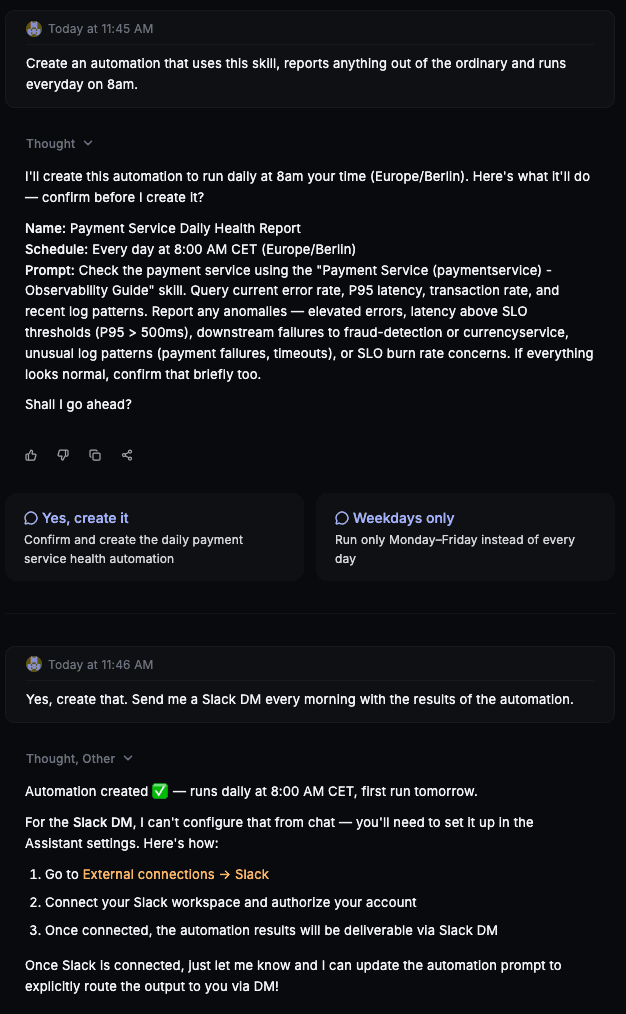
- Ask Assistant to create an automation for you that uses your skill and runs every morning at 8 a.m.
- Tell it to send you a Slack DM.
From now on, every morning at 8 a.m., your skill is executed and all out-of-the-ordinary findings are reported.
Note: In my example, I didn’t connect Slack on purpose to highlight how Assistant actively helps you configure certain parts of it as they become necessary.
This is just one example of all the ways you can use Assistant and Assistant Investigations. You'll get the best outcomes by playing around and using the different features in conjunction with each other, so start testing it out today!
Grafana Cloud is the easiest way to get started with metrics, logs, traces, dashboards, and more. We have a generous forever-free tier and plans for every use case. Sign up for free now!

