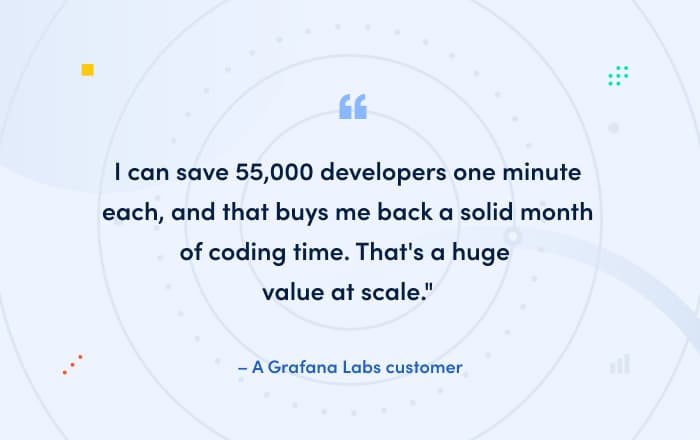
The view from the field: Top 4 reasons customers buy Grafana Cloud and EnterpriseGrafana CloudGrafana Enterprise
Meet the Grafana Labs team: Matt Mendick, an engineering director managing Prometheus, Loki, and Cortex developersPrometheusTeam
Cortex v1.0 released: The highly scalable, fast Prometheus implementation is generally available for production useMimirPrometheus
How to successfully correlate metrics, logs, and traces in GrafanaGrafanaLoggingLokiPrometheusTracing
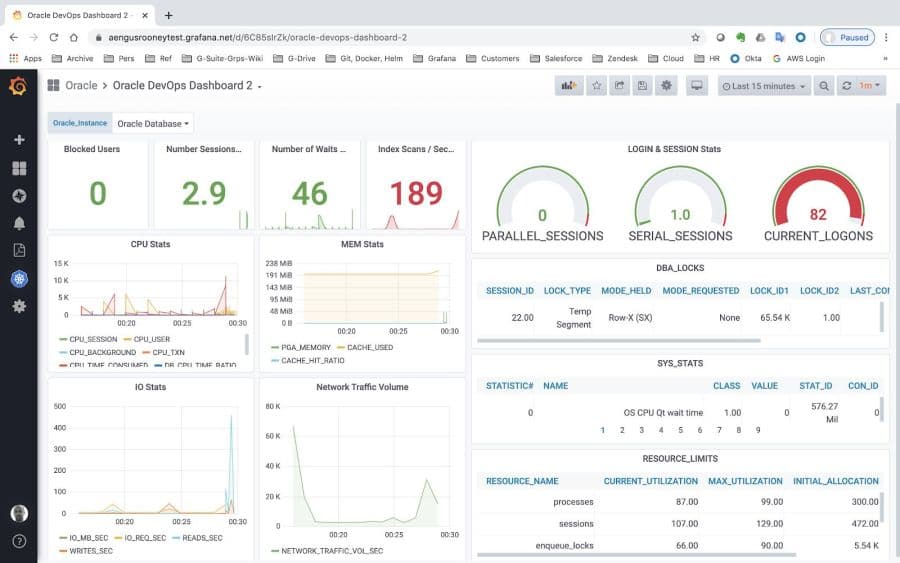
How to pull Oracle data and stats directly into Grafana dashboards with the Oracle Enterprise pluginGrafana EnterprisePlugins
Introducing Grafana Cloud Agent, a remote_write-focused Prometheus agent that can save 40% on memory usageMimirPrometheus
Watch talks on Cortex vs. Thanos, Metrictank past and present, and a preview of Grafana 7 from our recent meetupMetrictankPrometheus
Identify anomalies, outlier detection, forecasting: How Grafana Cloud uses AI to make observability easierExplore how Grafana Cloud uses AI to help you spot anomalies earlier, explore your data through natural language, and find root causes faster.AIGrafana Cloud
Grafana Labs named a Leader again in the 2026 Gartner® Magic Quadrant™ for Observability PlatformsObservabilityGrafana Cloud
Knowledge Graph as context for LLMs: demonstrating decisive RCA and faster production performanceGrafana CloudAI
Identify anomalies, outlier detection, forecasting: How Grafana Cloud uses AI to make observability easierAIGrafana Cloud
Knowledge Graph as context for LLMs: demonstrating decisive RCA and faster production performanceGrafana CloudAI
Digital Experience Monitoring with Grafana Cloud: Session Replay, synthetic checks, and faster investigationsSynthetic monitoringFrontend observabilityGrafana Cloud Frontend ObservabilityGrafana Cloud
Custom labels in Grafana Cloud Synthetic Monitoring: New updates for consistency and ease-of-useSynthetic monitoringGrafana Cloud


%3Aquality(90)%2F&w=3840&q=75)

%3Aquality(90)%2F&w=3840&q=75)



%3Aquality(90)%2F&w=3840&q=75)

%3Aquality(90)%2F&w=3840&q=75)


%3Aquality(90)%2F&w=3840&q=75)
%3Aquality(90)%2F&w=3840&q=75)


%3Aquality(90)%2F&w=3840&q=75)
%3Aquality(90)%2F&w=3840&q=75)
%3Aquality(90)%2F&w=3840&q=75)

