
Grafana Incident for incident management is now generally available in Grafana Cloud
We are thrilled to announce that Grafana Incident is now generally available to all Grafana Cloud users, including our generous free tier. (You can sign up for a free Grafana Cloud account now.)
Built to make incident management easier, Grafana Incident reduces mean time to repair (MTTR) by automating admin tasks so that teams can focus on actually fixing the issue at hand. In February, we initially rolled out Grafana Incident in preview. Thanks to invaluable feedback from our preview users, we are now ready to offer Grafana Incident to all users of Grafana Cloud, our fully managed observability platform. Incident is included with Grafana Cloud at no additional charge, with new and enhanced features that are already making an impact within organizations.
“The biggest wins for us are the small details like the Slack integration, automatic Google Docs templating, StatusPage integration, etc. All those small things build up into an insanely useful and cohesive tool for incident response,” says Clearco Software Engineer Bruno Da Silva, whose team is replacing PagerDuty with Grafana OnCall and Grafana Incident. “Y’all are knocking it out of the park. We’re very excited for the future of Incident!”
In this post, we’ll take a look at the problem Grafana Incident addresses and provide a deep dive on all the Incident features you can start using today to help your teams when things go wrong.
To get started, also check out our Grafana Incident documentation.
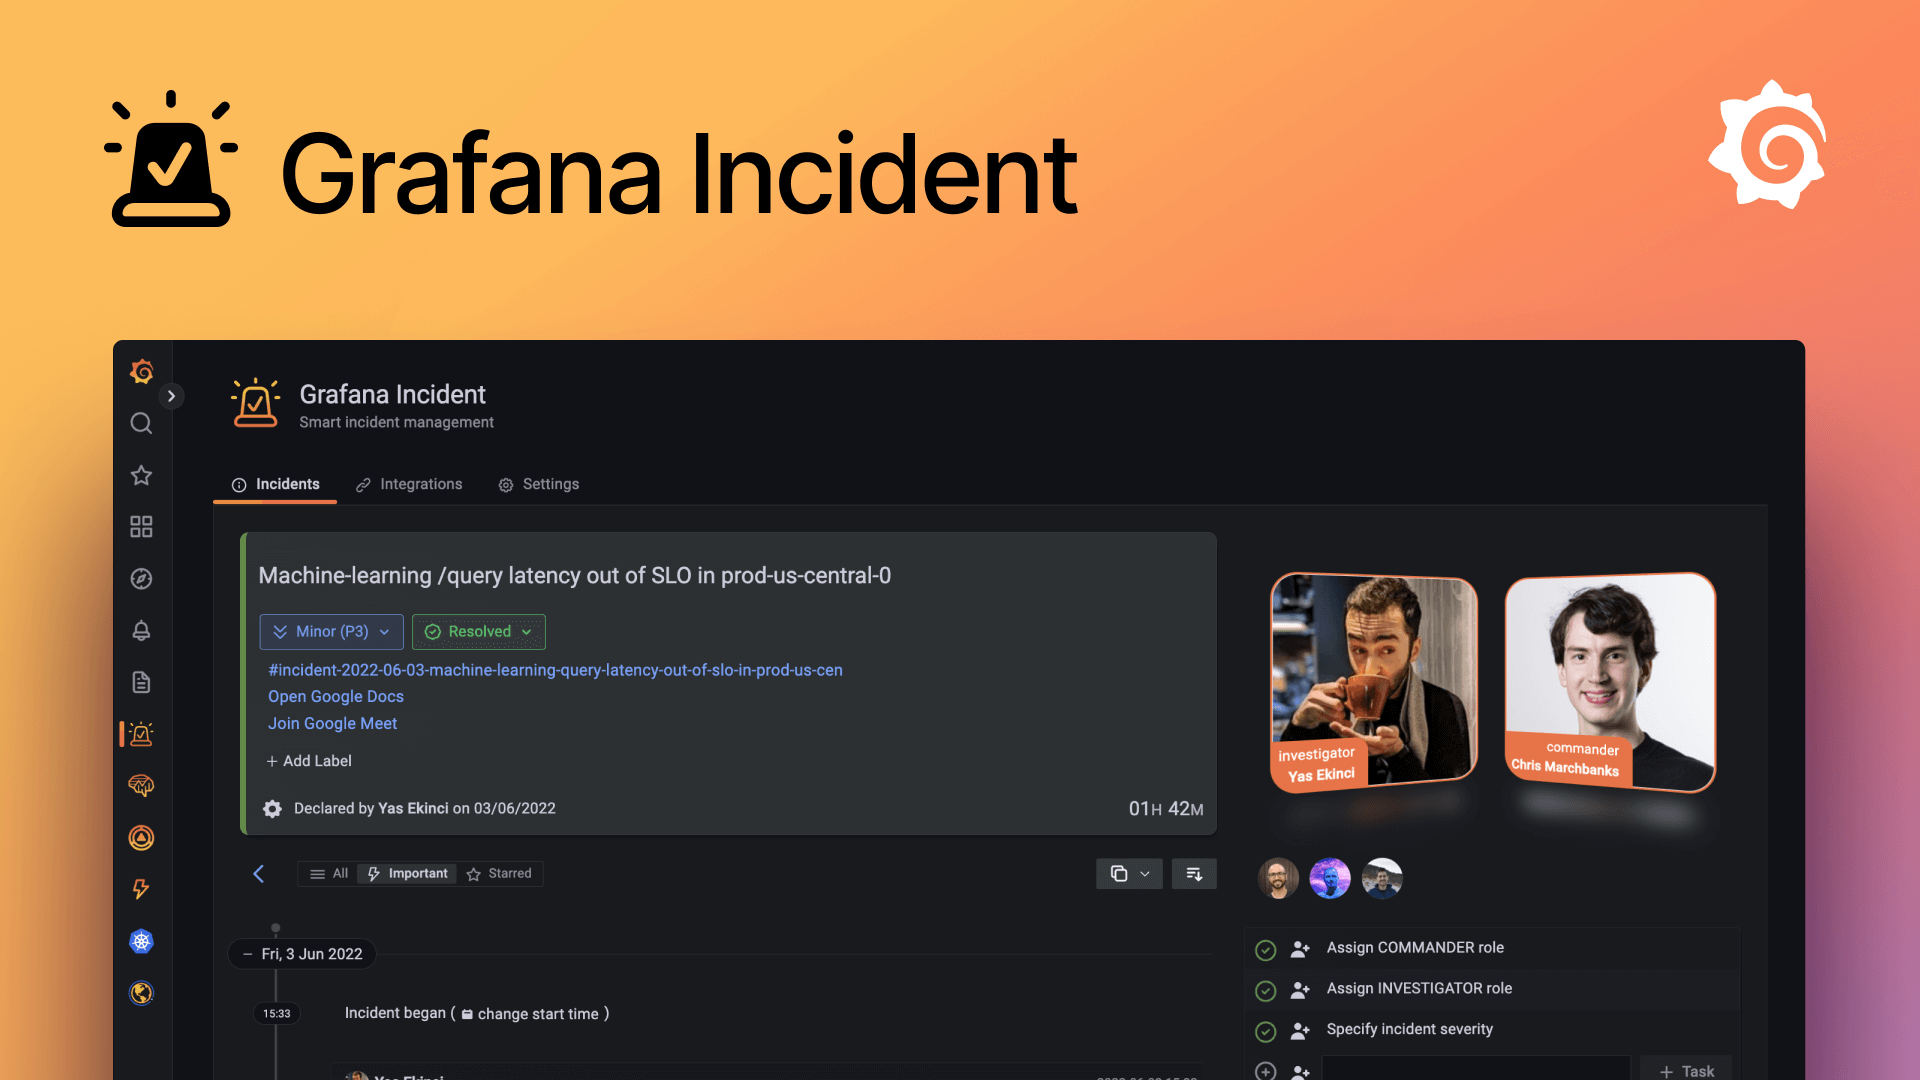
What is Grafana Incident?
A huge challenge when dealing with incidents is the coordination and communication needed to put things right. What’s happened so far? Who is involved? Who has tried what query? Did we remember to keep stakeholders informed? What is the severity of the incident? How does this affect customers?
Figuring this out requires a lot of back and forth, especially as new team members join the incident. Even after the incident is resolved, there is added toil around capturing the key timeline of events and action items and building your post-incident reviews.
This is where Grafana Incident steps in: Grafana Incident follows industry best practices for incident management, so you’ll quickly pick up useful behaviors that will set your teams up for success when things go wrong. Afterwards, the tool will help you manage the fallout and gain important insights on the path to avoiding the same issues in the future.
Incident management features in Grafana Incident
Declare an incident
Declaring an incident is easy. You can do it in the web UI or right from the chat. The tool will automatically set up all the important things you need, from a Slack channel to a dedicated meeting room (e.g., Zoom or Google Meet) where you can work together.
Assign incident roles
Assigning roles helps everyone know who’s doing what. First, an Investigator needs to be identified; this is the person responsible for figuring out what’s going on, or finding someone who can. For meatier incidents, a Commander is assigned to take charge of the incident, keeping everyone up-to-date and making sure nothing gets forgotten.
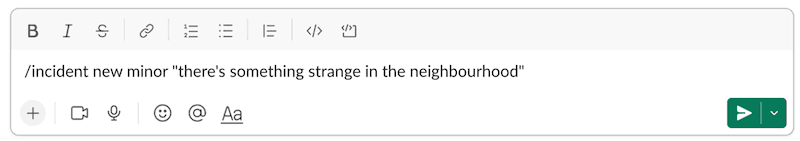
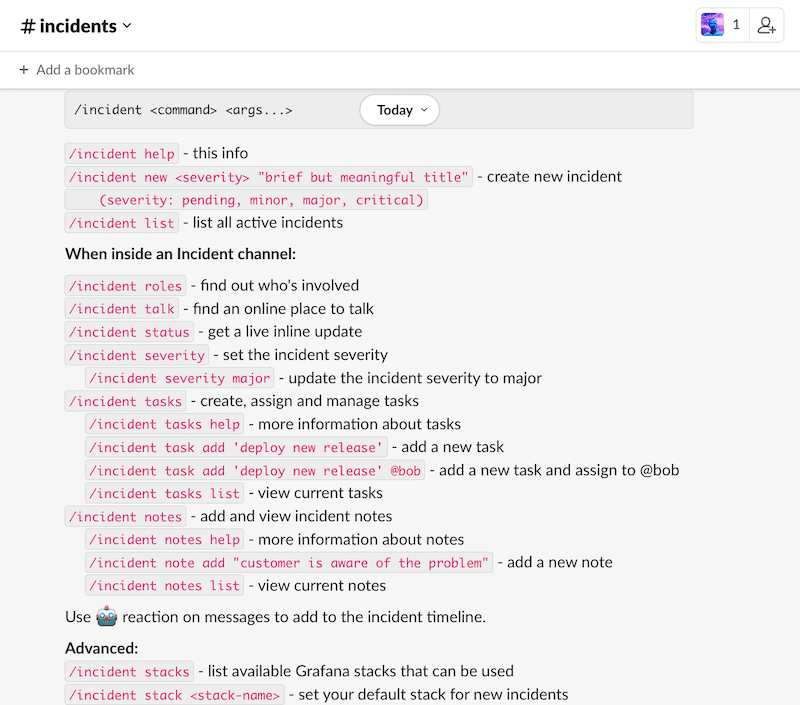
Chatbot
A chatbot offers a command-line interface for managing incidents. The chatbot also looks out for interesting context shared in the chat.
For example, if you post a link to a GitHub issue, it is attached to the incident and shows up on the page. Grafana Incident synchronizes the status, so you can easily see what’s been done and what’s left to do.
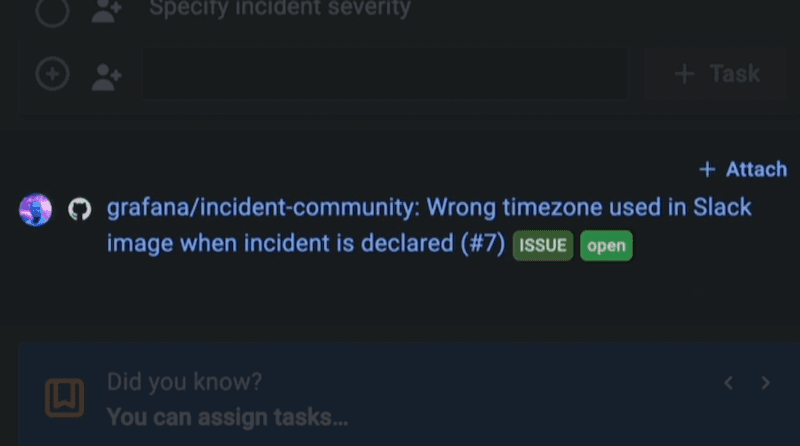
Whether that’s GitHub issues and pull requests, JIRA tickets, Grafana dashboards, or external links, you can passively build up a picture of what’s going on. Learn more about the integrations available in Grafana Incident in our documentation.
Suggestbot
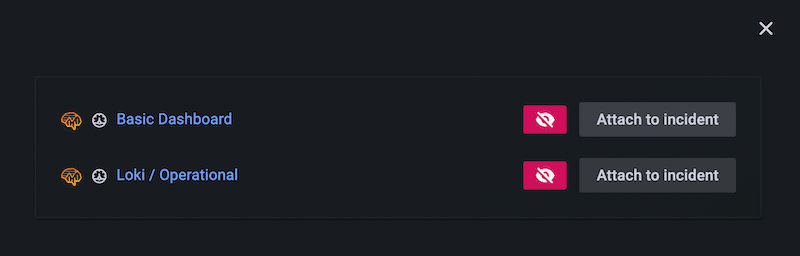
Grafana Incident will even suggest related dashboards, which is perfect for when it’s your first time on call. Suggestbot uses machine learning to look for Grafana dashboards that may be related to what’s going on. Using the title of the incident, it searches your dashboards for those that seem related based on an NLP (Natural Language Processing) understanding of their titles. This is the first step in an exciting direction for Grafana Labs, and we can’t wait to expand the insights into your incidents in the future.
Task manager
Keep track of to-do items with the built-in task manager. Easily add tasks and assign work, so nothing falls through the cracks.
Activity timeline
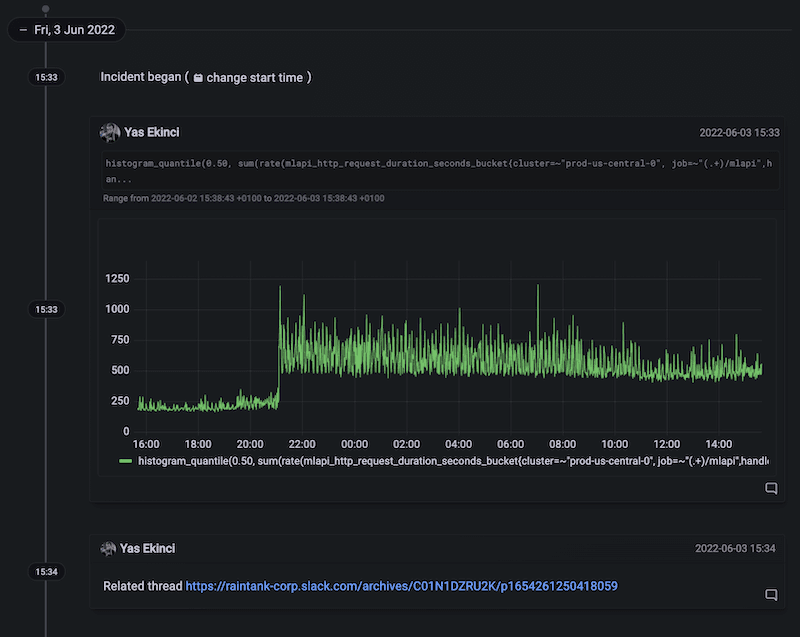
The tool automatically builds a timeline of activity, helping you gain valuable insights into what went on and how your response process is working — or not.
Present tool for postmortems
When we have postmortems on incidents at Grafana Labs, we use the Present tool which provides an overview of the incident, and we find it really effective in helping us to achieve transparency. We’ve built the Present feature into Incident to give users the opportunity to learn when things go wrong — and prevent them from happening again.
Get started with Grafana Incident
If you’re an existing Grafana Cloud user, then simply go and look for the Grafana Incident icon in the vertical sidebar. A Grafana Cloud Admin can enable the app. If you use Slack, it’s worth setting that up right away, so that the chatbot can take you on an interactive tour of the tool.
Not a Grafana Cloud user yet? You can sign up for a free account to get access to Incident today. In addition to our free forever tier, Grafana Cloud also has plans for every use case.
We’re very keen to hear from you, so please report issues and join the discussions in our Grafana Incident community repo on GitHub or join the #grafana-incident channel on the Grafana Labs Community Slack.
If you’re not already using Grafana Cloud, sign up now for a free 14-day trial of Grafana Cloud Pro, with unlimited metrics, logs, traces, and users, long-term retention, and access to one Enterprise plugin.

