
Introducing Kubernetes Monitoring in Grafana Cloud
Kubernetes has quickly become the standard container orchestration technology for developers and companies who want to deploy at scale, iterate quickly, and manage a large number of applications and services.
At Grafana Labs, we recognized the need for something more powerful for our users to be able to successfully keep an eye on everything happening inside their clusters. Whether you’re an application developer rolling out new changes, an SRE seeking a better way to troubleshoot infrastructure incidents, or a DevOps administrator maintaining the bare-metal servers that run the clusters, we’re here to help.
Enter Kubernetes Monitoring in Grafana Cloud, the full solution for all levels of Kubernetes usage within your organization. Kubernetes Monitoring is available to all Grafana Cloud users, including those on the generous free tier. (If you don’t already have a Grafana Cloud account, you can sign up for a free account today!)
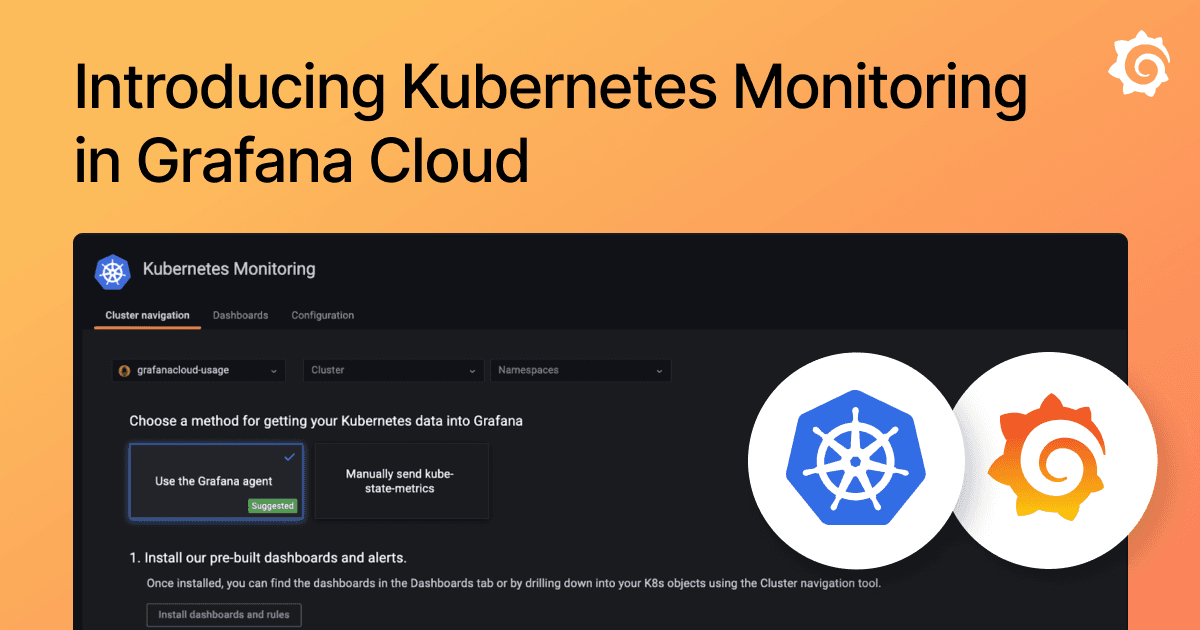
Grafana Cloud users can simply install the Grafana Agent onto your Kubernetes cluster(s) and in minutes, the Kube-state metrics will be shipped to Prometheus and Grafana. From there, Grafana Cloud users have out-of-the-box access to their Kubernetes infrastructure’s metrics, logs, and Kubernetes events as well as prebuilt dashboards and alerts.

Note: For Grafana Cloud users who have been using the existing Kubernetes integration for your data, your Grafana Cloud account will automatically receive the new Kubernetes Monitoring solution. No additional configuration is needed.
Kubernetes Monitoring: Cluster navigation is here
With the launch of the Kubernetes Monitoring solution, we are excited to introduce the cluster navigation view — a brand-new interface to visualize Kubernetes objects at every level.

Users can quickly jump into specific namespaces to see the number of Kubernetes pods running, watch deployments happen in real time, or narrow down any workloads that have pods in an undesirable state.

You can also dive further into workloads to get a glance at CPU usage, pod status, or jump out to related dashboards and log queries in new windows.
Finally, with cluster navigation, users can drill down to the pod level to see pod status, streaming pod logs, Kubernetes events, container specifics, and important details you need to quickly understand the state of your application.

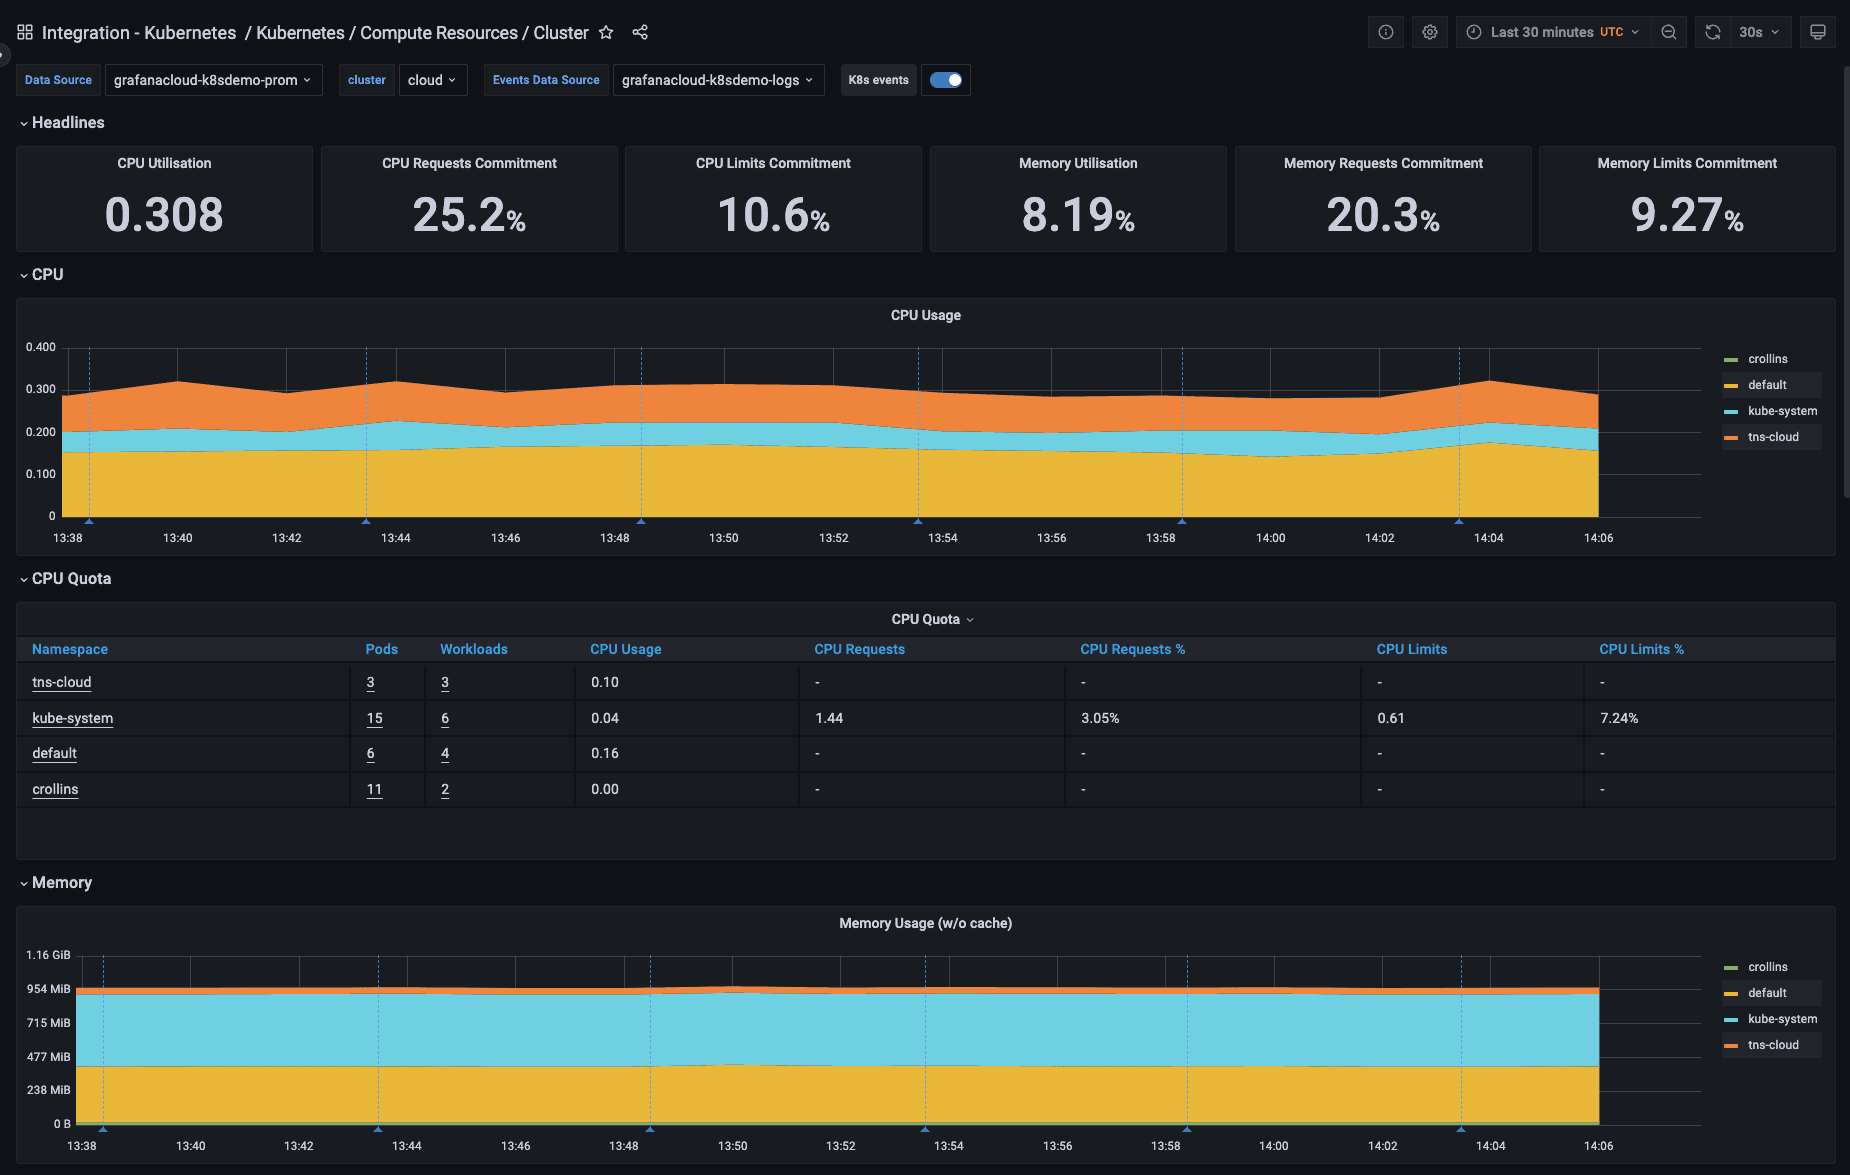
Prebuilt Grafana dashboards for Kubernetes Monitoring
In addition to the cluster navigation view, installing the Grafana Agent will also give you several prebuilt Kubernetes dashboards and alerts to monitor CPU usage at the cluster, namespace, workload, and pod levels. So Grafana Cloud users can instantly start keeping track of resources used, running pods, and storage operations all within the dashboards.
Learn more about Kubernetes Monitoring
We’re incredibly excited to share this complete Kubernetes Monitoring solution, which can be leveraged by Kubernetes users at all levels.
This release is only the beginning. We’re also working on supporting out-of-the-box configuration for shipping traces to your hosted Grafana Tempo endpoint, so keep an eye out for further updates. We’d love to hear what you think of Kubernetes Monitoring in Grafana Cloud and what features you would like to see next. Come talk to us directly in our Grafana Labs Community Slack.
For more information on getting started with Kubernetes Monitoring in Grafana Cloud, visit the Kubernetes Monitoring solutions page and check out our Kubernetes Monitoring documentation.
If you’re not already using Grafana Cloud — the easiest way to get started with observability — sign up now for a free 14-day trial of Grafana Cloud Pro, with unlimited metrics, logs, traces, and users, long-term retention, and access to one Enterprise plugin.

