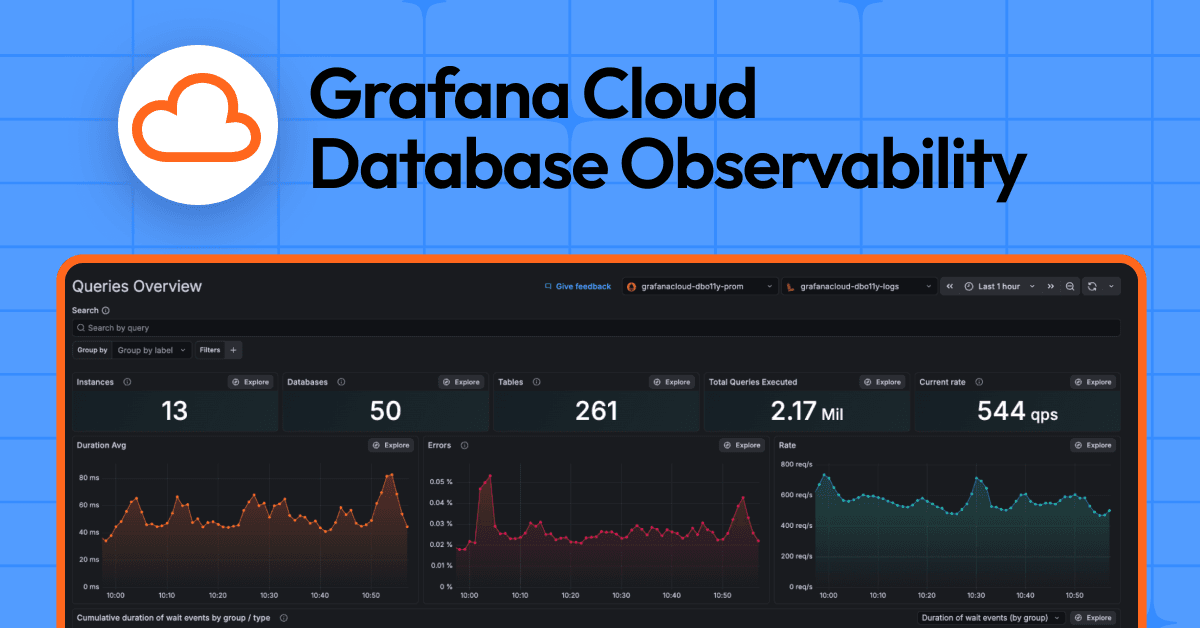
Understand, diagnose, and optimize SQL queries: Introducing Grafana Cloud Database ObservabilityInfrastructure observabilityGrafana Cloud
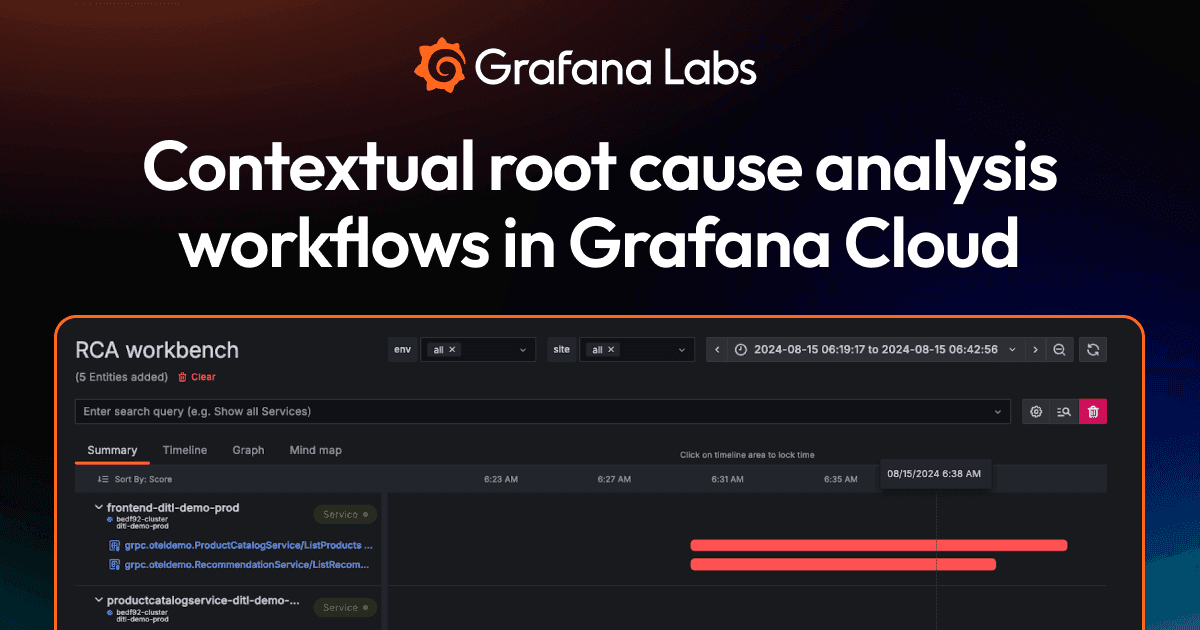
Resolve issues faster with contextualized root cause analysis workflows in Grafana CloudAssertsApplication observabilityInfrastructure observabilityMTTRGrafana Cloud