Blogs
Grafana Cloud Frontend Observability is a hosted real user monitoring (RUM) service that provides real-time, actionable insights into how users experience your applications. It lets you correlate frontend health with backend data in a single, unified place, so you can identify and resolve issues faster.
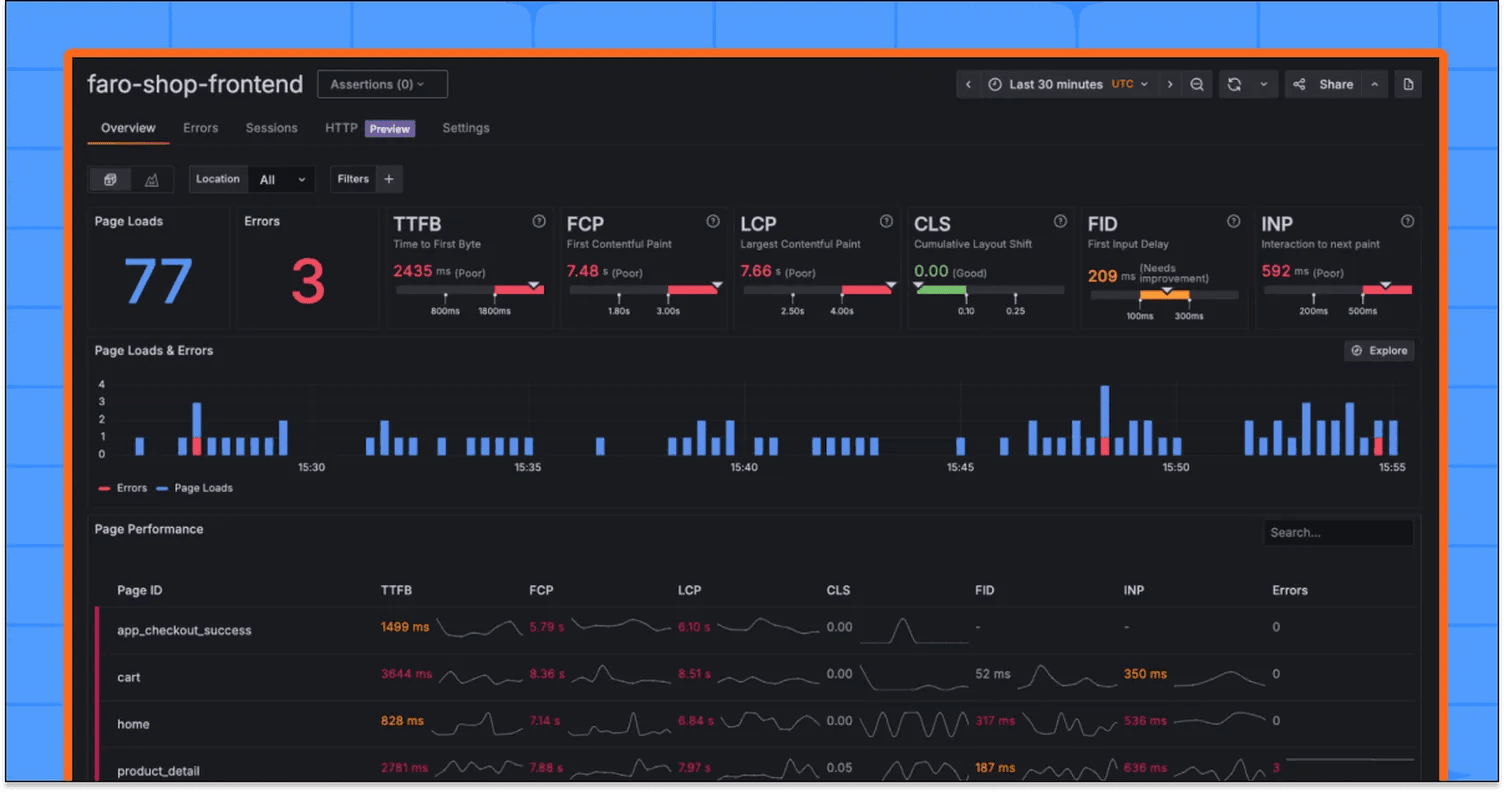
Understand real end-user experiences and optimize what matters most by tracking Core Web Vitals and frontend performance metrics in real time
Recreate user sessions and correlate frontend behavior with backend requests to resolve performance regressions faster
Group similar errors automatically and investigate down to the specific line of code
Trusted by everyone from startups to the Fortune 500
Deliver a better user experience by measuring page load times, user interactions, cumulative layout shift, and other key metrics
Understand performance by audience and context by slicing performance metrics by device type, application version, or session ID, and other business-level parameters
Track the most critical parts of the user journey within your application by measuring key user actions
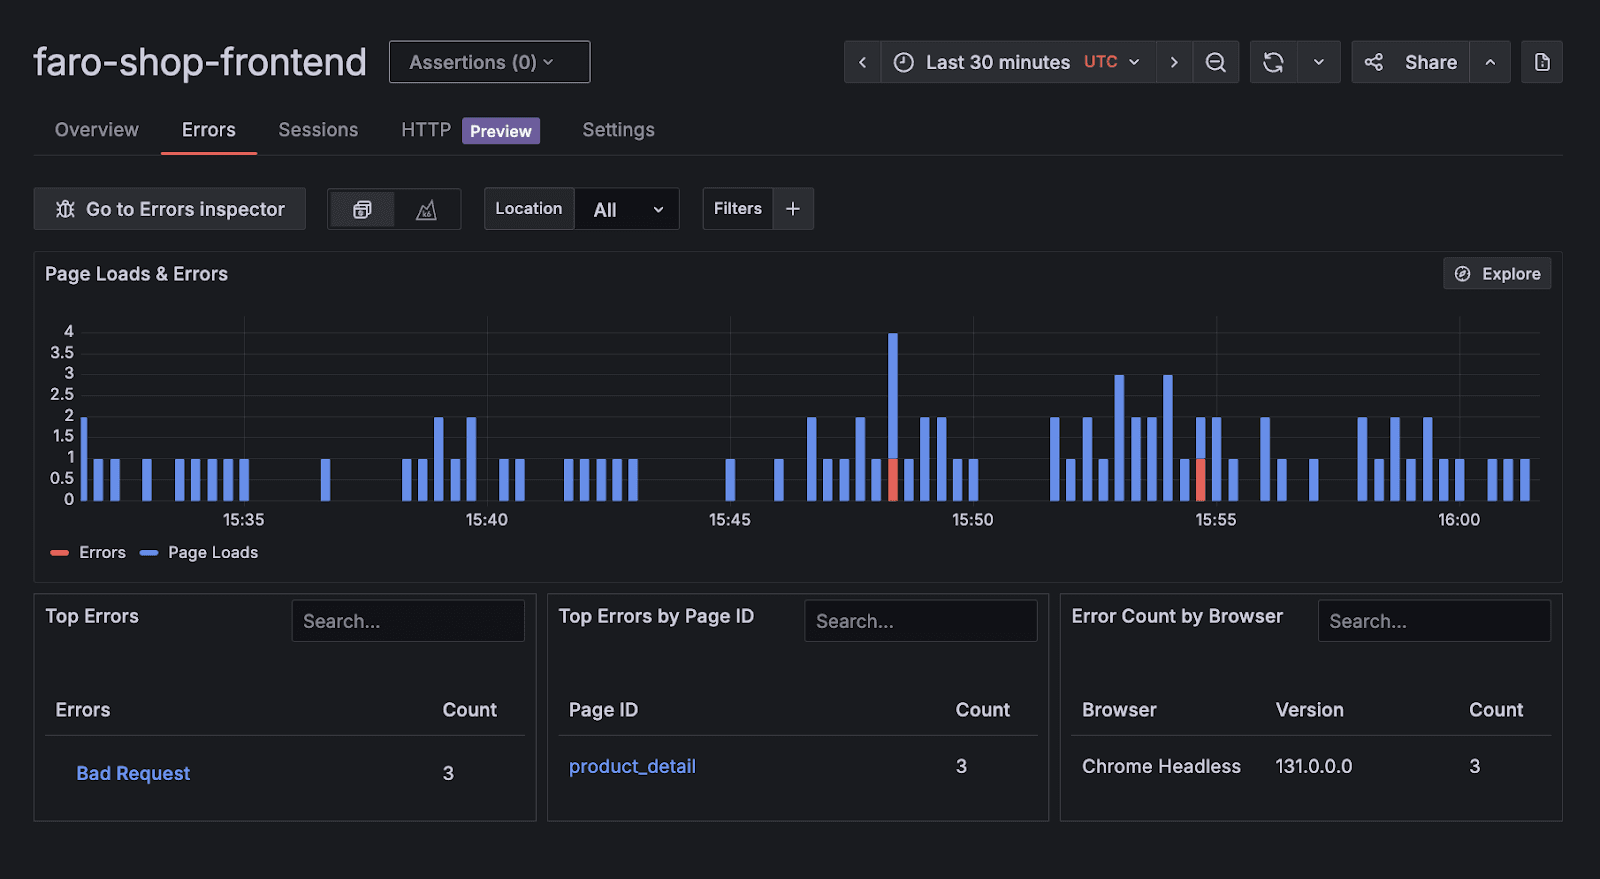
Prioritize what to fix first by assessing frontend error severity based on volume and frequency
Investigate issues in context using rich metadata that helps explain when, where, and why errors occur
Pinpoint the exact error cause to specific lines of code by unpacking JavaScript stack traces
Stay ahead of critical issues with predefined alerts that surface issues as soon as they need your attention
Find the sessions that matter by searching user sessions with any parameter
Reconstruct user journeys by seeing the complete timeline of events in a session
Understand where time is spent with detailed page navigation breakdowns of each phase, including network and rendering
Get true full-stack visibility by correlating a frontend user session with backend request traces
Gain insights quickly with the knowledge graph in Grafana Cloud

“Grafana Cloud Frontend Observability is critical to observing our frontend infrastructure and micro frontends. It provides valuable out-of-the-box insights about the end-user experience and it was easy to adopt. Its integration with OpenTelemetry allows us to get the full-stack perspective on our system.”
Sai Soundararajan Engineering Manager, SpotOn
No credit card required
Limited to 50k sessions per month
Community support
Automatic volume discounts. Pricing at scale. View calculator
50k sessions per month then pay as you go
8×5 email support
Scalable unit price based on annual commit
Premium support
Deployment flexibility (Public Cloud, Federal Cloud, or Bring Your Own Cloud)
OpenTelemetry-native observability and no lock-in, with out-of-the-box solutions like Kubernetes Monitoring, Application Observability, Grafana SLO, and RUM delivered in one unified experience.
Optimize costs without sacrificing insight with Adaptive Telemetry, which filters out unused data so your budget goes toward what actually drives value. Pair with cost management tools that help you monitor, control, and tune spend.
Grafana Assistant powers agentic workflows, prebuilt dashboards, intelligent filters, and customized alerts—surfacing the data you need for faster, more efficient incident response.


Welcome to
Built on open source, open standards, and open ecosystems