
This plugin has been deprecated, consider the use of the native Histogram visualization.
Histogram Panel Plugin for Grafana
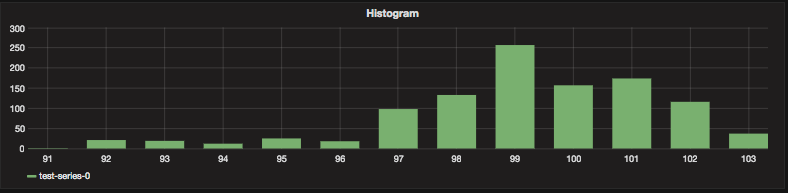
This plugin show the Histogram of time series data.
How this plugin works
This plugin receives raw time series data, and count each value occurrence, and then show the occurrence as histogram.
Supported Datasources
I confirmed this plugin work with following datasource.
- Prometheus
But, this plugin can handle time series data (defined by Grafana plugin interface).
Should work with Graphite / InfluxDB / OpenTSDB.
Options
- Bucket Size
- Can configure bucket size to make histogram data.
Known Issues
- This plugin doesn't support Elasticsearch aggregation.
- As noted above, this plugin make histogram data in plugin.
- Can't handle the Elasticsearch aggregation result yet.
Changelog
v0.1.6
- Support Grafana 4.0
v0.1.5
- Refactoring
v0.1.4
- Add template variable support
- Add bucket mode
- Fix sorting of buckets
- Fix tooltip display
v0.1.3
- Fix avg legend
v0.1.2
- Add min/max option
v0.1.1
- Update document
Grafana Cloud
Connect any plugin in Grafana Cloud.
- 150+ data source integrations
- Grafana Assistant - AI that correlates your data, builds queries, and answers questions
- 10k Prometheus metrics + 50 GB logs, traces, and profiles on the free tier
- ...and more
Insights
- Adoption
Running on 10,234 active Grafana instances.
- Activity
Last updated 19 Jan 2024.
0 releases in the past year.
- Version
- 0.1.7
- Developer
- mtanda
Grafana Cloud
Connect any plugin in Grafana Cloud.
- 150+ data source integrations
- Grafana Assistant - AI that correlates your data, builds queries, and answers questions
- 10k Prometheus metrics + 50 GB logs, traces, and profiles on the free tier
- ...and more