Full-stack observability with Grafana Cloud

Get AI-powered visibility across your apps, infrastructure, and Kubernetes deployments to find issues faster and boost reliability.

Find issues faster with AI

Teams can isolate issues in minutes instead of hours with connected telemetry signals

Empower quick decisions

Engineers and SREs can act quickly and confidently with unified, AI-guided insights

Scale visibility, not cost

Keep observability comprehensive and affordable as data grows with Adaptive Telemetry

スタートアップからフォーチュン500まで、誰からも信頼されています。

Observability solutions at every layer

Use Grafana Cloud for full-stack observability across applications, infrastructure, Kubernetes, and users:

Why use Grafana Cloud for full-stack observability

See clearly. Act faster.

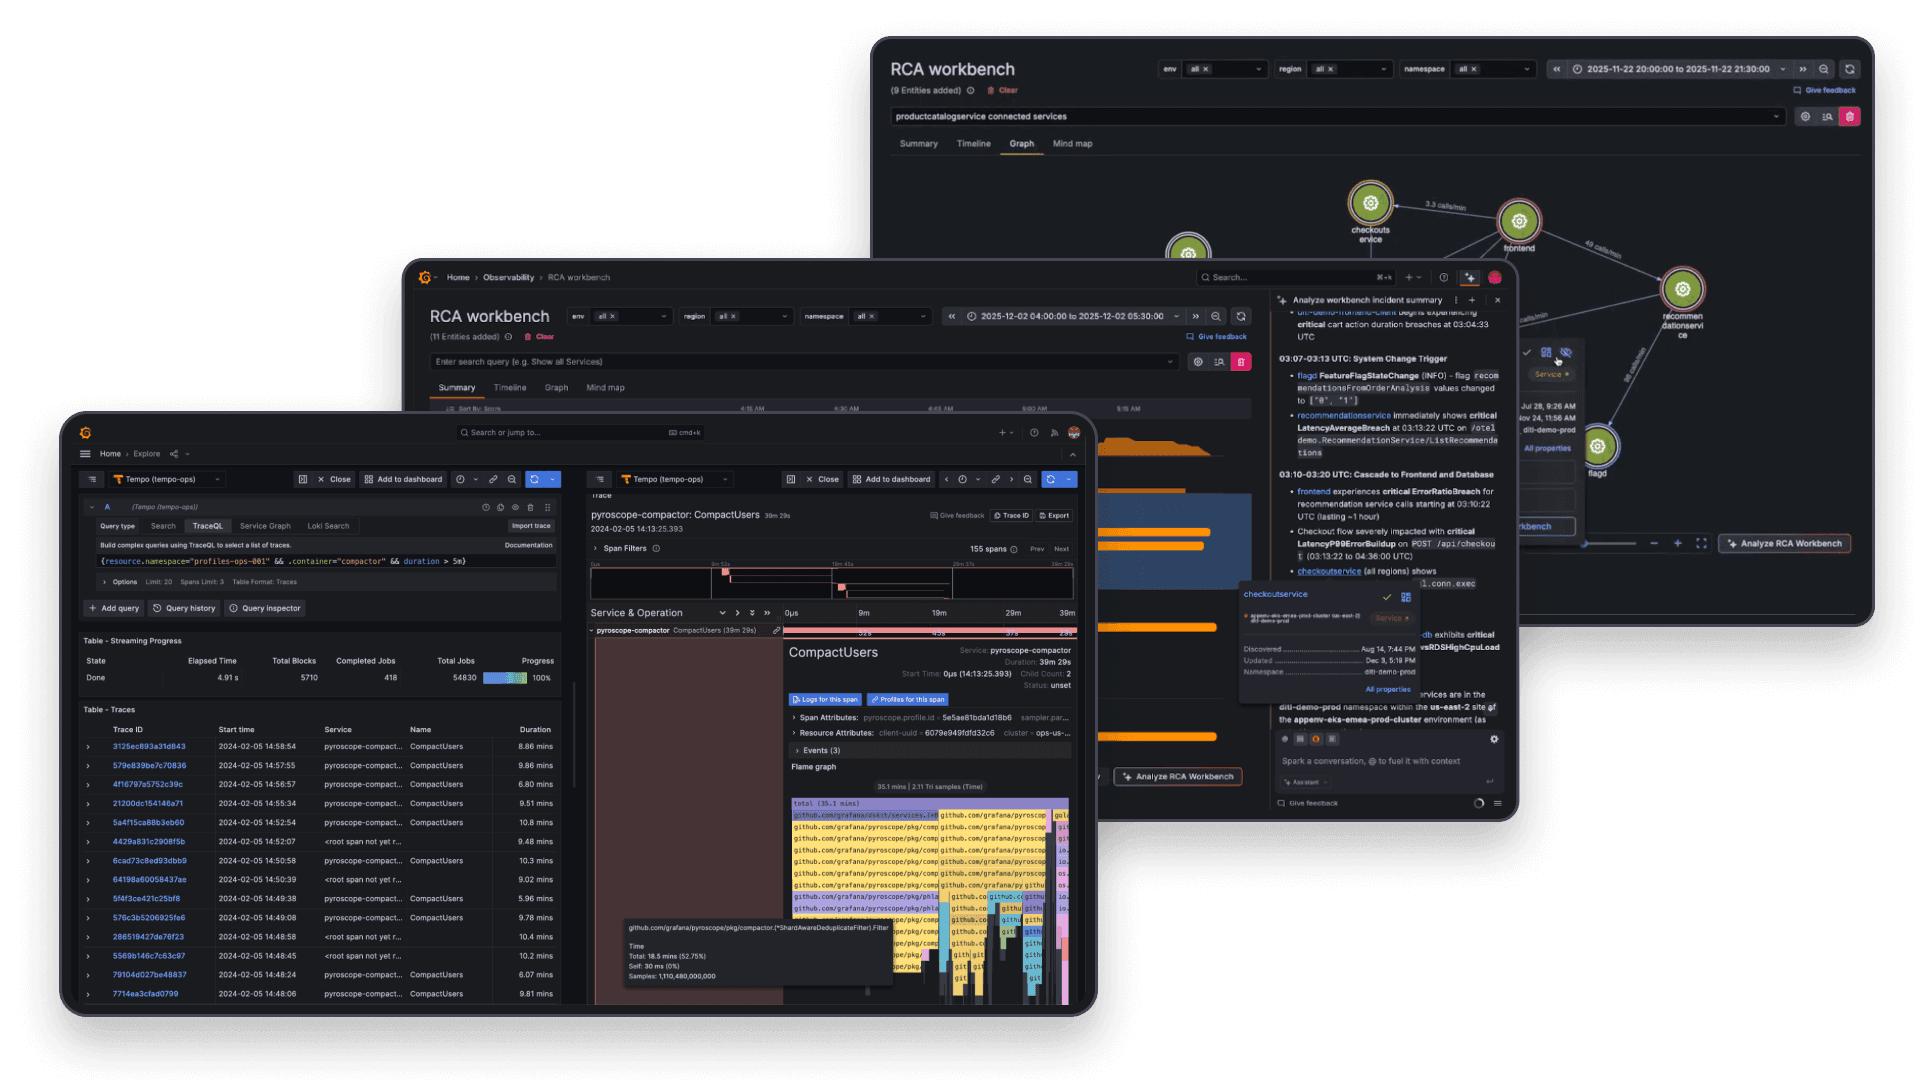
  • Understand system health instantly with a knowledge graph that connects services, infrastructure, and databases

  • Spot dependencies and detect issues early with unified metrics, logs, and traces

  • Resolve issues before they affect users with AI-powered visibility across your entire stack

Investigate smarter

  • Uncover root causes faster with AI that surfaces patterns and explains anomalies

  • Confirm fixes and learn from incidents with real-time dashboards that validate outcomes and capture knowledge for future response

  • Break down silos with shared visibility across Dev, Ops, and SRE teams

Scale visibility, control costs

  • Keep the right signals with Adaptive Telemetry, which amplifies what matters most

  • Save 35-50% across metrics, logs and traces—and bring your own cloud

  • Scale confidently with tiers designed for small teams to global enterprises

Real stories from real customers

“[Grafana Cloud] gives us a holistic view to understand our systems from a user’s perspective, very much from the customer’s eyes giving us those journeys so we know when a customer’s impacted.”

Dylan MorleyLead Principal Engineer, ASOS

Get full-stack observability in Grafana Cloud

free
いつも
$0

個人プロジェクト、新しいアイデアの探求、初期段階のスタートアップに最適です。料金は一切かかりません。

利点:
  • 使用制限付きのすべてのGrafana Cloudサービス

  • 適応型テレメトリー、AIアシスタント、その他多くの機能

  • コミュニティサポート

  • メトリクス、ログ、トレース、プロファイル、k6パフォーマンステストの保持期間は14日間

pro
セルフサービス
から
$19/月 + 使用量

より多くのリテンション、基本的なサポート、および使用量ベースの価格設定でスケーリングの準備ができました。

Freeに含まれるすべてに加えて:
  • すべてのGrafana Cloudサービスへの無制限アクセス。無料枠を超えた分は使った分だけ支払うだけです。

  • 適応型テレメトリー、AIアシスタント、その他多数

  • 8X5メールサポート

  • メトリクスの保持期間は13ヶ月です。ログ、トレース、プロファイル、及びk6パフォーマンステストの保持期間は30日です。

enterprise
フルサービス
開始日時
25,000ドル/ 年 消費 約束

セキュリティ、コンプライアンス、デプロイメントの要件を持つ企業向けのフルサービス提供。

考えていることについて話しましょう:
  • プレミアムサポート

  • カスタムリテンション

  • 導入の柔軟性(パブリッククラウド、フェデラルクラウド、または独自のクラウド)

Part of your Grafana Cloud observability platform

Works seamlessly with other Grafana Cloud offerings including:

Frequently asked questions

なぜGrafana Cloudを選ぶのか

オープンで統合されたプラットフォーム

OpenTelemetryネイティブの可観測性とロックインなしで、Kubernetesモニタリング、アプリケーション可観測性、Grafana SLO、RUMのような即時使用可能なソリューションを1つの統合された体験で提供します。

コスト効率

未使用のデータを除外するAdaptive Telemetryで、洞察力を犠牲にすることなくコストを最適化し、実際に価値を生み出すものに予算を振り向けましょう。支出の監視、制御、調整をサポートするコスト管理ツールと組み合わせて使用してください。

AIと自動化

Grafanaアシスタントは、エージェント的なワークフロー、事前に構築されたダッシュボード、インテリジェントフィルター、およびカスタマイズされたアラートを強化し、より迅速で効率的なインシデント対応のために必要なデータを提示します。

安全。準拠。実績あり。
認定証を見る
FEDRAMP準拠
NATSEC100 認定
PCI DSS 準拠
A-LIGN認定
AICPA SOC タイプ II 検証済み
GDPRに準拠