

Grafana 12.4 release: faster and easier data visualization, observability as code updates, and more
As we gear up for Grafana 13, the next major release of the open source data visualization platform that we’ll announce at GrafanaCON this April, our engineering team is still shipping some powerful new features along the way.
Case in point: Grafana 12.4 is officially here, and there’s a lot to be excited about.
The latest minor release includes a ton of updates that help you build and design dashboards faster than ever, as well as manage and scale those dashboards seamlessly over time.
Below are just some of the highlights from Grafana 12.4. If you want to explore all the latest updates, please refer to the changelog or our What’s New documentation, and be sure to check out the TL;DR video below.

Managing dashboards as code: the latest in Git Sync
Available in public preview in Grafana Cloud, and experimental in Grafana OSS and Grafana Enterprise
As you scale your Grafana instance, managing dashboards through the UI alone can become chaotic — changes are hard to track, duplication increases, and consistency suffers. While managing dashboards as code can improve visibility and help with version control, it often adds complexity and creates bottlenecks because of custom CI and processes.
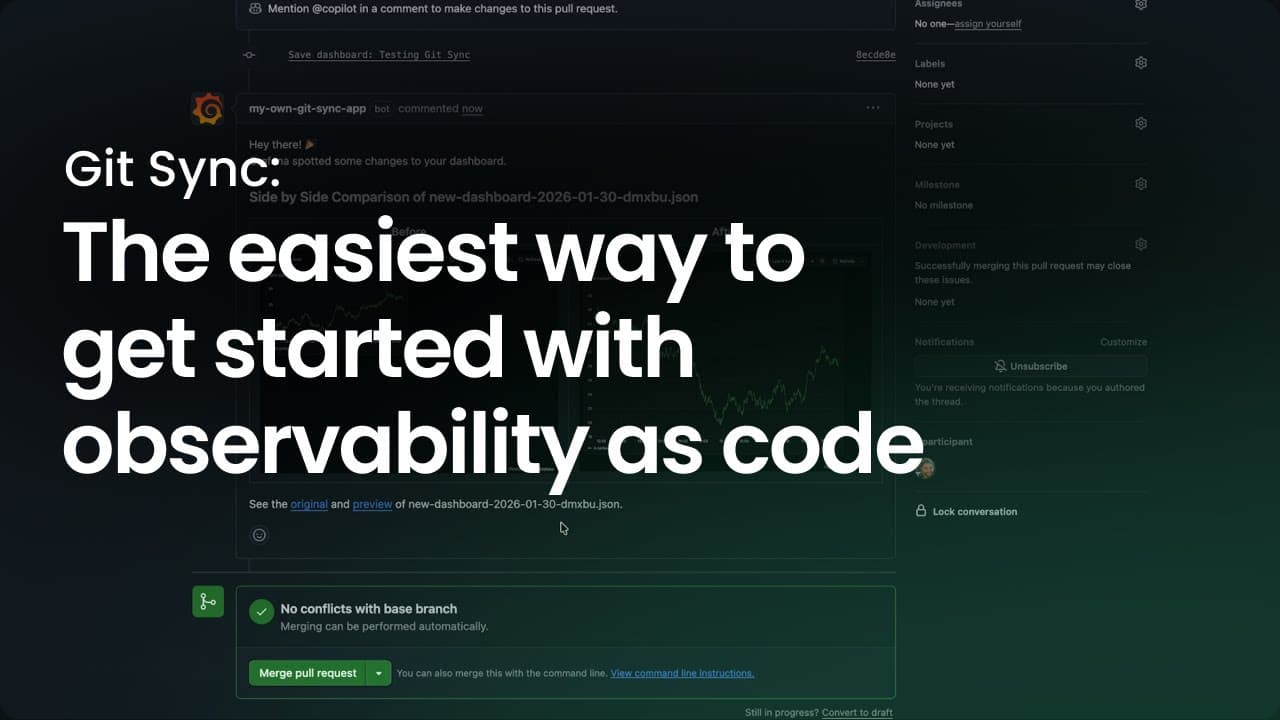
Git Sync, a Grafana feature we rolled out last year, bridges that gap by bringing a native GitOps workflow into Grafana. This enables teams to version dashboards, submit pull requests, and manage approvals seamlessly within GitHub or Grafana directly.
Git Sync is now available in public preview in Grafana Cloud and experimental in Grafana Enterprise and OSS. It includes new features that give teams even more flexibility and control when managing dashboards as code:
- Github App authentication: You can now connect Grafana to your repositories using a personal access token or with GitHub Apps for enhanced security.
- Enhanced branch selection in Save drawers: Branch selection now feels more natural and aligns with the experience you’re used to when submitting changes to provisioned resources.
To learn more, please check out our Git Sync blog post and documentation.
Building intuitive, easier-to-navigate dashboards: what’s new in Dynamic dashboards
Available in public preview in all editions of Grafana
As teams connect more data sources to Grafana, their dashboards become larger and more complex. This can lead to cluttered layouts, empty panels, and excessive scrolling, making dashboards harder to navigate and maintain.
Last year, we introduced Dynamic dashboards to address this very challenge. Based on the robust foundation of the Scenes library and our updated dashboard schema, Dynamic dashboards delivers a more intuitive, responsive, and scalable experience to better support growing teams.
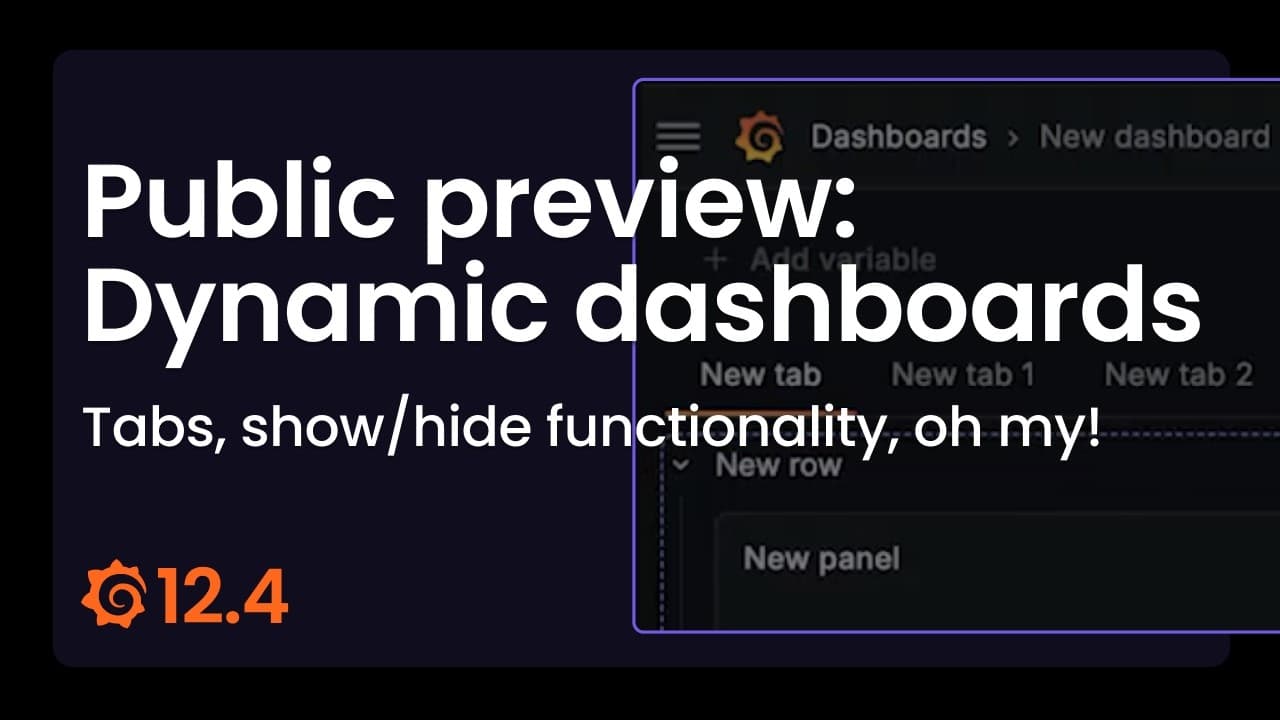
Now in public preview, Dynamic dashboards includes new features and a revamped user experience that make it even easier to find the exact insights you need, when you need them.
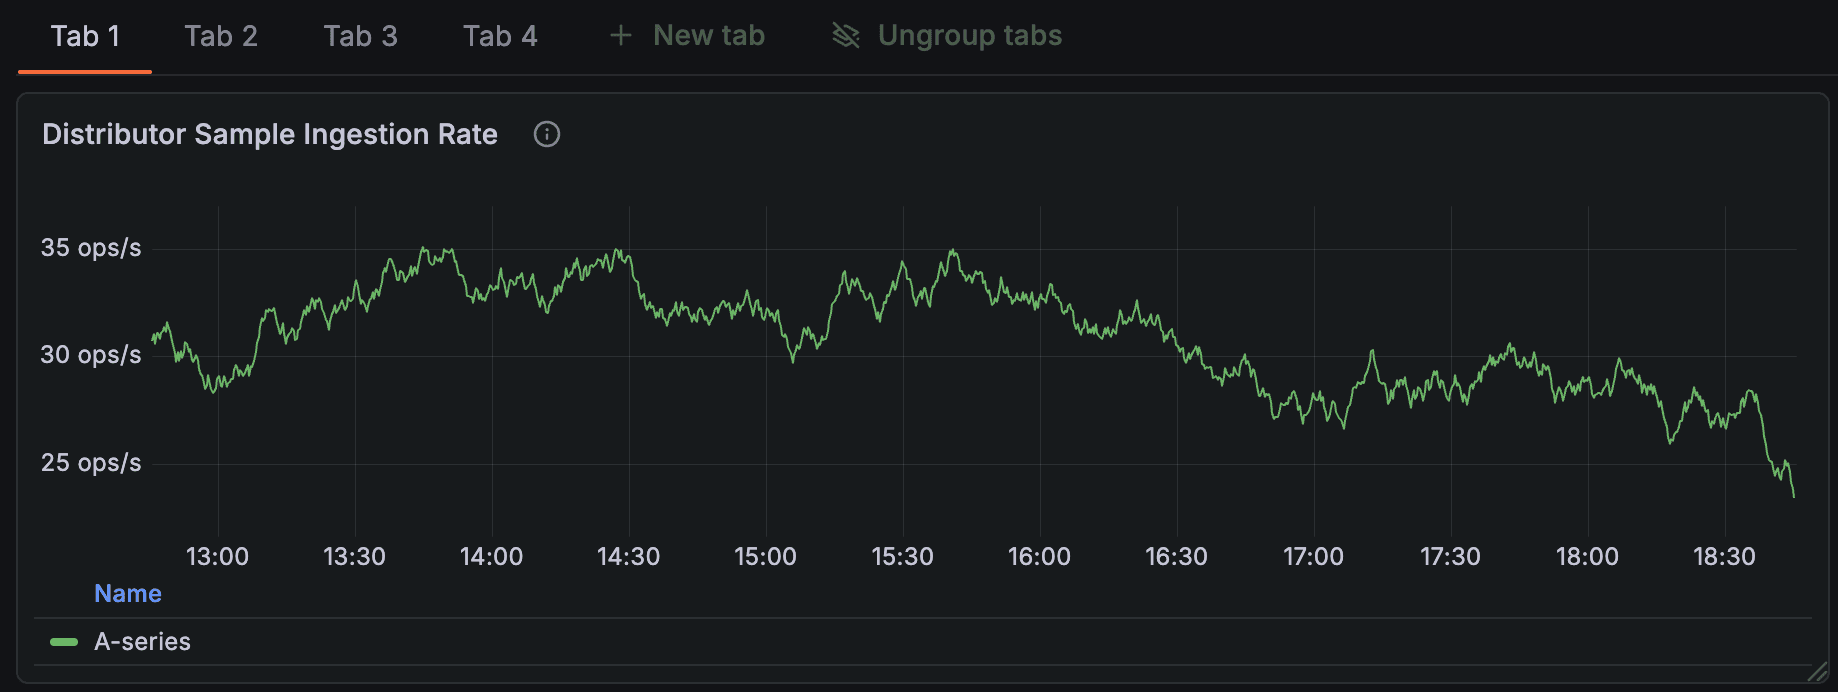
Flexible tabs
You can now structure your dashboards horizontally, as well as vertically, to organize content for different contexts and user groups.
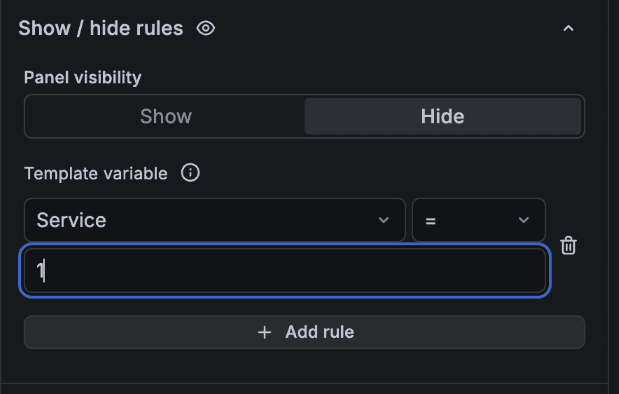
Show/hide functionality
Show or hide panels, rows, or tabs based on the selected variable or whether the panel returns data, so viewers only see what’s relevant to their use case or context.
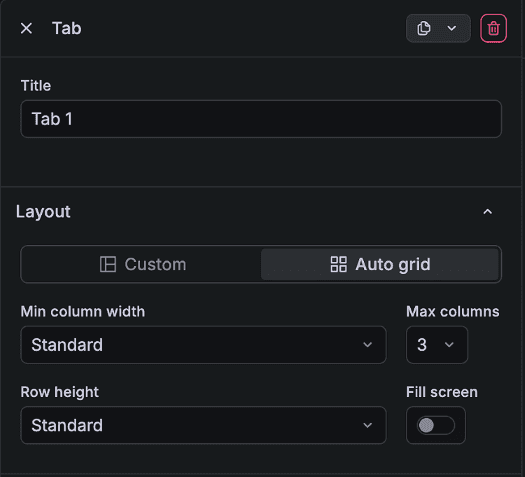
Auto grid layout
By setting your row, tab, or dashboard to Auto grid, the panel size will adapt to the space available in the display. You can configure minimum column width, row height, and the maximum number of columns per row to meet your requirements.
If you prefer setting different panel widths and heights within the same row, you can use the Custom layout option, which is the same as the traditional dashboards grid. Auto grid also enables the show/hide functionality. (To avoid leaving gaps in the dashboard, you must set the layout to auto grid before configuring any show/hide rules.)
Dashboard content outline
You can now quickly discover the content you need in your dashboards through a clickable outline.
As an editor, click on an element in the outline to scroll to it and select it to make quick changes to the title or description. As a viewer, click on a panel, row, or tab to navigate to it instantly and find the information you’re looking for.
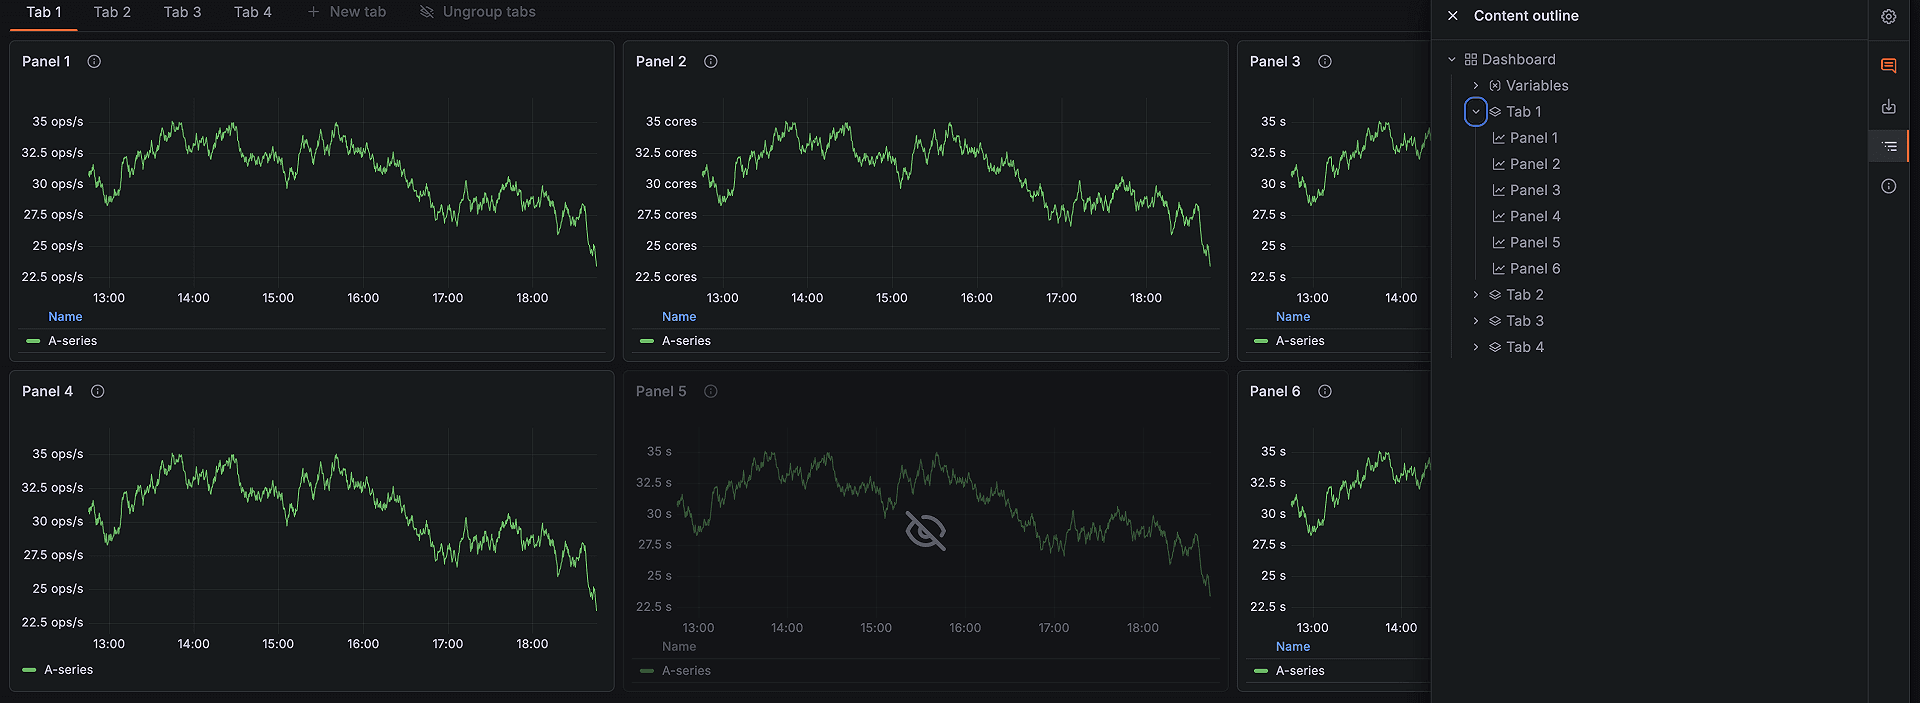
Side toolbar instead of a second top toolbar
To provide additional vertical space, we’ve replaced the second top toolbar with a toolbar on the right side of the screen. This helps both viewers and editors see more information at once. You can find the dashboard content outline and alert rules in the side toolbar, and editors can also access dashboard settings there.
Context-aware editing from the dashboard
Quickly update a panel’s title and description from the dashboard sidebar without entering panel edit mode. This sidebar also lets you quickly edit rows, tabs, and template variables.
To learn more about Dynamic dashboards, please check out our documentation.
Visualizing data faster: Suggested dashboards, templates, and more
Grafana 12.4 includes a host of new features that help you go from zero to insights in minutes, regardless of experience level.
Suggested dashboards tailored to your data sources
Available in public preview in all editions of Grafana
For many users, especially those new to Grafana, opening a blank dashboard can feel a bit overwhelming.
That’s why we’re introducing Suggested dashboards, a feature that surfaces suggestions for pre-built dashboards based on your connected data sources. Curated from both Grafana Labs and the broader OSS community, these pre-built dashboards help you:
- Enable contextual discovery: Get suggestions for pre-built dashboards that are tied specifically to the data source you have connected.
- Accelerate setup: Immediately load and save suggested dashboards, which you can use as a starting point for further customization.
- Reduce friction: Streamline the onboarding process by offering actionable content directly after data source configuration.
Here’s how it works:
After you successfully configure a data source, click the Build a dashboard button.
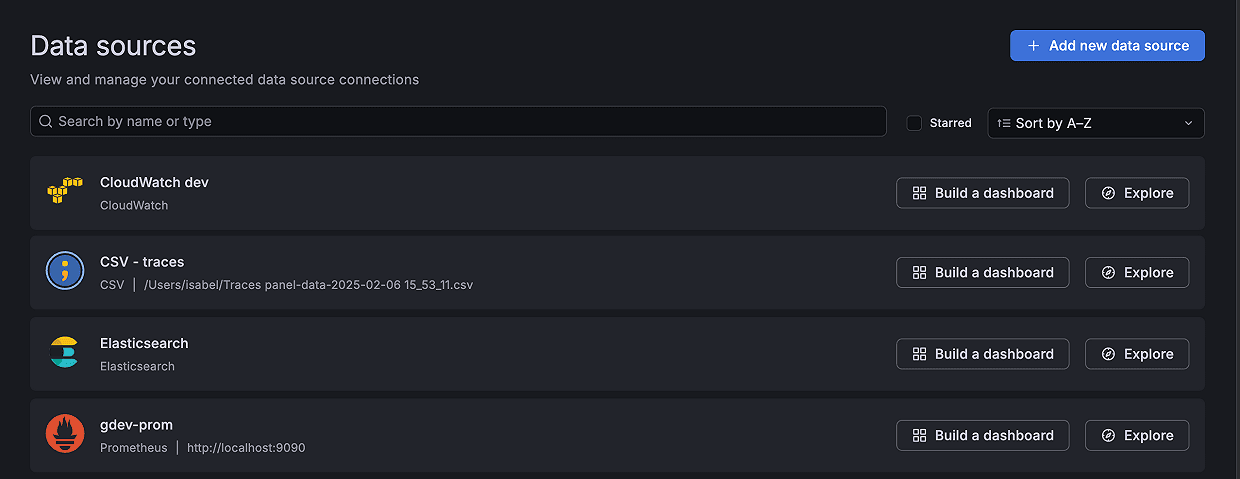
The empty dashboard that opens up will automatically display a list of suggested dashboards based on the data source.
To learn more, please visit our docs.
Creating dashboards from templates
Available in public preview in all editions of Grafana
You can now create dashboards based on templates using sample data, and then connect your actual data sets to power them with real metrics. This provides a structured, best-practice starting point for your dashboard layouts.
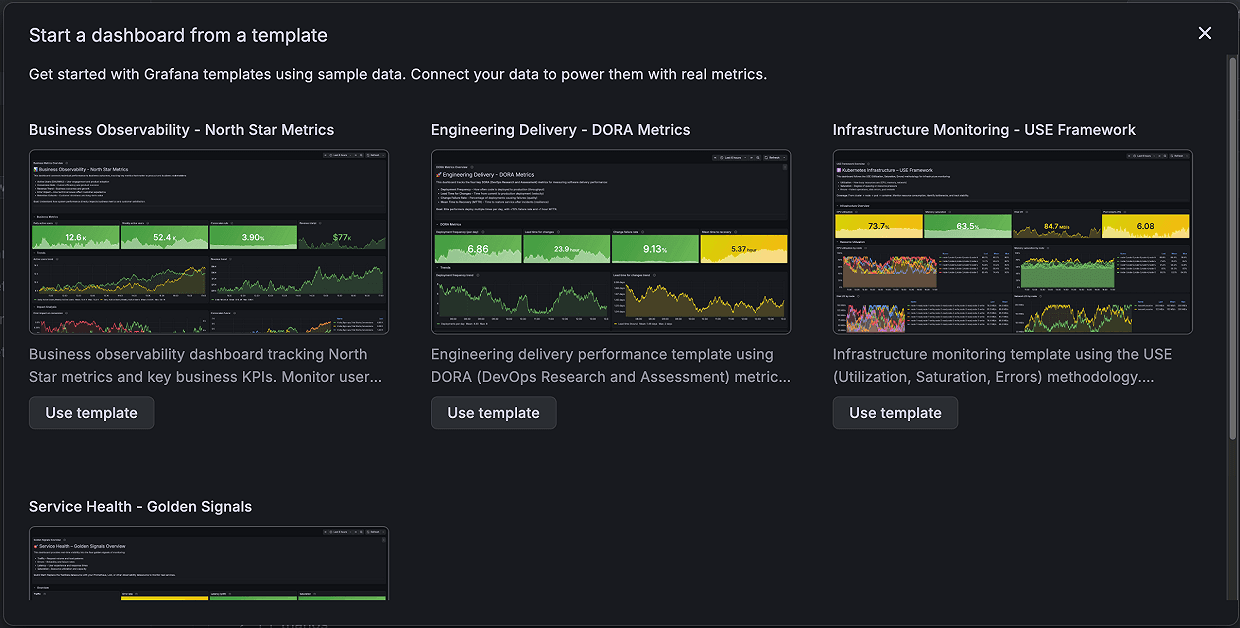
Templates provide standardized dashboard layouts designed to help you answer both engineering or business questions. For example, the DORA template allows all teams within an organization to measure delivery performance using a widely adopted industry framework.
All templates include a banner panel that clearly indicates the dashboard is using sample data:
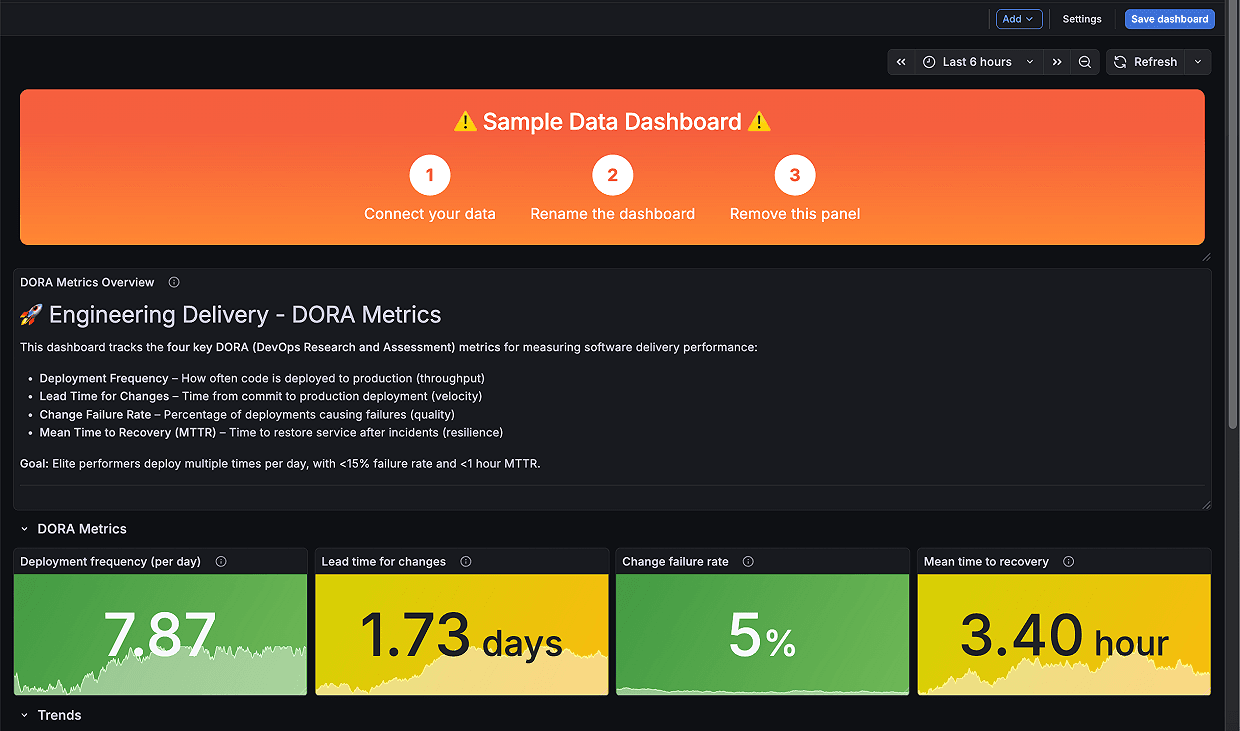
To make the dashboard your own, save it, update each panel’s data source to connect to your own data, and make any other changes to display your data effectively. You can also use Grafana Assistant, the AI-powered agent in Grafana Cloud, to update the dashboard with your own data sources and create queries for you.
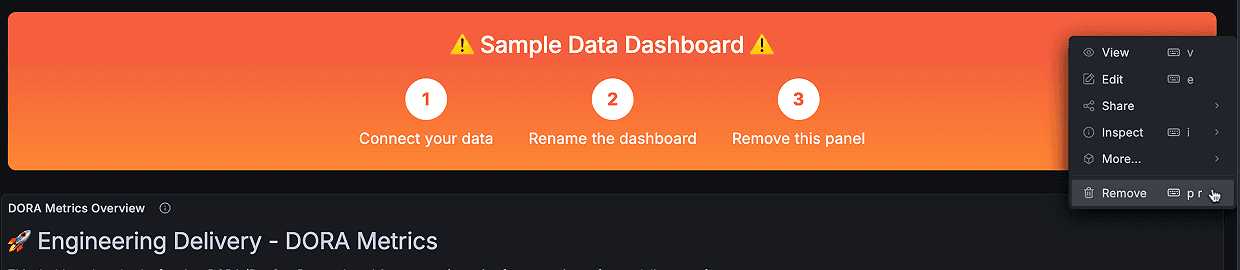
When you’ve finished making your changes, remove the banner panel:
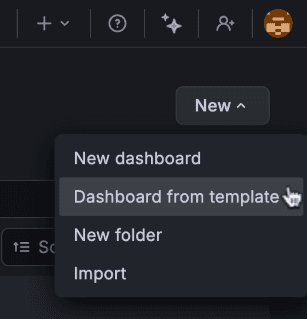
You can access this feature from the New drop-down menu in dashboards, the quick Add button in the top-right corner anywhere in Grafana, as well as in the command palette.
To learn more, visit our docs.
Updated Visualization suggestions
Available in public preview in all editions of Grafana
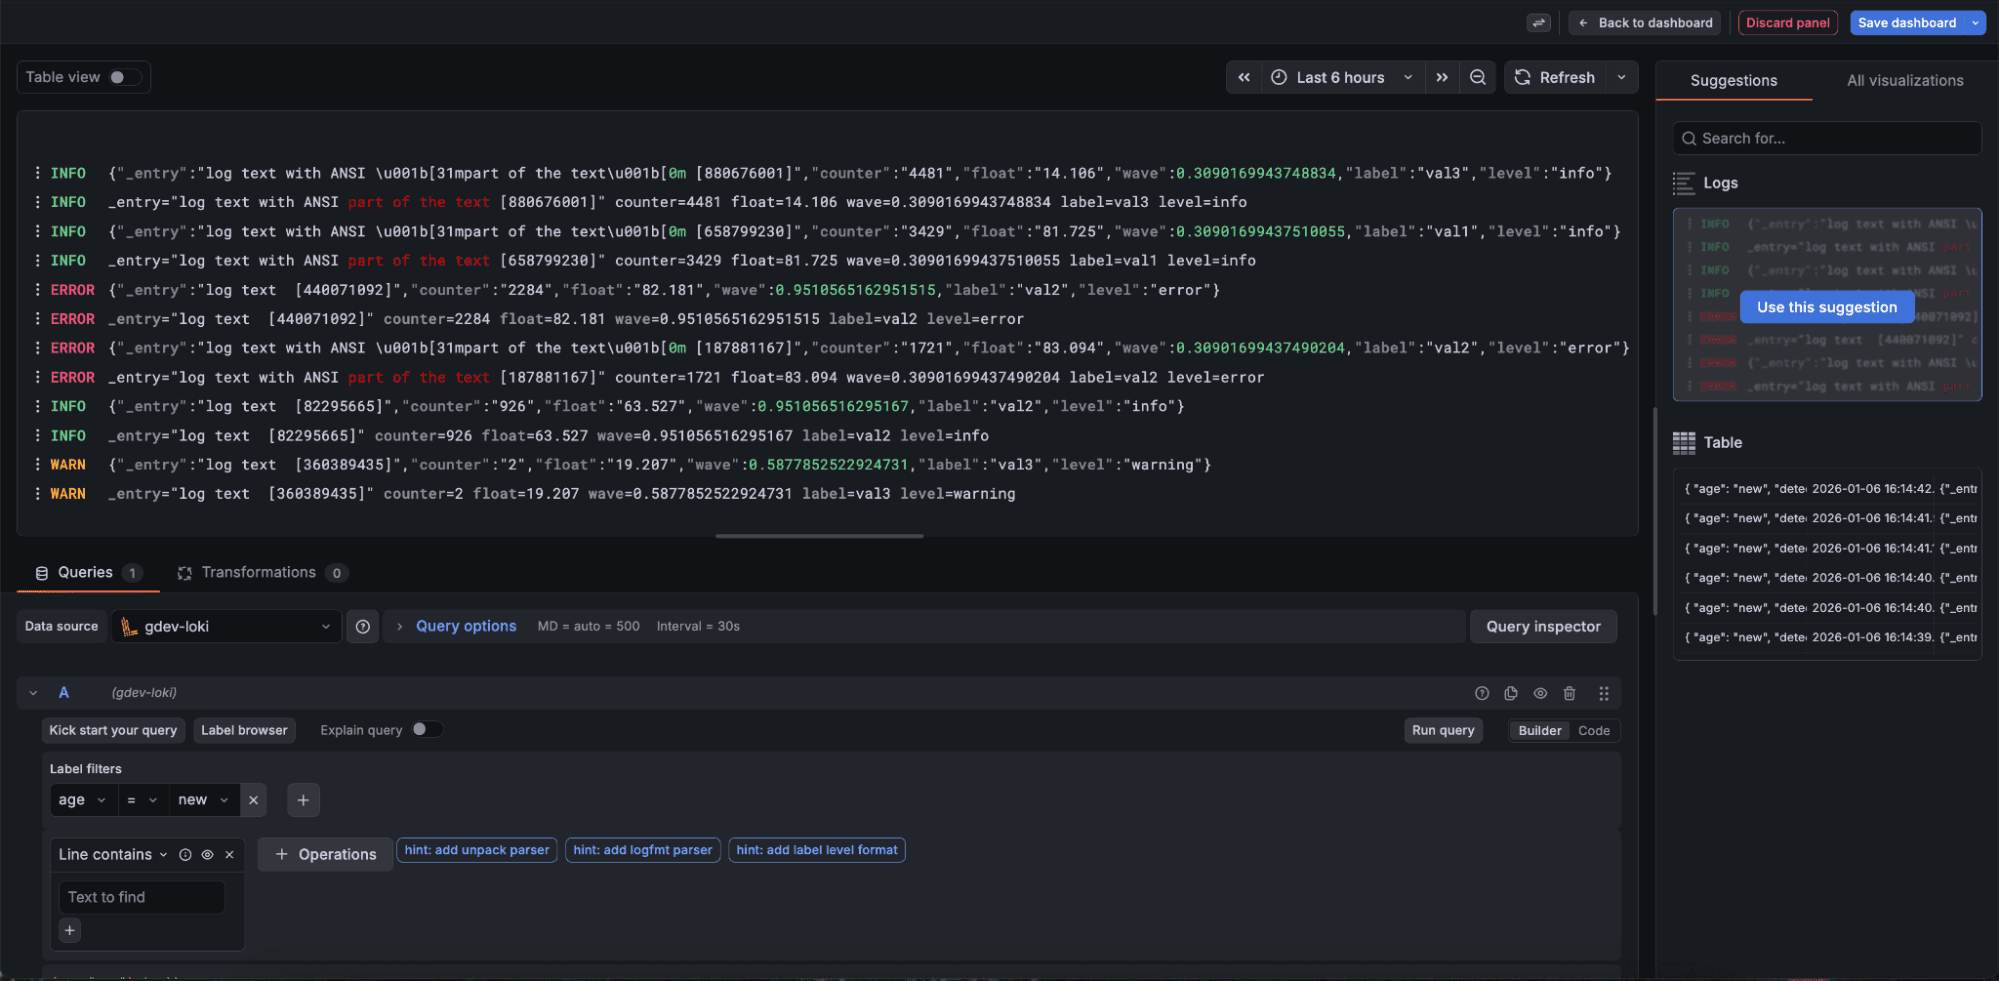
Initially rolled out in Grafana 8.3, Visualization suggestions have been updated to provide more applicable suggestions, and are now the default method to select a panel visualization.
When you preview a visualization using the Suggestions feature, you now get a full-sized preview of the suggestion in the panel editor before you select it.
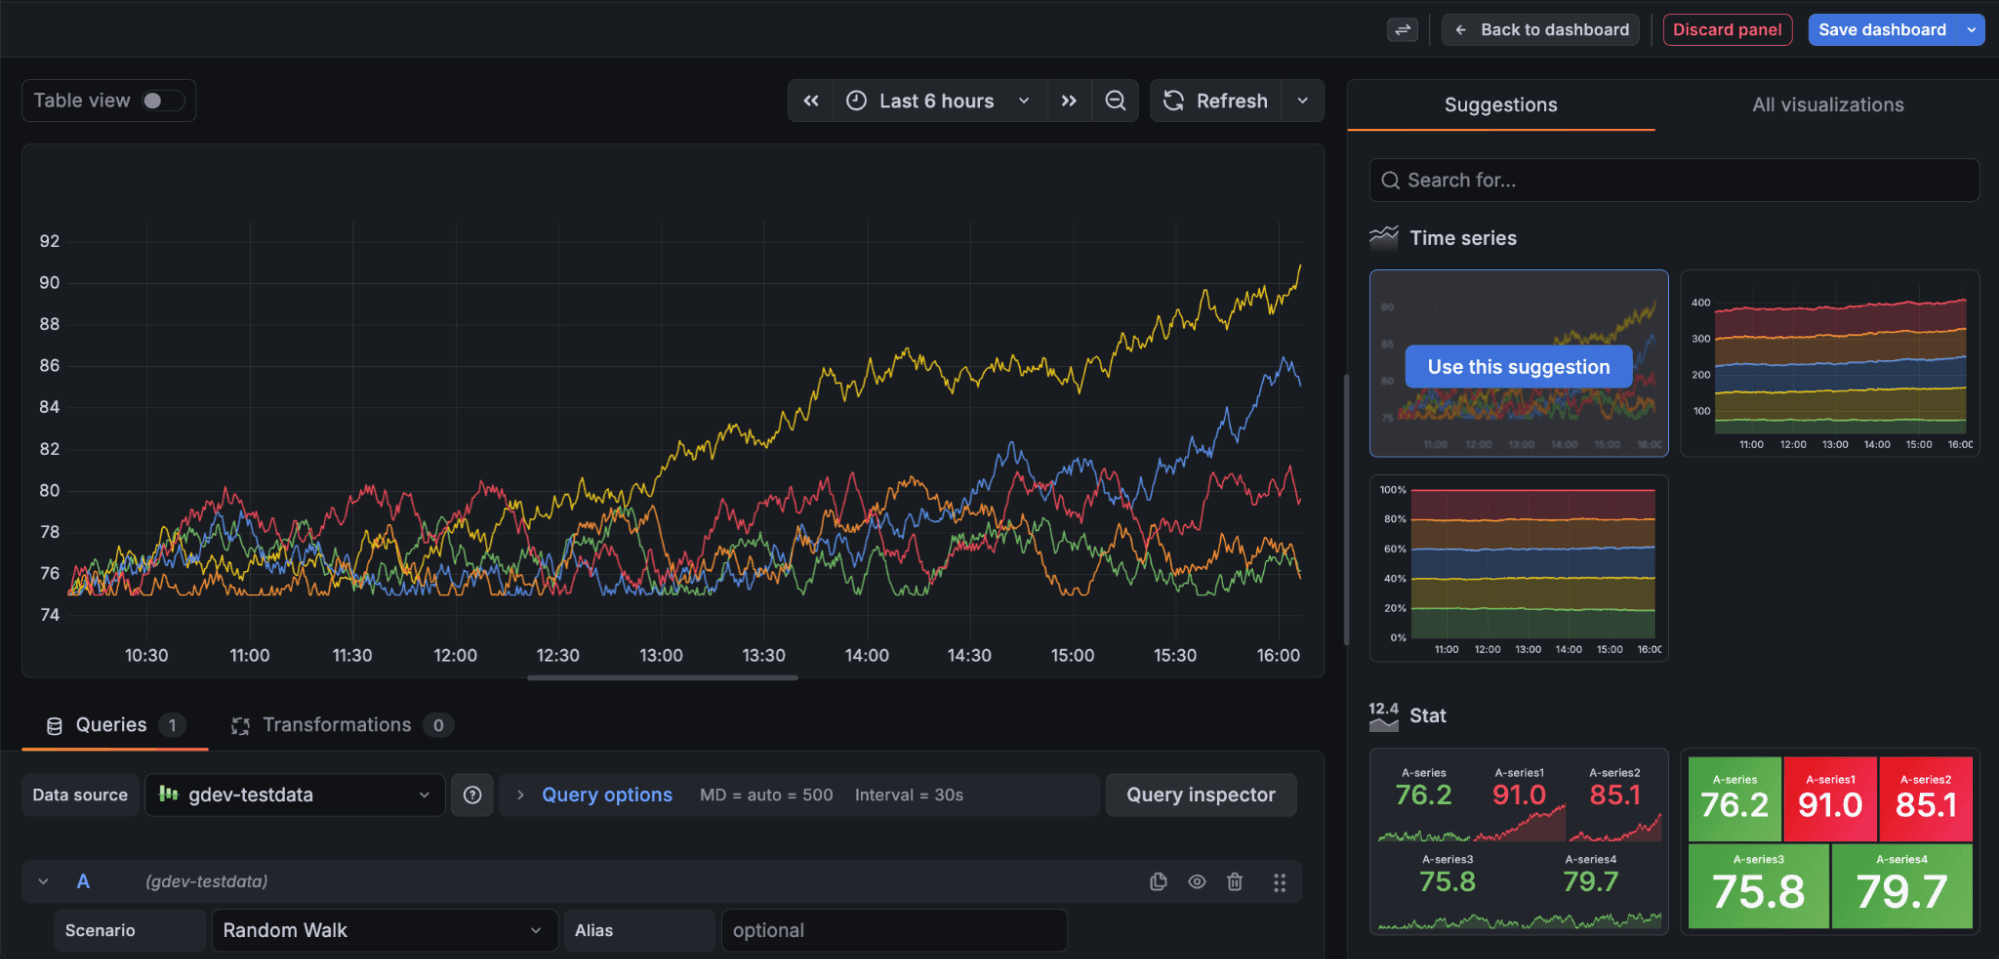
Alongside some UI enhancements, we’ve also improved the quality of suggestions by leveraging metadata from your data sources, such as data frame types in the data plane, to recommend visualization types best suited to your data.
To try out the updated visualization suggestions experience, enable the newVizSuggestions feature toggle.
More updates to streamline data visualization
Reducing visual noise with the new dashboard controls menu
Generally available in all editions of Grafana
Variables taking over your screen? You can now choose to hide variables, annotation controls, or dashboard links from the main toolbar and place them in the new dashboard controls menu instead.
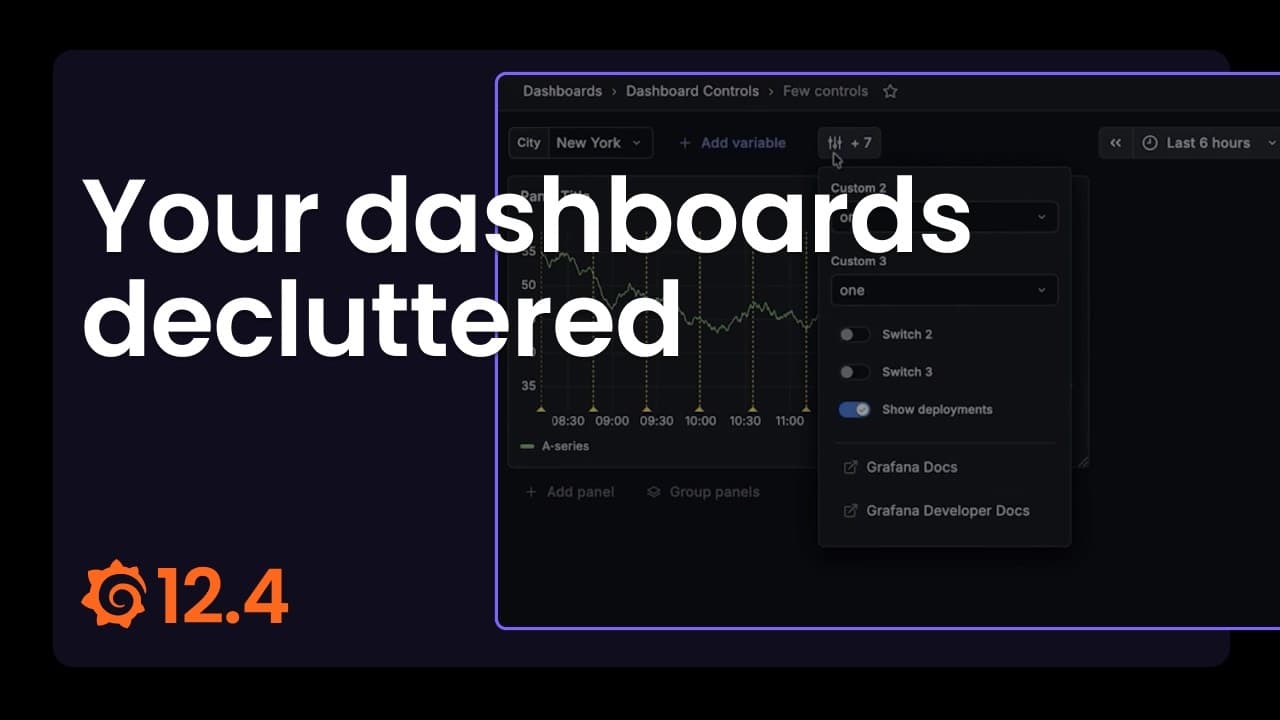
When any of these items are configured to appear in the menu, Grafana shows a dedicated toolbar button with a count of how many controls are available. Clicking the button opens a neatly structured menu where variables appear first, followed by annotation controls and links, each grouped for easy navigation.
Filtering query variable values with regex patterns
Generally available in all editions of Grafana
You can now apply a regex pattern to the display text instead of the variable value to find the right query variable values to show. This is a great shortcut when the text you see in the UI doesn’t match the raw value you need to capture.
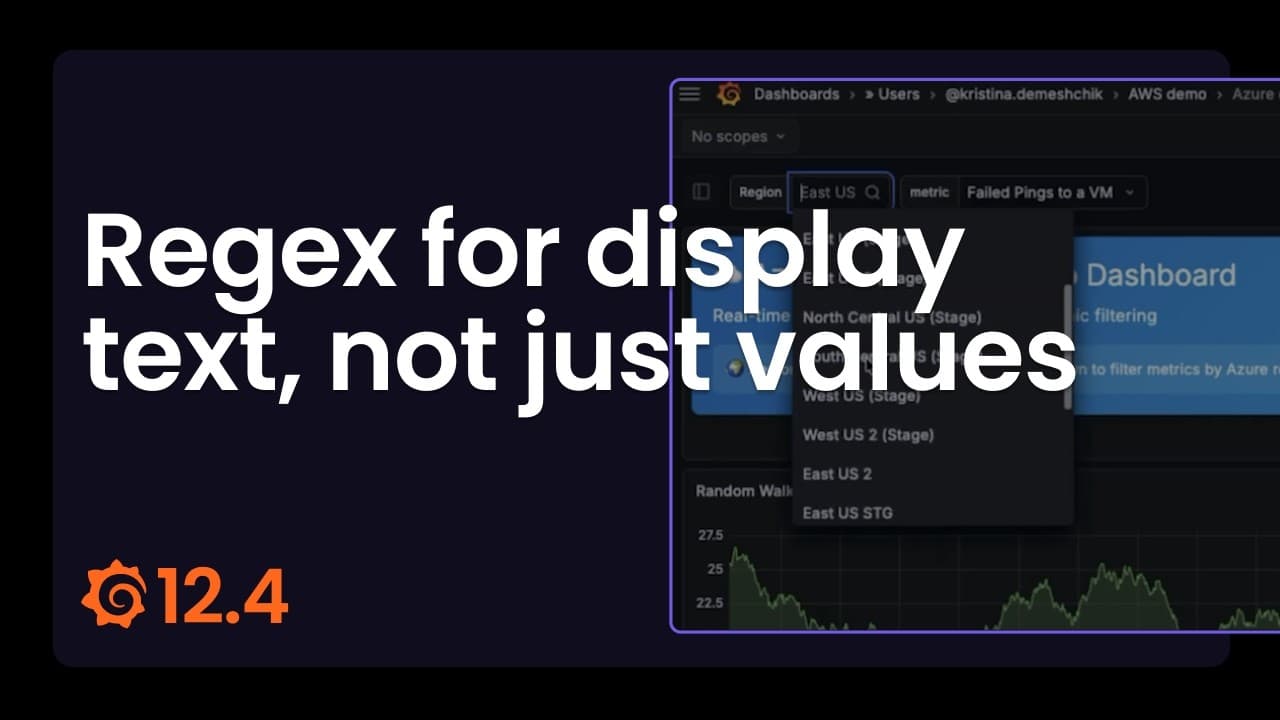
For example, when you configure query variables with regex for data sources like Azure Monitor, Amazon CloudWatch, and AWS IoT, the regex matches the value. However, this value is often different from the display text, which makes it difficult to match the value you need.
To fix this mismatch, use the Apply regex to option in your query variable settings to select whether the regex applies to the value or the display text.
To learn more, refer to the variable documentation.
Mapping one variable to multiple values
Generally available in all editions of Grafana
We’re excited to introduce multi-property variables — a simple, powerful way to map several identifiers to a single variable.
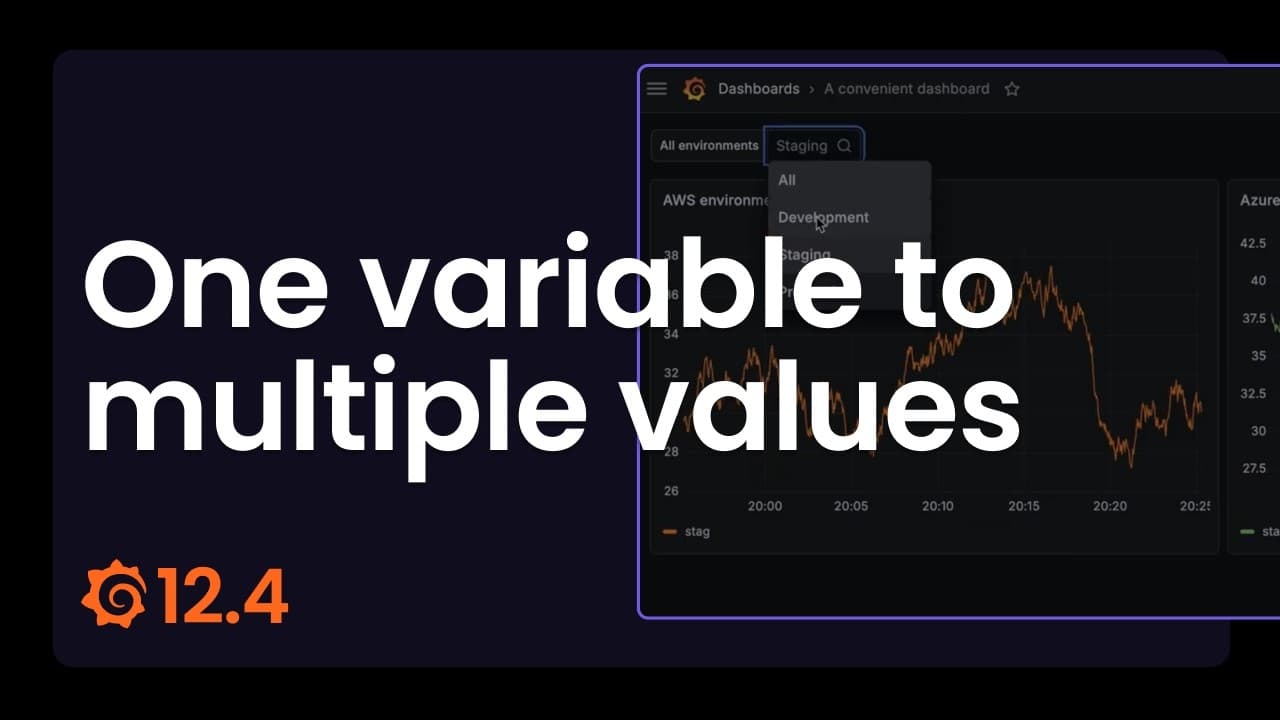
Instead of creating and keeping multiple variables for the same logical concept in sync (for example, an environment identified as “dev” vs. “development”), you can map all of those identifiers to one variable and then reference any property you need in panels and queries. This reduces dashboard clutter and makes multi-source dashboards much easier to author and maintain.
This feature is supported for the Custom and Query variable types. For query variables, you can create multi-property variables for Infinity and PostgreSQL data sources.
You can read more about this feature and how it works in our documentation.
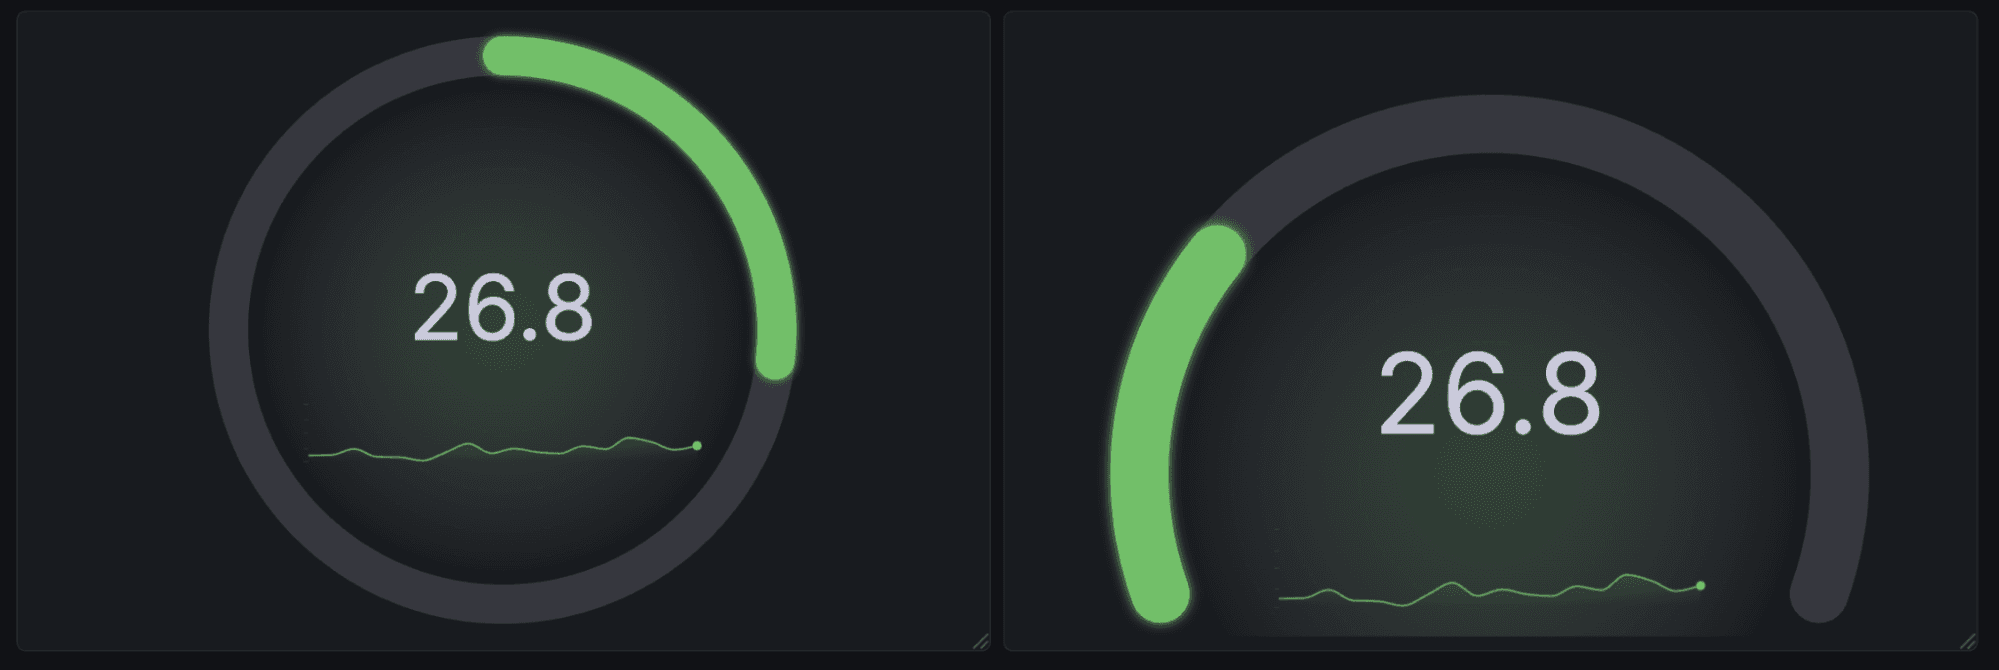
Revamped gauge visualization
Available in public preview in all editions of Grafana
We’ve reimagined the gauge visualization to provide more data representation options based on your needs.
For example, the circular shape has been introduced as an alternative to the existing Arc gauge under the new Style option.

We’ve also added sparkline support to the gauge, which improves its usefulness as an alternative to the stat visualization for time series data.
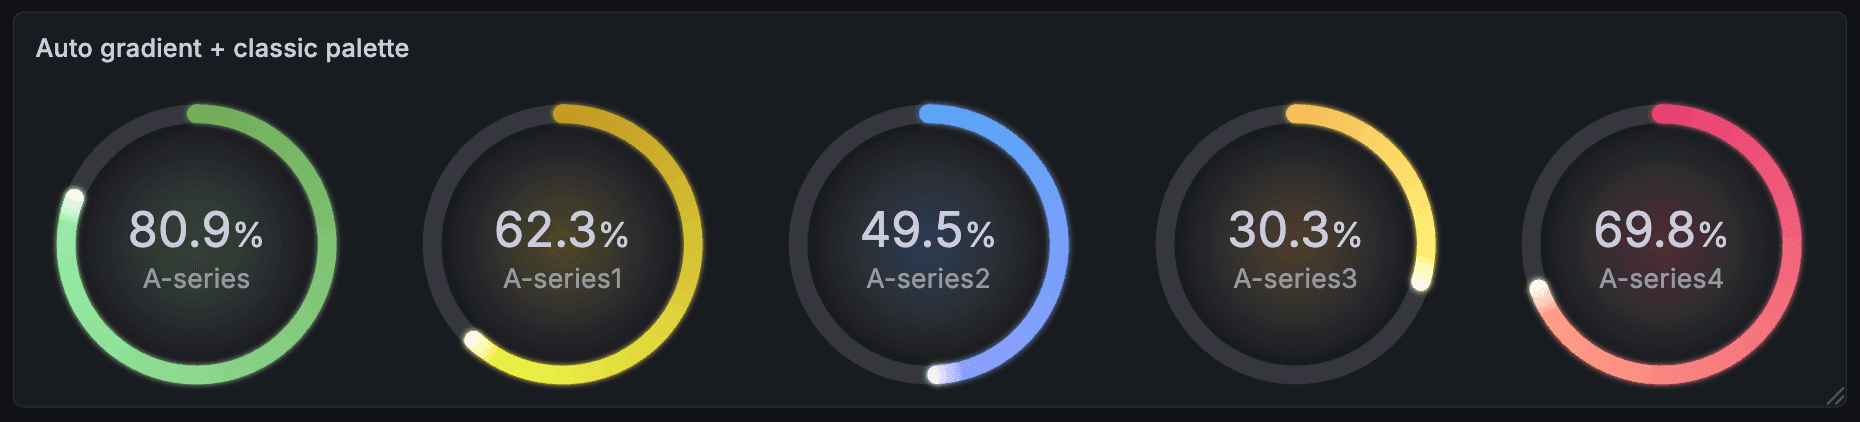
We added gradient support that does much more than look pretty; it helps users interpret panels with thresholds, or with series that use a continuous color scheme.
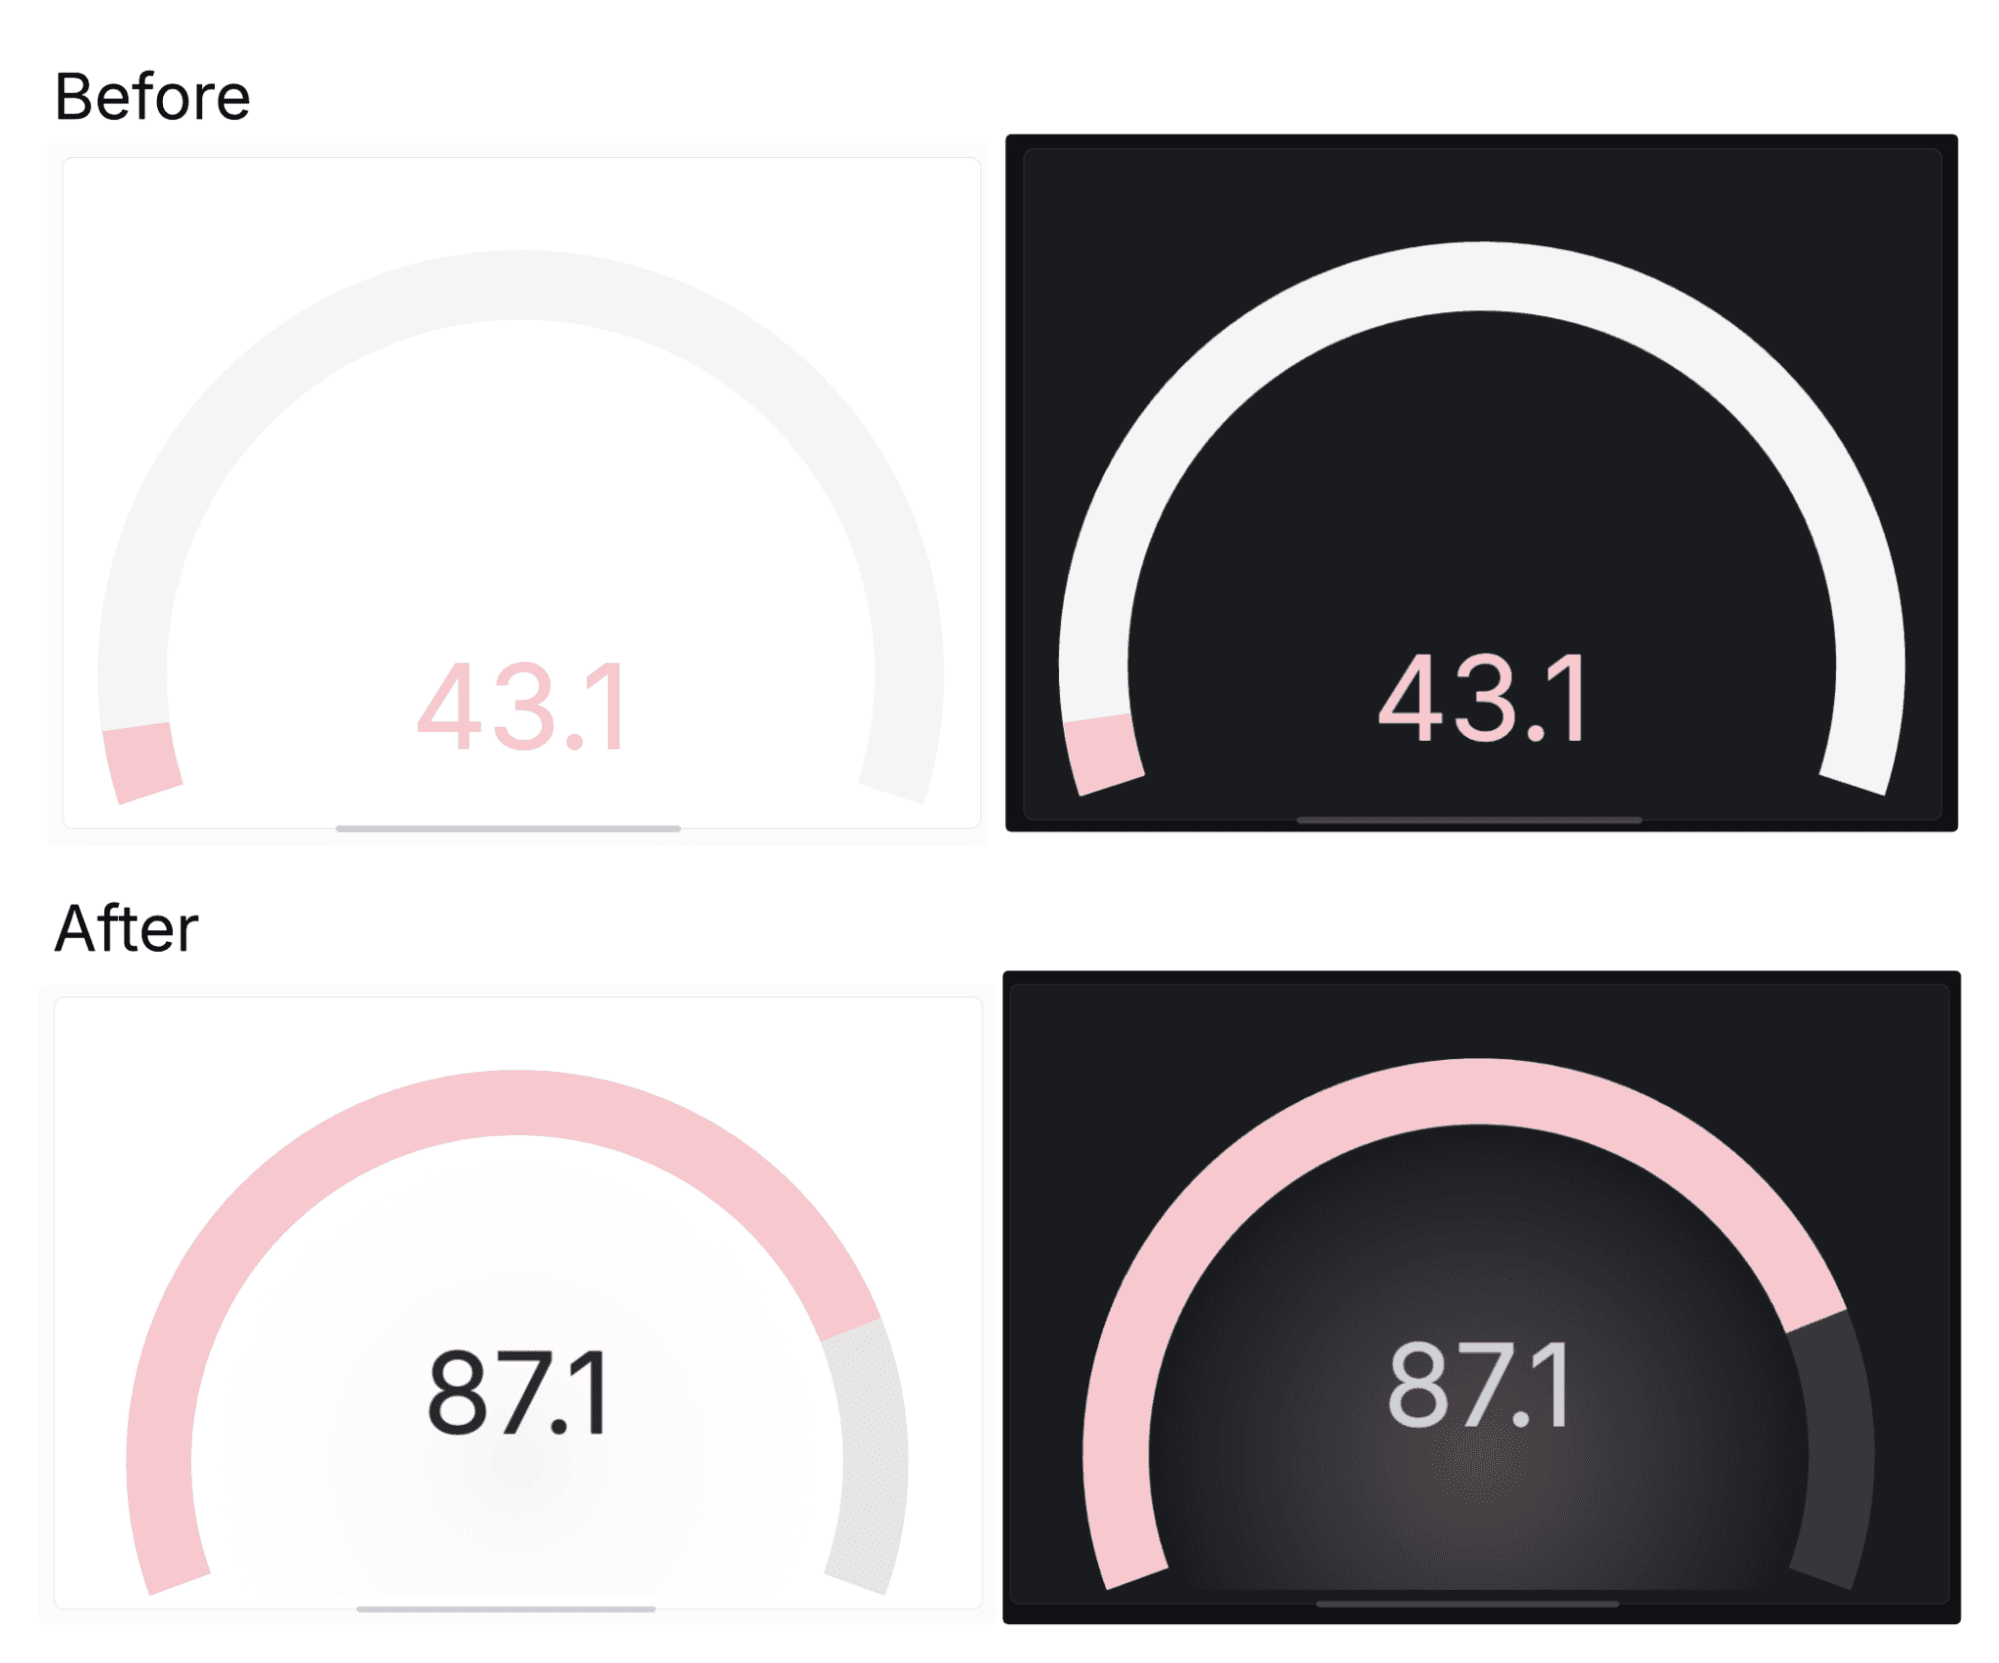
The new gauge visualization also features accessibility improvements. The Center glow option renders the gauge’s current color value as a transparent glow behind the gauge’s text. This replaces the previous behavior of changing the color of the text itself, and helps avoid situations where text can become illegible due to an individual user’s theme.
Lastly, there are several other new configuration options, including:
- Rounded bars (under Bar style)
- Configurable bar thickness
- Endpoint markers for readability
- New text display modes to precisely configure the information presented in your visualization
To try out the revamped gauge visualization, enable the newGauge feature toggle. And to learn more about this visualization type, in general, please check out our docs.
Time range pan and zoom
Generally available in all editions of Grafana
We’re excited to introduce time range pan and zoom in Grafana dashboards and panels, a new way to explore your metrics and data more intuitively and efficiently.
You can use dashboard-level controls to jump one full time span backward or forward. For more precise time travel, we’ve made the x-axis of time series visualizations interactive at the panel level, as well. Simply click and drag the x-axis timestamps horizontally to move forward or backward in time, then release to update the dashboard time range.
To zoom in on a time range, click and drag in the visualization area from a start time to any end time, and then release. To zoom out, double-click on the visualization area to expand the time range by half on either side of the center, showing twice as much time.
Finally, two new time range keyboard shortcuts have been added to Grafana. Typing t+ zooms in to half the current time range, and conversely t- zooms out to twice the current time range.
Time range pan and zoom applies to all visualizations that support time series data:
- Candlestick
- Heatmap
- State timeline
- Status history
- Time series
More efficient and flexible log exploration
Grafana 12.4 provides new, more customizable options for exploring your logging data, especially for teams using OpenTelemetry or the Grafana Logs Drilldown queryless app.
Enhanced display for OpenTelemetry log lines
Experimental in all editions of Grafana
Grafana now provides smarter defaults for browsing OpenTelemetry log lines, optimized for the way OTel structures logging data.
OpenTelemetry log producers send less information in the log body and more data as structured metadata, or key–value pairs for resource attributes, log fields, and log attributes. Previously, much of this information was only visible when expanding a log line, making important context easy to miss.
Now, Grafana detects OTel log lines and surfaces relevant metadata directly in the log view. Overall, this change makes OpenTelemetry logs easier to scan, faster to understand, and more useful by default, especially in high-cardinality or highly structured logging environments.
For more information, reference our What’s New page.
Logs Drilldown updates
Available in public preview in all editions of Grafana
With Grafana Logs Drilldown, you can visualize and explore your logs without having to write LogQL queries. Part of our suite of Grafana Drilldown apps for queryless, point-and-click data exploration, Logs Drilldown now allows you to:
- Configure default columns: You can now configure default columns for Logs Drilldown directly from the plugin configuration page. This lets administrators define which fields (or columns) are displayed by default based on the selected set of labels, ensuring users immediately see the most relevant information for their use case.
- Save and resume log explorations: You can now save a log exploration in Logs Drilldown and return to it later. Saved explorations include your active filters, so you don’t have to recreate the same view each time you investigate an issue.
Please check out our technical docs to learn more about Logs Drilldown.
Identity and access management enhancements
Here’s a look at some of the latest features to help you secure your Grafana environment and manage user access.
SCIM user and team provisioning
Generally available in Grafana Cloud and Grafana Enterprise
You can now automate your entire user lifecycle and team structures directly from your identity provider (IdP).
We introduced SCIM in public preview last year, and with the move to general availability as part of Grafana 12.4, we’ve removed the “first login” bottleneck. This allows centralized operators to provision, configure, and secure users before they even open the app.
Instead of managing complex sync pipelines and waiting for users to log in to assign permissions, you can now build, test, and scale your entire engineering organizational structure in minutes. Key benefits include:
- Onboard instantly: Users and teams are created the moment they are added to your IdP, enabling immediate configuration in tools like IRM.
- Automate deprovisioning: Gain peace of mind with automatic seat reclamation and instant access removal the second a user is deactivated in your IdP.
- Scale faster: Early adopters of SCIM see more active users within 90 days compared to SAML-only customers, because removing manual friction accelerates platform adoption.
To learn more, please check out our docs and this blog post.
RBAC for saved queries
Available in public preview in Grafana Cloud and Grafana Enterprise
Saved queries — a feature in Grafana that makes it easy to save, share, and reuse queries — now supports role-based access control (RBAC), giving teams a clearer and safer way to share and manage queries.
Two custom roles are available:
- Writer: Create, update, and delete saved queries
- Reader: Reuse existing saved queries
This replaces the previous per-query sharing checkbox with consistent, role-based permissions, making it easier to collaborate on saved queries without risking accidental changes.
To learn more, check out our saved queries documentation.
Extending Grafana: data source updates
We believe you should be able to query and visualize your data, regardless of where that data lives. As a result, we’re always working to expand and enhance our line-up of Grafana data sources.
Here’s a look at the latest updates.
New release of the Zabbix data source for Grafana
Generally available in all editions of Grafana
Version 6.1 of the Zabbix data source for Grafana is here, providing broader sharing capabilities and improved stability for a smoother monitoring experience.
Key updates include:
- Sharing dashboards with anyone: You can now share your Grafana dashboards for Zabbix externally without requiring recipients to have access to your Grafana organization.
- Enhanced stability and performance: New query guardrails provide proactive warnings when a query might exceed Zabbix API limits, helping you prevent performance degradation and unexpected resource usage. You can also explicitly set query timeouts in the configuration, preventing long-running queries from impacting your system.
- Granular filtering with host tags: You can now use Zabbix host tags directly in your Grafana Zabbix queries, enabling more granular, flexible data filtering and visualization.
You can read more about Zabbix data source in our docs.
Default spreadsheets in the Google Sheets data source
Generally available in all editions of Grafana
You can now set a default spreadsheet when creating a Google Sheets data source, so it’s automatically available whenever the data source is used. This means instead of repeatedly selecting the same file, you can define it once and reuse it across dashboards, panels, and queries.
The result is a smoother workflow for common use cases like tracking KPIs in shared spreadsheets, visualizing operational checklists, or building internal dashboards from collaboratively maintained data.
To learn more about the Google Sheets data source for Grafana, please visit our docs.
Learn more about Grafana
For an in-depth list of all the new features in Grafana, check out our Grafana documentation, the Grafana changelog, or our What’s New documentation.
Join the Grafana Labs community
We invite you to engage with the Grafana Labs community forums. Share your experiences with the new features, discuss best practices, and explore creative ways to integrate these updates into your workflows. Your insights and use cases are invaluable in enriching the Grafana ecosystem.
Upgrade to Grafana 12.4
Download Grafana 12.4 today or experience all the latest features by signing up for Grafana Cloud, which offers an actually useful forever-free tier and plans for every use case. Sign up for a free Grafana Cloud account today.
Our Grafana upgrade guide also provides step-by-step instructions for those looking to upgrade from an earlier version to ensure a smooth transition.
A special thanks to our community
We extend our heartfelt gratitude to the Grafana community!
Your contributions, ranging from pull requests to valuable feedback, are crucial in continually enhancing Grafana. And your enthusiasm and dedication inspire us at Grafana Labs to persistently innovate and elevate the Grafana platform.
Grafana Cloud is the easiest way to get started with metrics, logs, traces, dashboards, and more. We have a generous forever-free tier and plans for every use case. Sign up for free now!

