%3Aquality(90)%2F&w=3840&q=75)
%3Aquality(90)%2F&w=3840&q=75)
%3Aquality(90)%2F&w=3840&q=75)
Visual playback of the user journey: Introducing Session Replay in Grafana Cloud Frontend Observability


Note: This post originally published in August 2026 and was updated in October 2026 to reflect that there’s no longer a waitlist to access the Session Replay public preview.
Grafana Cloud Frontend Observability helps engineering teams quantify the end user experience by bringing metrics, logs, traces, and user session context to client-side web applications. Teams can monitor application health and performance over time, triage errors, and correlate frontend signals with backend telemetry to investigate issues across the stack.
Yet some of the hardest frontend problems remain difficult to diagnose. A support ticket might report that a checkout button did nothing, a form unexpectedly reset, or a workflow broke only in one browser or on one device. Metrics can reveal a performance regression, logs can capture an error, and traces can expose a slow request, but no single signal shows what the interface actually looked like to the user.
This is exactly why we built Session Replay, an add-on feature in Frontend Observability that provides a visual reconstruction of a user's journey, connected to the telemetry Grafana Cloud already collects. It helps engineering teams move from a reported problem to seeing what happened and knowing exactly where to investigate next.
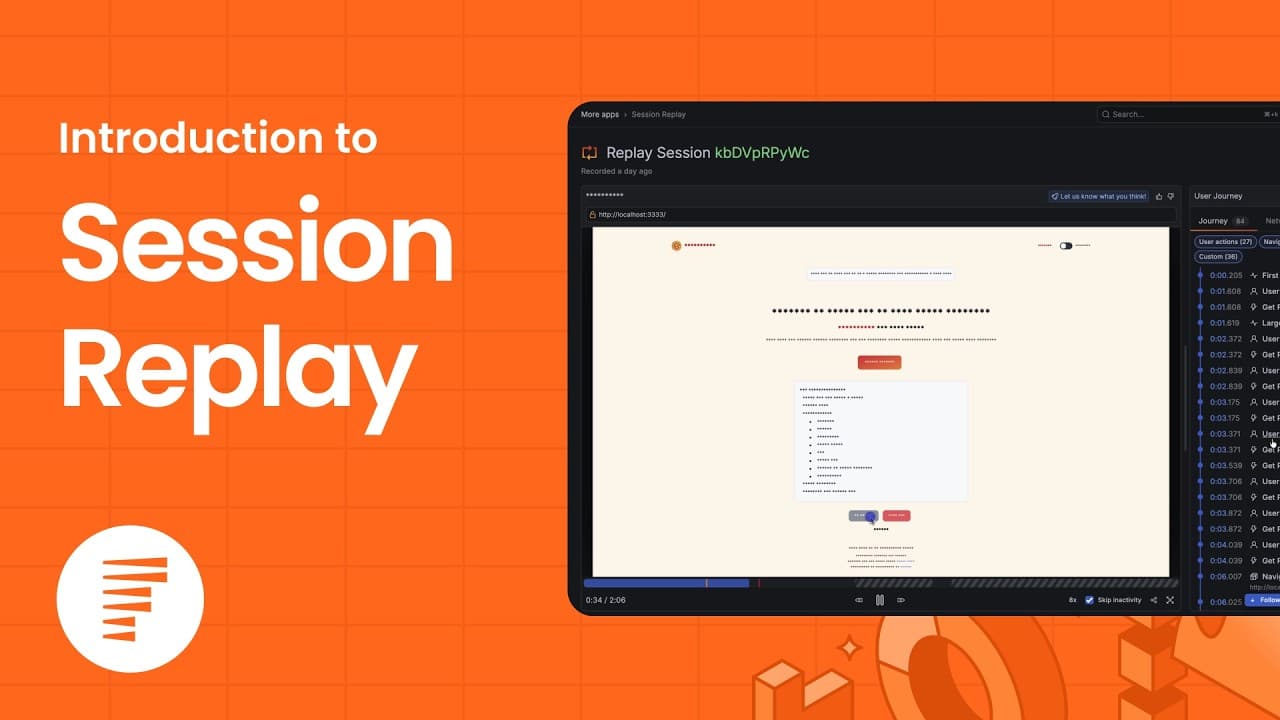
What is Session Replay in Grafana Cloud Frontend Observability?
Session Replay, now in public preview, adds visual playback capabilities to Frontend Observability. It reconstructs how a web application appeared and changed as a user navigated and interacted with it, so you can observe the journey as it unfolded instead of inferring it from individual telemetry events.
Frontend Observability already brings together a chronological timeline of the events within a user session. That timeline tells you what happened and when. Session Replay adds the missing visual context: what was happening in the interface around those events and how one interaction led to the next. Because both views belong to the same session, you can move between the user experience and the relevant technical signals without losing the thread of your investigation.
Session Replay builds on the Grafana Faro Web SDK that already powers Frontend Observability, so it fits into the same instrumentation model instead of requiring a separate agent. The "Get started with Session Replay" section below explains what you need to enable it.
Privacy built in from the start
Session Replay records how users interact with your application and reconstructs what they saw along the way. That level of detail makes it useful for troubleshooting. It is also why privacy has shaped the feature from the start.
Privacy protections begin in the browser, before replay data reaches Grafana Cloud. Session Replay masks all text and input values by default, giving you a strict privacy baseline from the start. Because every application is different, Session Replay provides a highly flexible configuration model that lets you tailor those protections to your application and your organization's privacy requirements. Refer to the Session Replay privacy documentation to learn more about the available controls and configuration options.
Those protections continue after collection. A dedicated role-based access control (RBAC) role limits who can view recordings. Session Replay follows the same 30-day retention policy as other Frontend Observability data.
Your organization remains responsible for informing end users about session recording and obtaining any consent required by applicable law. Before enabling Session Replay in production, we recommend you review and test your configuration against your organization's privacy requirements. For more information, please refer to our Data Privacy documentation.
%3Aquality(90)%2F&w=3840&q=75)
From replay to root cause: investigating frontend issues with Session Replay
To see what Session Replay looks like in practice, let’s walk through an investigation in Grafana Bank, a demo banking application instrumented with the Faro Web SDK.
Our investigation starts with a simple support ticket from a customer: "I tried sending a payment today but it kept failing. Could you help me?"
Troubleshoot hard-to-reproduce frontend issues
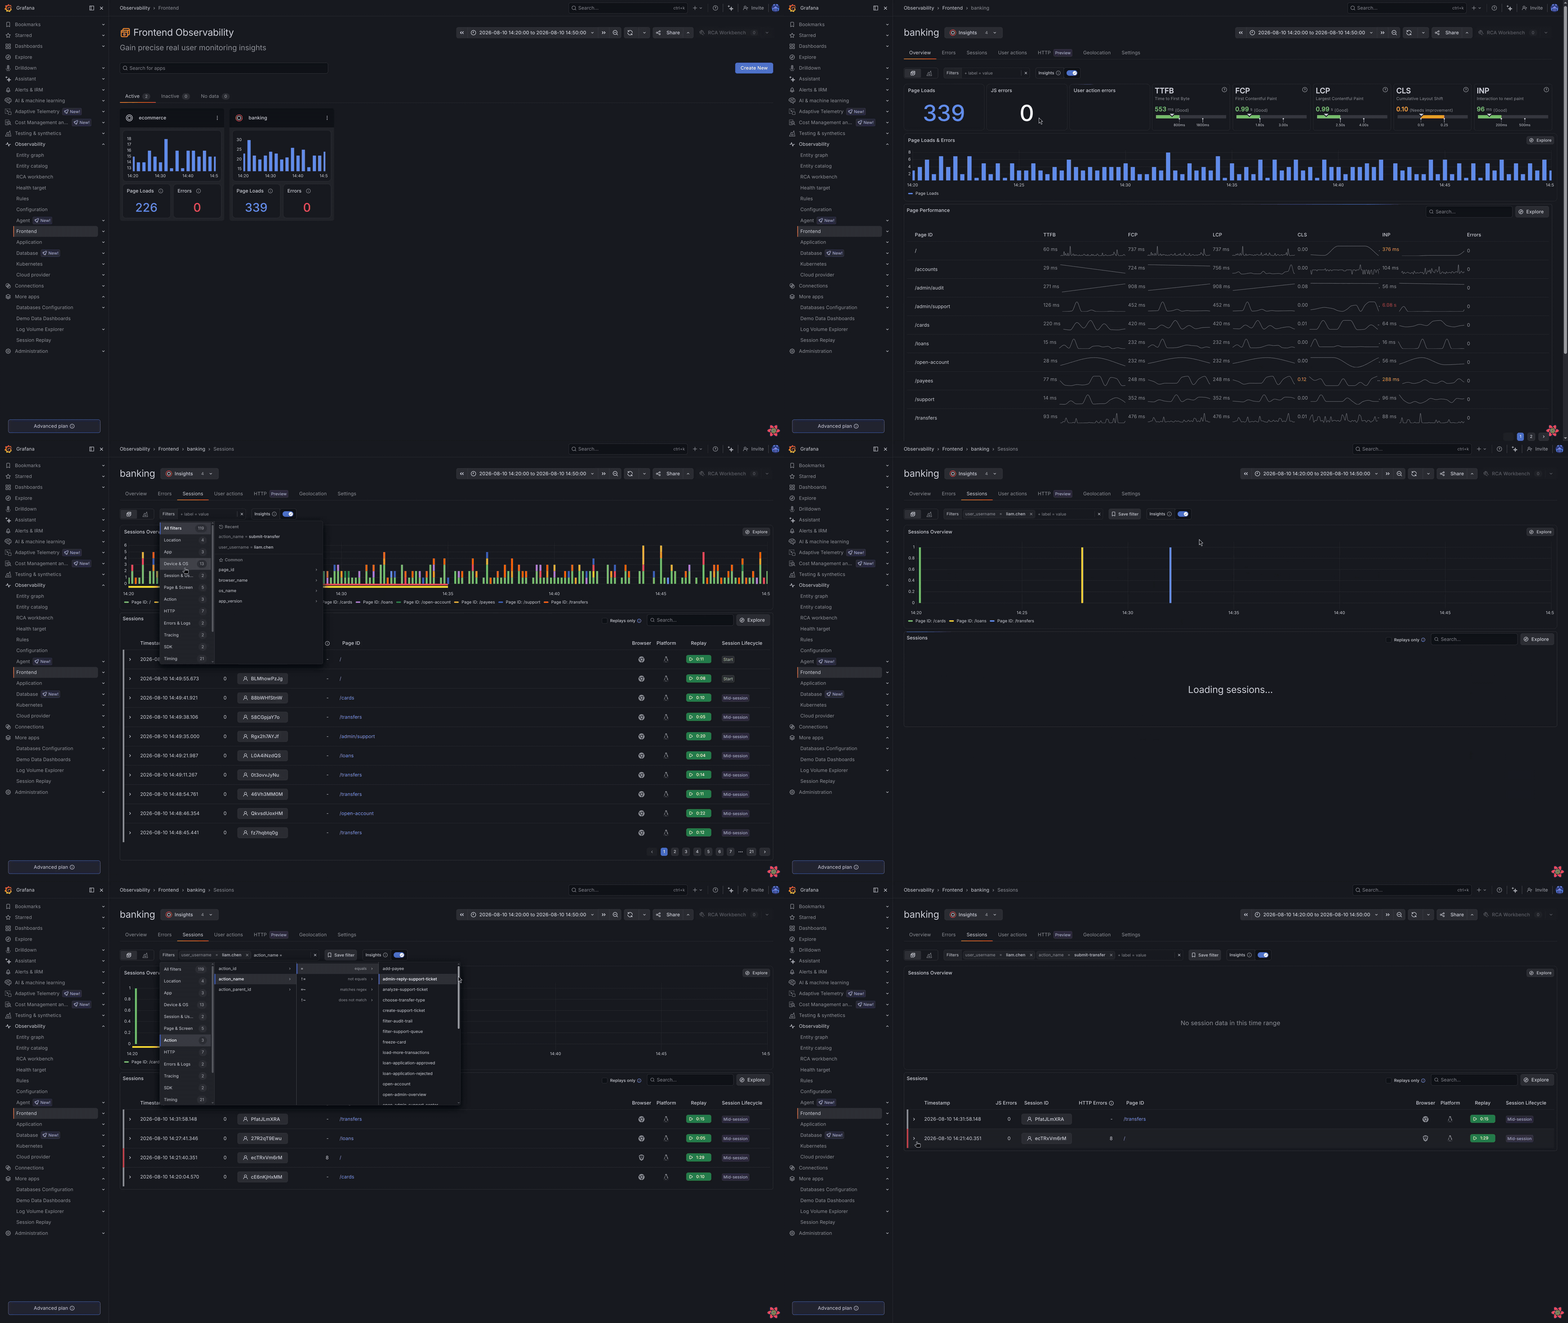
Instead of trying to reproduce the problem, let’s start with the person who experienced it. The Sessions tab in Frontend Observability lists all sessions for the application. Because Grafana Bank instruments its payment flow with Faro User Actions and attaches the username using Faro Metas, we can apply filters to narrow the search. This reduces the search space from every session in the application to the handful we actually care about.
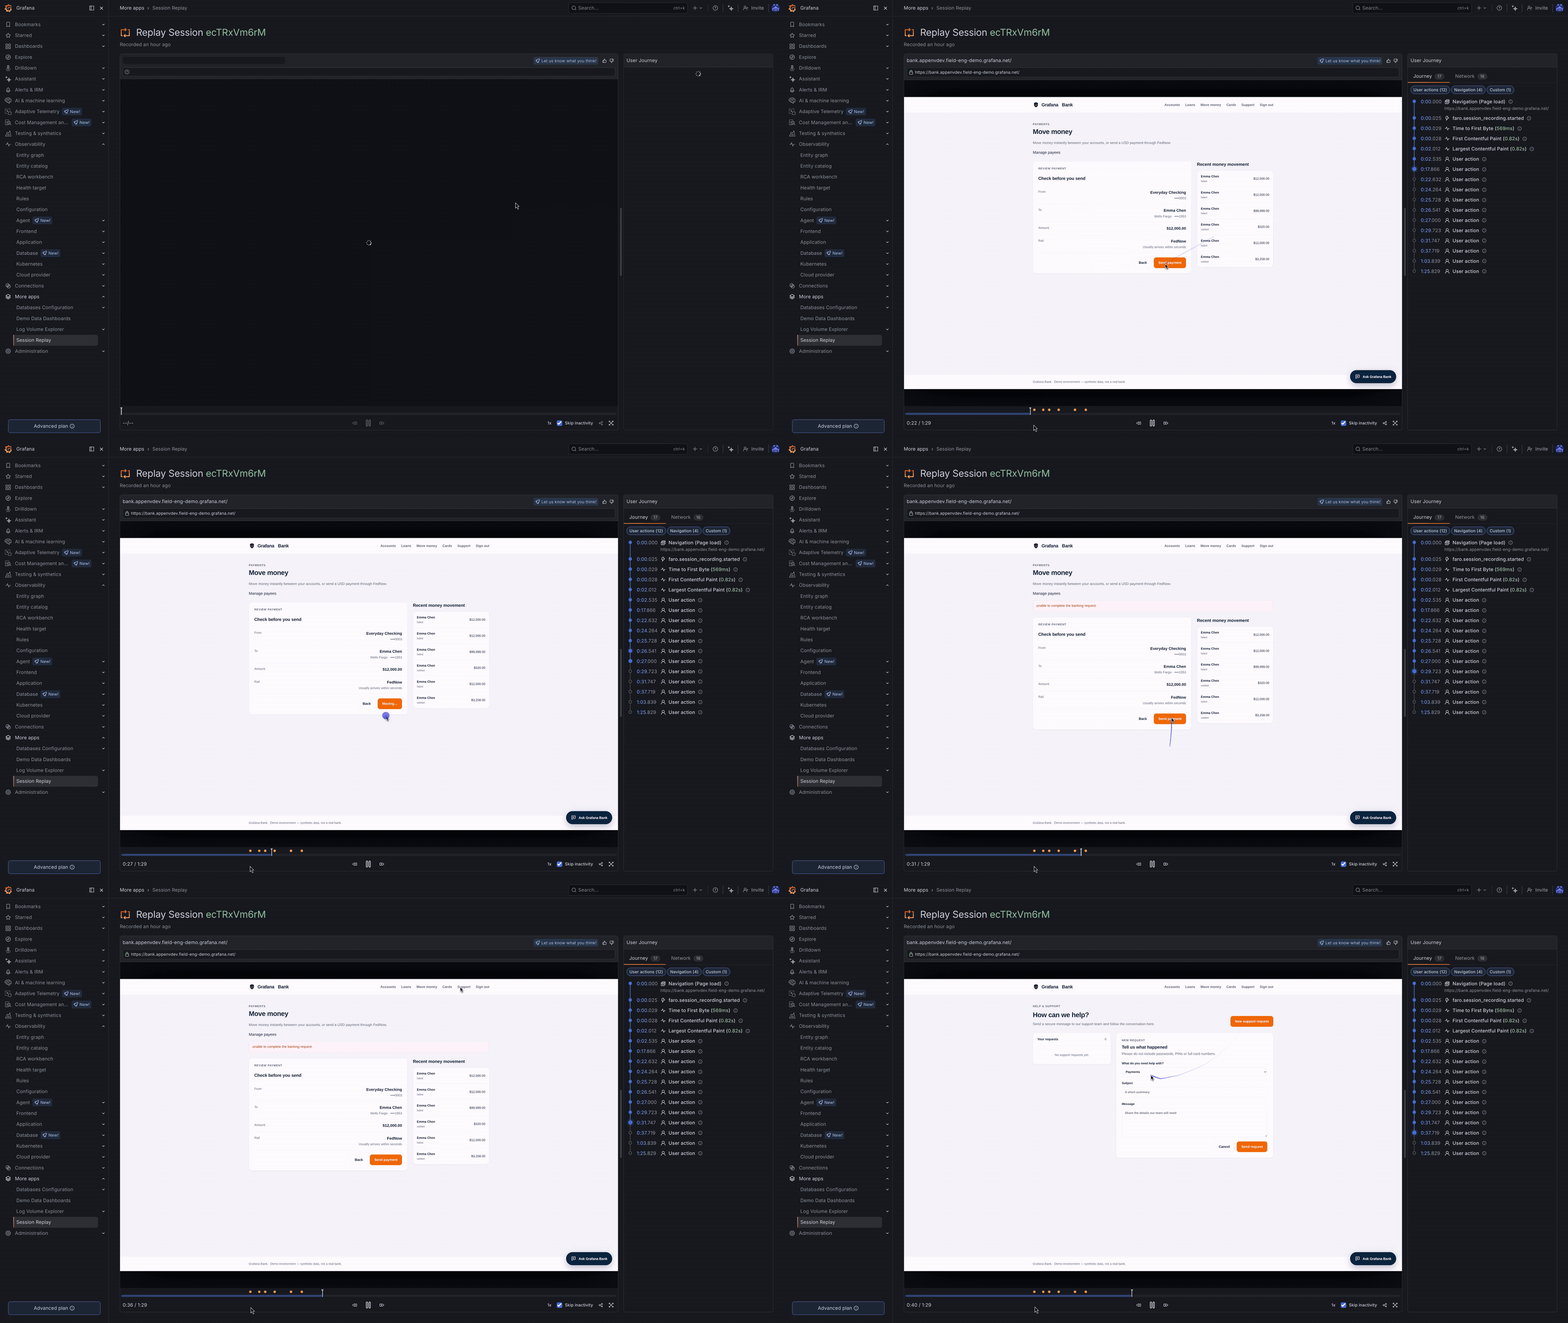
Let’s select the relevant session and replay it. As soon as the Player opens, it adds useful context to the timeline. Several orange warning markers stand out, so we can jump straight to the interesting part of the recording. We see the customer enter a $12,000 payment and click Send payment, only to get a small error banner with the generic message "unable to complete the banking request". They try the button a few more times, get the same error, and leave. The replay gives us a clear visual reconstruction of the failure.
Correlate replays with observability data
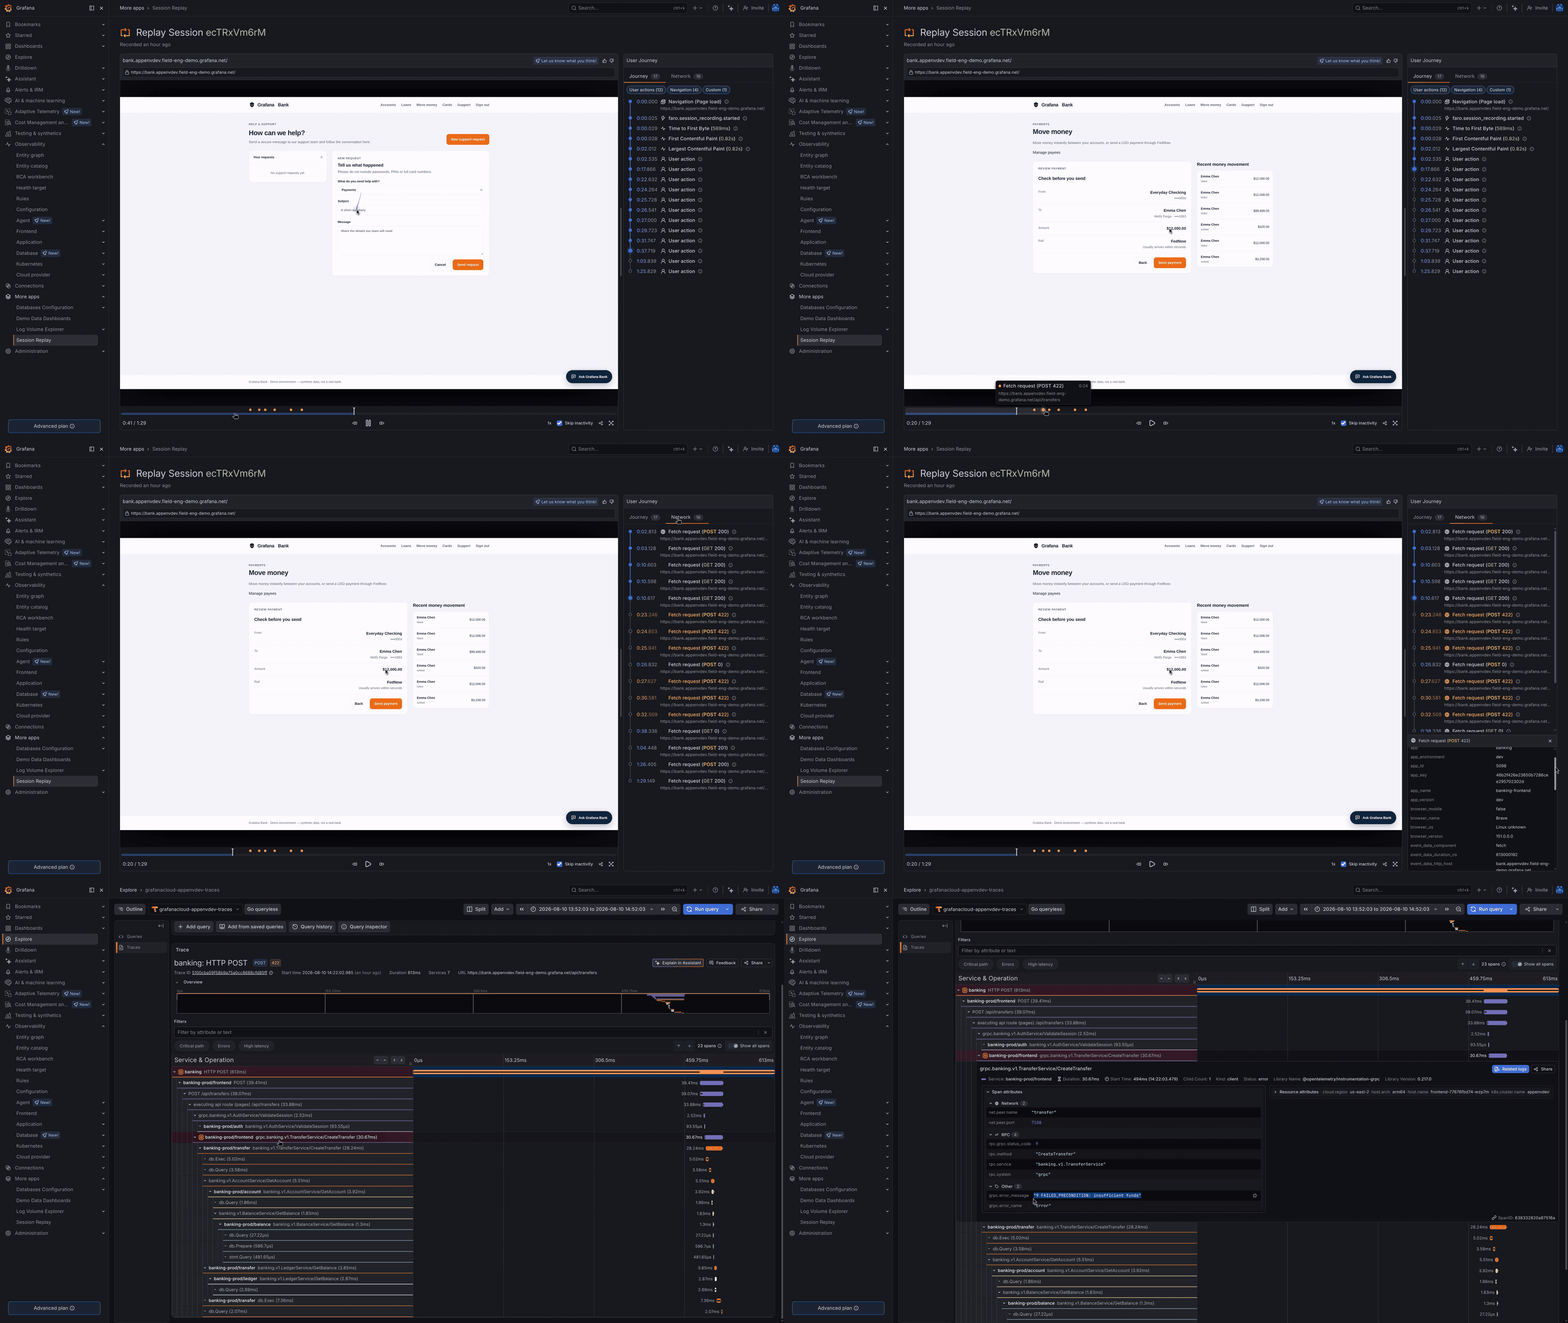
We can now see what happened, but we still don’t know why. This is where we correlate the replay with the rest of our observability data. Hovering over the orange markers shows that the warnings came from HTTP POST requests returning HTTP 422 status codes. In the User Journey panel on the right side of the Player, we can open the Network tab and expand the event details. Scrolling down reveals a trace ID that links directly to Grafana Cloud’s built-in Trace View, where we can pinpoint the root cause: the customer didn’t have enough funds to complete the transfer.
Understand user behavior in context
The replay also shows how the failure felt, something no counter or log line can capture. We watch the customer click the same button repeatedly, get an unhelpful error message, and eventually give up and submit a support request. That friction is a finding in its own right. The payment may have failed for a valid reason, but the error message didn’t explain it, leaving the customer confused. Session Replay ties this observation to a specific session, turning a hunch about the user experience into evidence that can guide the investigation and future UX work.
Get started with Session Replay
After months of using Session Replay internally at Grafana Labs and partnering with our private preview customers, Session Replay is now available in public preview.
Session Replay works with web applications instrumented with the Grafana Faro Web SDK (version 2.8.2 or later). If your application isn't instrumented yet, the Get started with Frontend Observability guides cover JavaScript, React, and Next.js applications step by step, and How to get started with frontend observability: A quick Grafana Faro example walks through the whole journey, from creating a Grafana Cloud stack to seeing your first real user monitoring data.
Once your application reports to Frontend Observability, enabling Session Replay takes two steps:
1. Add the replay instrumentation to your application:
npm install @grafana/faro-instrumentation-replayimport { getWebInstrumentations, initializeFaro } from '@grafana/faro-web-sdk';
import { ReplayInstrumentation } from '@grafana/faro-instrumentation-replay';
initializeFaro({
instrumentations: [
...getWebInstrumentations(),
new ReplayInstrumentation() // Add Session Replay instrumentation
],
});2. Deploy and press play. In Grafana Cloud, open Frontend Observability, select your application, and go to the Sessions tab. Sessions with a recording show a replay directly on the session detail page, next to the timeline of events from that session.
To learn more about Session Replay, including sampling controls and the privacy configuration described above, please refer to our documentation.
New to Grafana Cloud? Create a free account today to set up Frontend Observability and try Session Replay.
Help shape what comes next
Session Replay is part of our broader, long-term investment in expanding the Digital Experience Monitoring capabilities of Grafana Cloud. To learn more, please check out our technical docs and our DEM session at ObservabilityCON 2026.
We have plenty of ideas for where Session Replay and related features can go from here, and your feedback will help shape that direction. What we prioritize next will be informed by how teams like yours put replays to work in real-world investigations.
Share your experience with Session Replay in the #faro channel on the Grafana Community Slack or open an issue in the Faro Web SDK repository on GitHub. And when you're watching a replay, the feedback button in the player sends your thoughts straight to the team. What delighted you, what confused you, and what you wish it did: all of it helps us decide what comes next.
Grafana Assistant is the easiest way to get started with metrics, logs, traces, dashboards, and more in Grafana Cloud. We have a generous forever-free tier and plans for every use case. Sign up for free now!