


Trace linkage: connect the dots between your app traces and database queries


When an application request slows down, a trace can show a database call. Finding the database query behind it can be tedious, requiring you to switch between traces and database telemetry, as well as match timestamps or query text by hand.
In Grafana Cloud, the Database Observability app already provides a window into all of your database telemetry, including query samples, performance history, and explain plan. But what if you could jump from that database call in the trace straight to its query details?
OpenTelemetry database semantic conventions stabilized last year, giving us all a dependable shared language for describing database operations. That foundation has opened the door for what we call trace linkage, now Generally Available in Database Observability!
What is trace linkage?
With trace linkage, we try to provide a connection between OpenTelemetry-instrumented applications and database telemetry collected with Alloy. In other words, when you give us these previously-disjoint puzzle pieces, we’ll do our best to provide you as much supporting information between these two elements as we can. And we'll do it without making you tediously piece together timestamps and logs.
From a database span in a trace, you’ll see a link on the query text. Clicking from there, the app searches for a connection between your database query and our opinionated view of your most relevant data in the Database Observability app. You can explore sampled query execution data or check out the query’s historical performance, alongside that query’s related schema and explain plan.
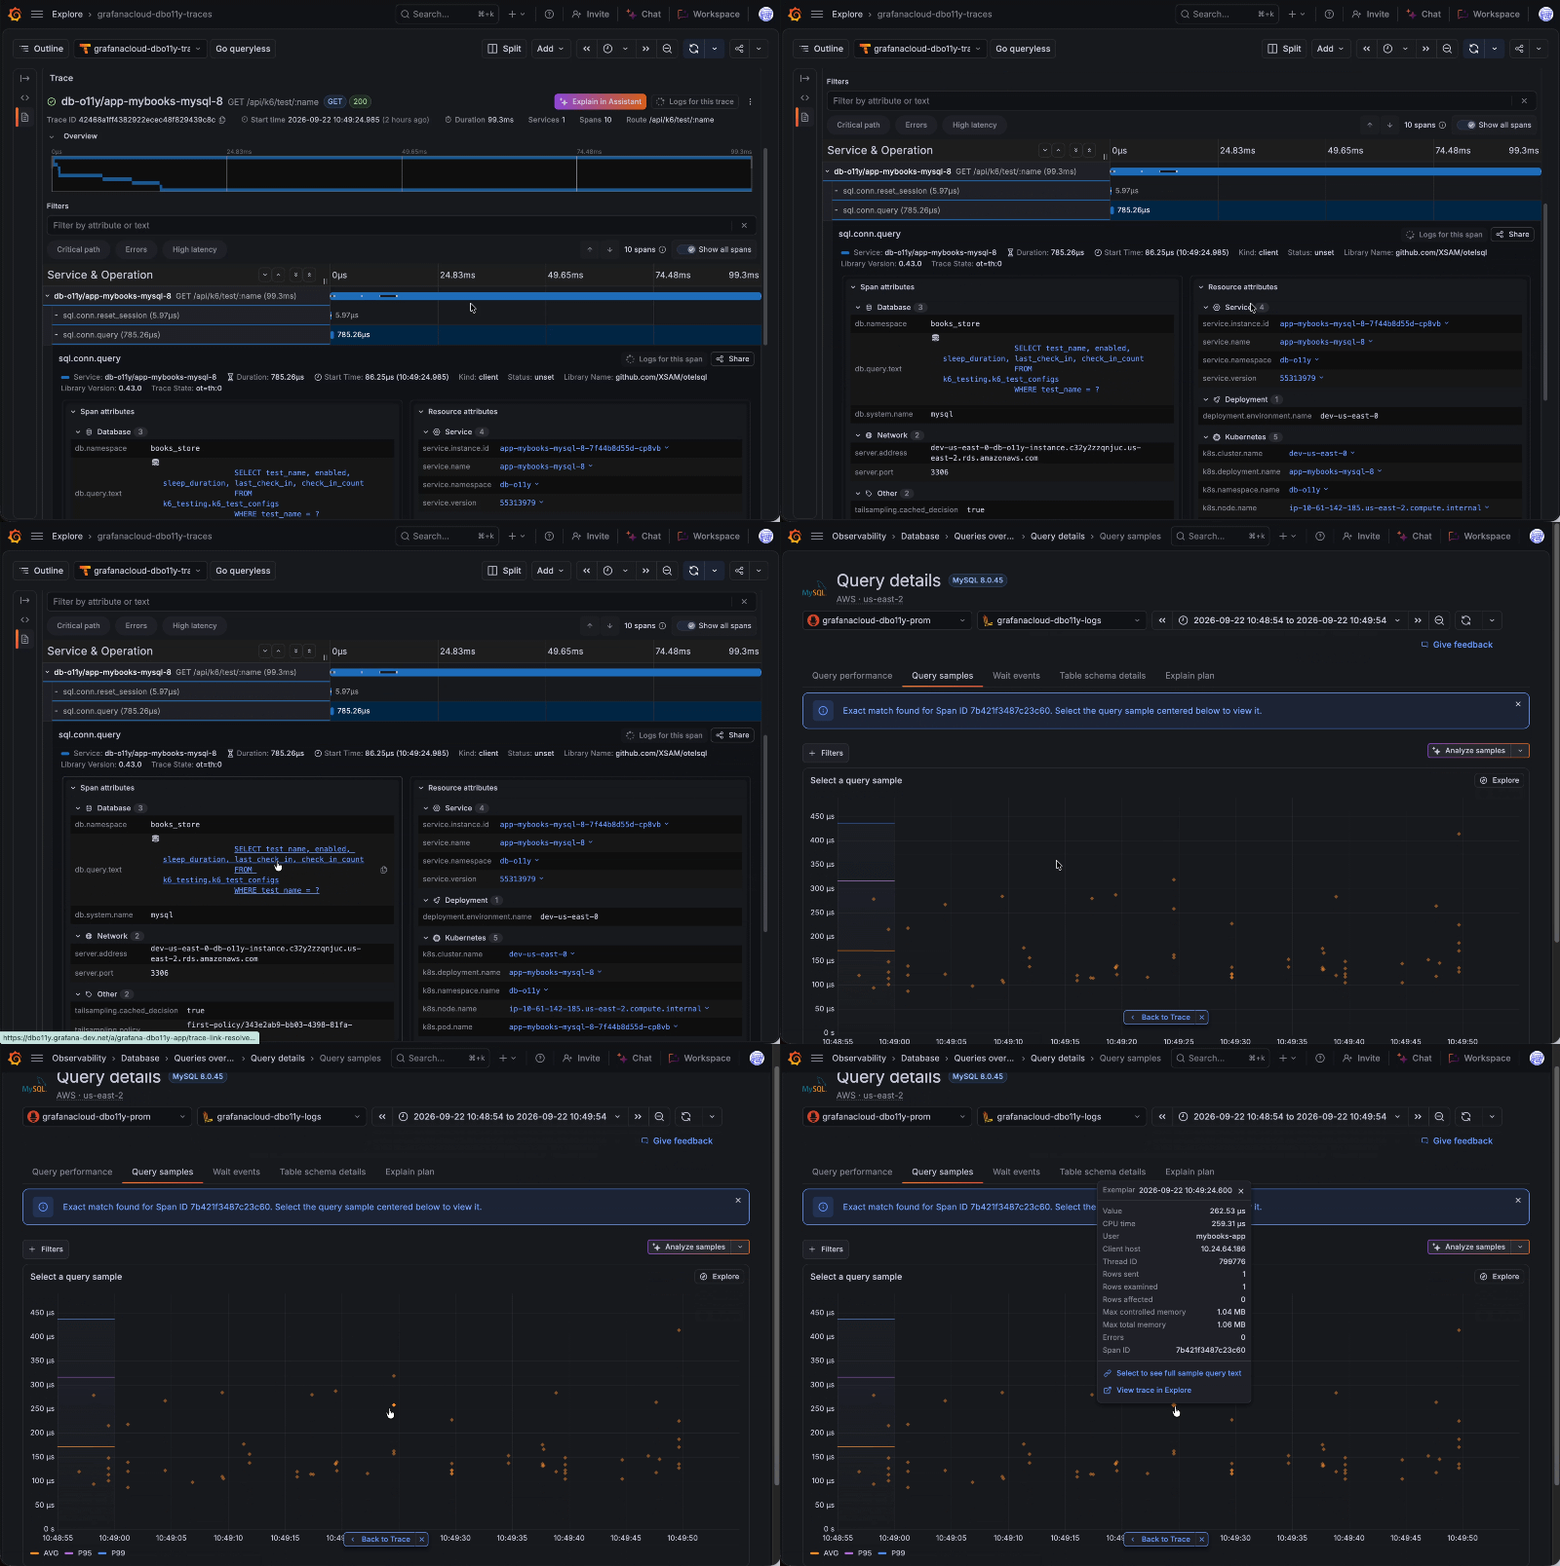
This connection builds on the database attributes your OpenTelemetry instrumentation already emits. Grafana Cloud Traces, powered by Tempo, retain those attributes, and trace linkage uses the query text, database system, and database name to connect a database span to its supporting query context in Database Observability.
We support the stable conventions like db.query.text and its legacy equivalent db.statement, so existing instrumentation can continue to benefit as teams adopt the stable conventions.
How does it work?
The initial idea for trace linkage came from this question: What shared context could connect application instrumentation with telemetry collected from the database?
The answer was to leverage trace context: the trace ID and span ID. On one side we have an application trace with spans representing a query execution. On the Database Observability side, we are collecting telemetry from the database concerning query executions. As long as the telemetry we collect contains the same trace ID and span ID, we can make a link between the application trace and Database Observability.
This led us to sqlcommenter, an open source project donated to the OpenTelemetry community. Its idea is (delightfully) simple: let the SQL statement carry a piece of trace context with it in a comment. With trace context propagation enabled, sqlcommenter injects the application’s trace ID and span ID into a comment at the end of the SQL statement. This is done at the level of an individual query execution, so this is like a shared thread that allows us to follow from a trace span to a specific query execution.

We then search the trace ID and span ID in the logs that we generated in the Database Observability Alloy component: our component extracts traceparent from the SQL comment and includes it in query sample logs.

Going beyond a traceparent match
However, having sqlcommenter enabled doesn’t guarantee that Alloy captured the particular SQL execution. That can depend on how short-lived a query may be or how often Alloy polls the database. Even if you are ready to use sqlcommenter, not every database engine is supported, and it can come with downsides for database caches. This means that you might have traces for which we can’t find a query sample in Database Observability, at least not with sqlcommenter exclusively.
We can go beyond sqlcommenter-based matching by using the query statement itself. When we can’t find an exact match, we look for matching query text in the telemetry collected by Alloy.
That sounds straightforward, but the same query can look different on each side. OpenTelemetry instrumentation doesn’t always record statements in the same way: depending on the language and instrumentation used, literal values may be preserved or masked, and parameter placeholders can take different forms. Meanwhile, database engines apply their own normalization to the query text that Alloy collects. We account for these differences, along with formatting and comments, to find a match.
Even when we can’t point you to the exact execution, you can still explore the samples and historical performance we’ve gathered for that query! This lets us make a meaningful link between your traces and Database Observability, even without sqlcommenter.

Start with query text matching, then use sqlcommenter to match trace and span IDs exactly
Trace linkage can be a great tool for quickly connecting your database and application telemetry, so we're excited for you to try it today. If your application is already instrumented as an OpenTelemetry SDK that sends traces to Grafana Cloud and you’ve already set up Database Observability, then read our docs about setting up trace linkage to help you get started.
If Database Observability has collected a query and the database span already includes its text in db.query.text or the legacy db.statement, chances are trace linkage can already match the span to that query without further application instrumentation.
Once you’ve tried query text matching, you can optionally go beyond and match a trace to a specific query execution with the use of sqlcommenter, as this blog discussed extensively. This improves match precision; exact matches remain best-effort because Alloy may not sample that execution.
And if you aren't sure where to start, ask Grafana Assistant for help, using natural language.
Miss out on ObservabilityCON 2026? Check out our blog post recapping all the big announcements!


