

Tempo 2.10 release: new TraceQL features, LLM-optimized API responses, vParquet5, and more
Tempo 2.10 has arrived, delivering TraceQL enhancements, improved cardinality management for the metrics-generator, vParquet5, and more.
You can continue reading and check out the video below to learn more about these and other new features. The Tempo 2.10 release notes and changelog provide more in-depth details and include all of the changes that came with this release.
New TraceQL features
We’re always working to improve and expand the reach of TraceQL, the query language for selecting traces in Tempo. Here’s what’s new in the 2.10 release.
Analyze trace structure with a new TraceQL intrinsic
The new TraceQL intrinsic, span:childCount, lets you filter and analyze spans based on the number of direct child spans they have.
For example, you could use it to find leaf spans (spans with no child operations), such as database calls or external API calls. You could also use it to find spans with an unexpected or unusually large number of child operations, known as fanout, which can indicate excessive calls.
To find leaf spans (no fanout), you can use:
{ span:childCount = 0}And to find spans with an unusually large number of child operations, you can use:
{ span:childCount > 1000 }This feature adds a new block column and is only supported in vParquet5 and above. See the PR, docs, and vParquet5 section of this blog for more information.
Identify traces with attributes that don’t exist
The new = nil operator, requested by the community, lets you query spans without specific attributes in your data. This helps you spot gaps or inconsistencies in your instrumentation, such as parts of an application where an attribute was never added or services that are only partially instrumented (for example, spans with http.method but no http.response.status_code).
It can also help you find an attribute you expect to not exist, such as an older version of a service where you have the deprecated http.status_code instead of http.response.status_code.
While TraceQL has long supported != nil to confirm an attribute is present, this release adds = nil so you can specifically identify spans where an attribute doesn’t exist. For example:
{ span.foo = nil }will return all spans without the span-level "foo" attribute{ resource.bar = nil }will return all spans without the resource-level "bar" attribute
Let’s say we have three traces with the following span-level attributes, but you’re looking for a span where the attribute "foo" doesn’t exist:
span 1 {
  foo: "bar",
  abc: "xyz"
}

span 2 {
  foo: "boo",
  abc: "xyz"
}
span 3 {
  abc: "xyz"
}
Prior to = nil we had no way of getting to span 3 using the attribute span.foo:
{ span.foo != "bar" }returns span 2{ span.foo != "boo" }returns span 1{ span.foo != "bar" && span.foo != "boo"}returns nothing
Now we can use { span.foo != bar || span.foo = nil } to return span 3.
Previously, you also couldn’t get just spans 2 and 3, but you now could use{span.foo != bar || span.foo = nil }.
To learn more about this new feature, check out the November 2025 Tempo community call, slides, docs, and this PR.
Improved MCP server responses for tracing data
In the last minor release, we shared that Tempo now includes an MCP server that has direct access to your distributed tracing data through TraceQL queries and other endpoints. This lets you leverage LLMs and AI agents, such as Claude Code, to more easily understand interactions between your services and diagnose issues faster.
With Tempo 2.10, we created a new, simplified JSON representation of a trace that makes it easier for LLMs to process and analyze your tracing data.
The new JSON format is a lot cleaner, less verbose, and easier for LLMs to interpret. This allows you to get more accurate and useful responses from AI assistants about your tracing data when using the Tempo MCP server, and also results in far fewer tokens being used.
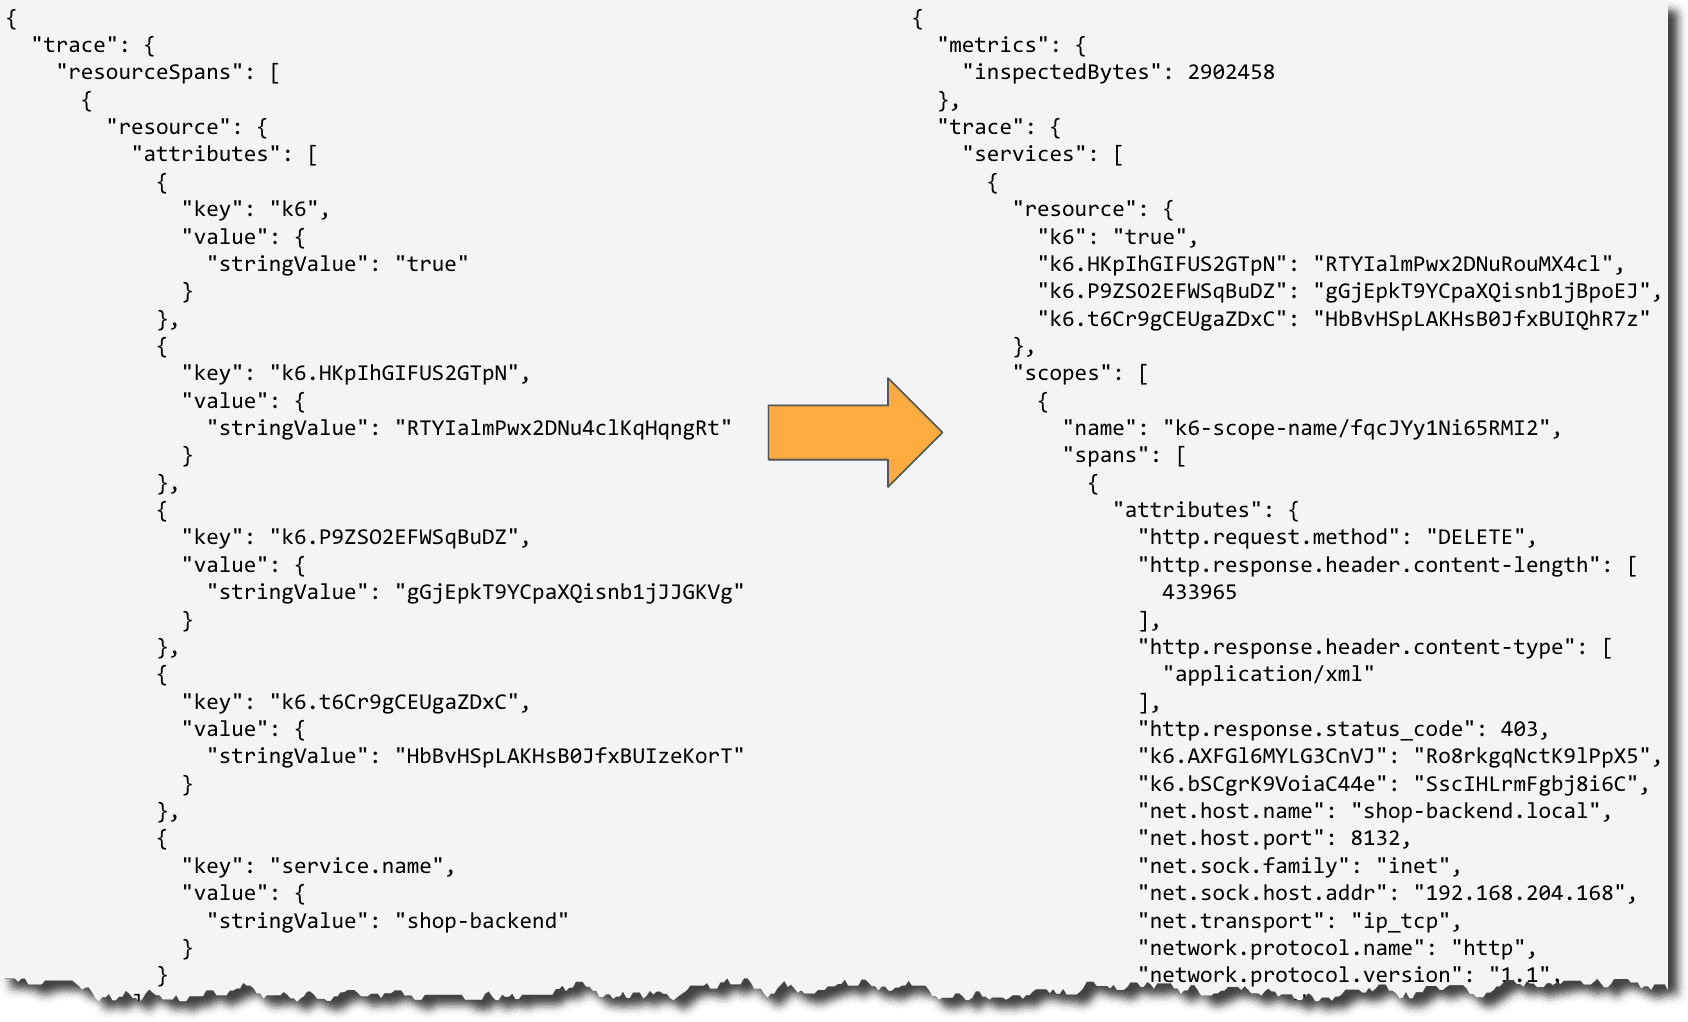
Comparison of default JSON and new JSON
It uses the new header Accept: application/vnd.grafana.ll, which is now the default for the Tempo MCP server. If you want to see what the JSON output looks like and are running Tempo locally, you can run the following curl command:
curl -H 'Accept: application/vnd.grafana.llm' \
  'http://localhost:3200/api/v2/traces/<traceid>'
If you would like to see the original JSON, you can just remove the header and then compare.
Note: This new response format is experimental and may change.
To learn more, see the PR,the December Tempo community call, and the Tempo API docs.
Enhancements to the metrics-generator
Metrics-generator is an optional Tempo component that derives metrics from ingested spans. It internally runs a set of processors, each of which ingests spans and produces metrics. Metrics generated by the metrics-generator can provide both RED (Rate/Error/Duration) metrics and service graphs, which display the relationships between services. These capabilities rely on a set of generated span metrics and service metrics.
The following features in Tempo 2.10 add functionality for sizing and tuning your span metrics and service graphs, and still extracting as much value as possible when you’re limited on cardinality and setting the max active series.
Estimating active series demand
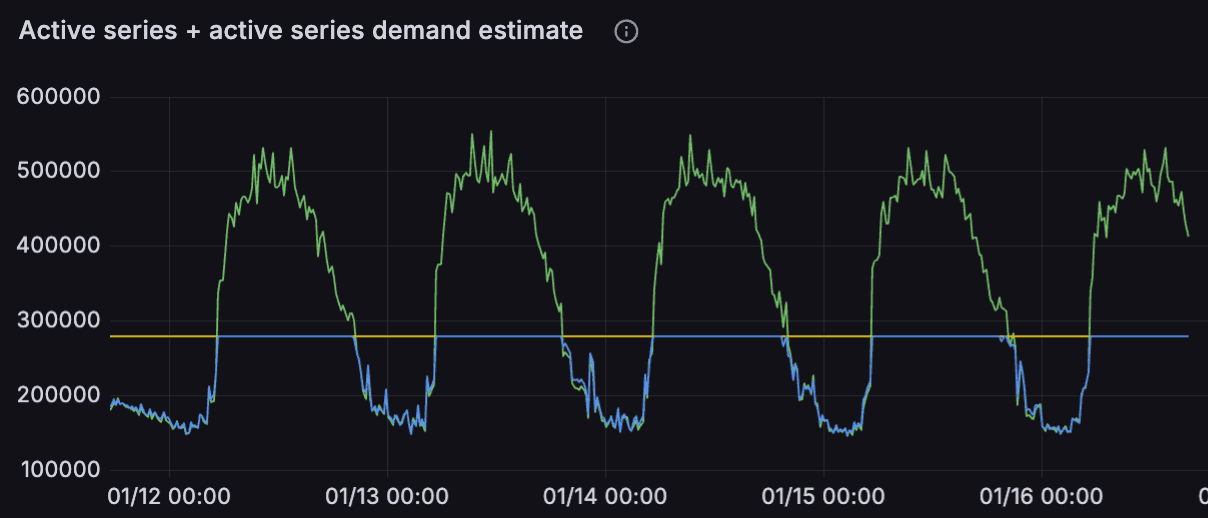
As more metric series are generated, they take up more storage space, which can get expensive. You can set a cap for how many metrics series are generated using tempo_metrics_generator_registry_max_active_series, which will refuse any new series above the cap. By default, it is set to zero, which means there is no limit. However, if you set the max active series to 300,000, for example, you wouldn’t know how many series were being dropped, or the total demand for active series.
To address this, we added tempo_metrics_generator_registry_active_series_demand_estimate, a new metric for estimating the active series demand.
This is especially useful when the active series reaches the max limit. This metric uses HyperLogLog, an algorithm for estimating cardinality using very low memory per tenant, without having to store rejected series in memory. By cardinality, we mean the number of unique elements in a set, or in this case, the number of unique metric series. For operators, this metric is particularly useful because it can show how many series the tenant is attempting to create and can’t.
The graph below helps demonstrate this:
- The yellow horizontal line at 300,000 active series is the
tempo_metrics_generator_registry_max_active_series - The blue line capped at the max is the
tempo_metrics_generator_registry_active_series - The green line, both below and above the max, is the
tempo_metrics_generator_registry_active_series_demand_estimate
Check out the October Tempo community call, the PR, and the docs to learn more about this feature and HyperLogLog. And if you really want to dig into HyperLogLog, you can read the Google Whitepaper on it.
Entity-based limiting mode
With series-based limiting, all series after hitting the max active series threshold are dropped. This could result in partial series, such as having span metrics but no service graph (and not knowing why), or partial histograms.
With Tempo 2.10, we added an entity-based limiting mode to prevent this by limiting the number of entities instead of the number of series. In this case, an entity is a single labelset across multiple metrics, excluding external labels. So it limits the number of unique label combinations.
To change the limiting mode, set limiter_type to entity in the metrics-generator configuration block in your Tempo config file. See the metrics-generator configuration docs for a full example.
metrics_generator:
  limiter_type: entity
Then, to set the limit, add max_active_entities and your chosen limit to the overrides block. See the overrides configuration docs for a full configuration file.
overrides:
  defaults:
    metrics_generator:
      max_active_entities: <int>
You can then look at metrics for tempo_metrics_generator_registry_active_entities, the maximum number of entities allowed to be active in the metrics generator registry, and tempo_metrics_generator_registry_entities_limited_total for the total number of entities not created because of limits per tenant.
To learn more, please check out the PR.
metric_overflow label to capture new data once limits are hit
Instead of just dropping series after hitting the max active series threshold, these new series are captured and collapsed into a single “overflow” series, and each metric is given the label metric_overflow=”true”. The data under the more granular labels will automatically age out over time. As stale series are pruned, new ones will be split out from the overflow series until the limit is reached again, and the cycle repeats.
You can find more information in the PR.
vParquet upgrade
Tempo uses the Apache Parquet columnar block format to store traces, and TraceQL queries operate on traces stored in those Parquet blocks.
This release continues with vParquet4 as the default, with vParquet5 as optional. As vParquet5 will be the default with Tempo 3.0, we recommend you update to it. You can find more information in our docs about how to change versions.
In Tempo 2.9, vParquet2 was deprecated, and the files were fully removed in this release. Additionally, in 2.10, vParquet3 and v2 are now deprecated and will be fully removed in 3.0.
vParquet5 brings new features to Tempo
In Tempo 2.9, we started adding features for vParquet5. These added new columns, which speed up TraceQL queries, and also added low-resolution timestamp columns for improved TraceQL metrics performance. See the 2.9 release blog, release notes, and the August community call for more details.
In 2.10, we made further improvements to speed up TraceQL queries, reduce storage usage, and lower memory pressure.
Dedicated attribute columns were added to the configuration to replace the previous fixed columns for well-known attributes, such as the Kubernetes cluster name. This makes the attribute columns more flexible and allows them to be changed via configuration.
parquet_dedicated_columns:
    - scope: resource
      name: k8s.cluster.name
      type: string
You can read more in the Manifest docs, Dedicated attribute columns docs, and the PR.
These dedicated attribute columns got support added for storing arrays of integers and strings on resource, span, and event levels. These can be provided either via the Tempo config or overrides using a new options field.
parquet_dedicated_columns:
 - name: http.request.header.accept
   type: string
   scope: span
   options: ["array"]
See the docs and PR for more examples.
We added dedicated attributes at the event level and detection and support of “blob” attributes, which are attributes with high cardinality and/or high length, such as UUIDs or stack traces, where the dictionary encoding was a hindrance. Now, when using the Tempo CLI, the command tempo-cli analyse block can detect these and mark the dedicated column mapping accordingly.
Additionally, any unused dedicated columns are automatically dropped from the output files to save space and overhead. You can find more details in the PR and docs.
Until Tempo 3.0, if you want to use vParquet5 instead of the default vParquet4, you need to add vParquet5 as the block version under storage in your Tempo configuration YAML.
storage:
 trace:
   block:
     version: vParquet5
You can watch the January community call to learn more about the vParquet5 updates. See the changelog and release notes for all vParquet5 PRs.
How to learn more — and what’s next for Tempo
To see the full list of improvements, bug fixes, and changes (some breaking) for TraceQL, metrics-generator, vParquet, and more in Tempo 2.10, please refer to the changelog and release notes.
We are also working on a new Tempo architecture, codenamed Project Rhythm, which is currently experimental. The project aims to remove the replication factor 3 (RF3) requirement, decouple read and write paths for better scalability and reliability, and lay the groundwork for lower total cost of ownership and future growth. See the release notes for more details.
If you are interested in hearing more about Grafana Tempo news, please join us on the Grafana Labs Community Slack channel #tempo, post a question in our community forums, reach out on X (formerly Twitter), or join our monthly Tempo community call. See you there!
And if you want to get even closer to where the magic happens, why not have a look at our open positions at Grafana Labs?
The easiest way to get started with Tempo is with Grafana Cloud, and our free forever tier now includes 50GB of traces, along with 50GB of logs and 10K series of metrics. Sign up today for free!

