

Observing agentic AI workflows with Grafana Cloud, OpenTelemetry, and the OpenAI Agents SDK
As agentic AI applications are used more broadly in production, they introduce new operational models, combining multi-step reasoning, tool execution, and autonomous decision-making into a single workflow. SRE teams need visibility into how these agents behave, where they fail, and how they perform over time.
This is why the OpenAI Agents SDK, a lightweight framework for building agentic applications, includes built-in tracing capabilities to help you capture agent activity, including LLM generations, tool calls, guardrails, and handoffs.
In this post, we’ll walk through how to generate traces from the OpenAI Agents SDK and export them to Grafana Cloud Traces, the fully managed distributed tracing system powered by Tempo, using OpenTelemetry. With Grafana Cloud, you can visualize and analyze these traces to gain deeper insights into agent workflows, and also correlate traces with metrics and logs for faster root cause analysis.
Setting up our sample application
To start, let’s set up the “tutor” sample application, as outlined in OpenAI’s Quickstart guide. The code is fairly straightforward: it creates a three-agent workflow, using handoffs and the input guardrail, and is a great example of a centralized design pattern for agents. (Note: if you’d like more info on core concepts of the OpenAI Agents SDK, including guardrails and handoffs, please check out OpenAI docs).
In the tutor example, when a user asks a homework question, the triage agent determines which agent to use based on the specific question — for example, the math tutor is used for math questions and the history tutor for history questions. The guardrail is used to make sure questions are actually homework questions.
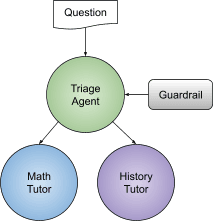
Homework tutor application architecture
By default, tracing is enabled and sent to OpenAI’s backend, and traces can be viewed from the built-in traces dashboard. The dashboard allows developers to visualize, debug, and monitor agent workflows by providing a structured way to see every decision the agents make. This is helpful when troubleshooting agentic applications and to analyze their performance.
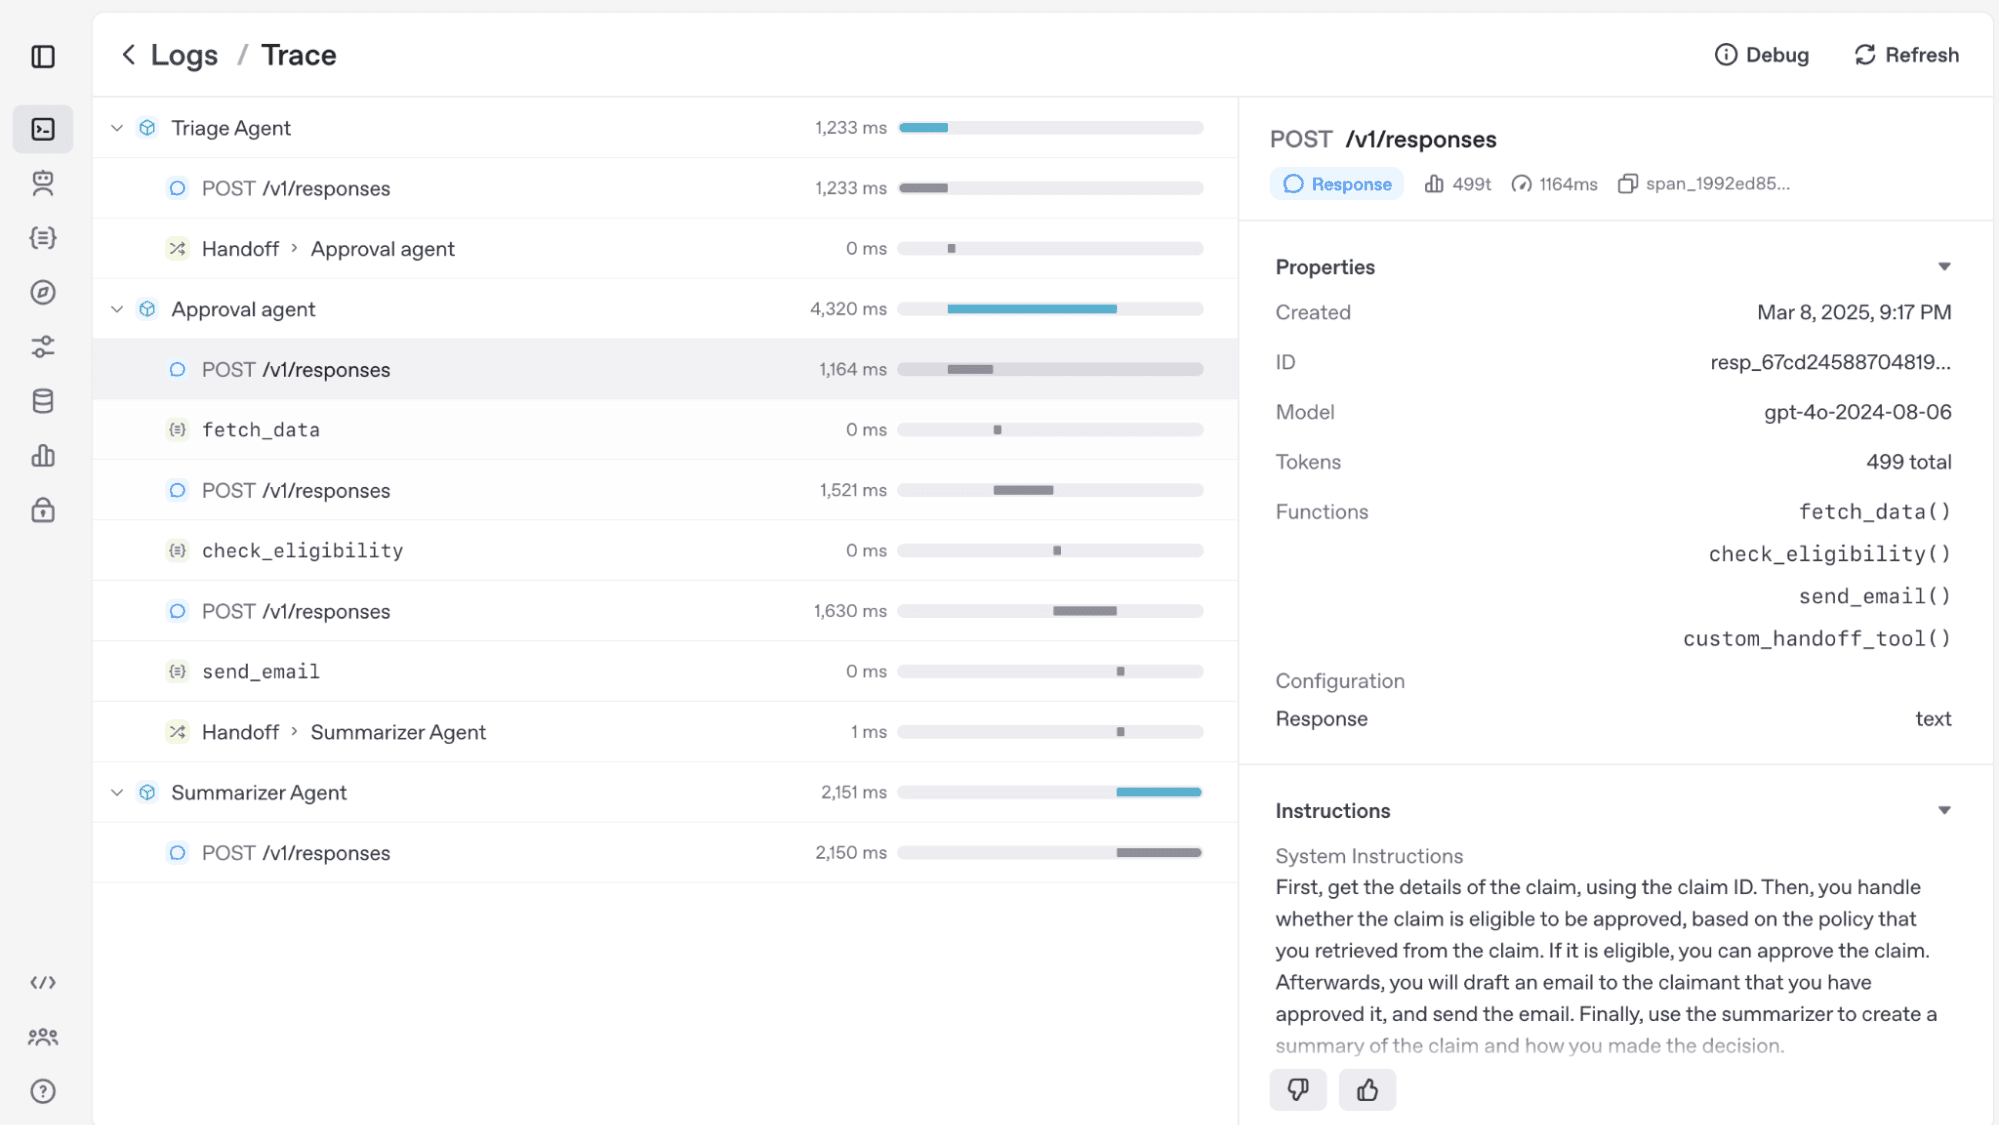
OpenAI Agents SDK tracing dashboard example
However, we are going to send our traces to Grafana Cloud, using OpenTelemetry, with only a few lines of code. This will provide us with a single, centralized view of all telemetry, including traces, logs, and metrics from both agent workflows and the underlying infrastructure.
All we need is a custom OpenTelemetry tracing processor and some configurations for it, which we will cover next.
Creating a custom OpenTelemetry tracing processor
The OpenAI Agents SDK is extensible, allowing you to:
- Add an additional trace processor to send traces to your custom backend, while still sending them to the default OpenAI backend.
- Replace the default processors entirely to send traces only to your custom backend.
In our case, all we need is an OpenTelemetry processor. We can create a custom processor by implementing the TracingProcessor abstract base class and then register it with the global trace provider. The skeleton code looks like this:
class CustomProcessor(TracingProcessor):
    def on_trace_start(self, trace):
        # OTEL logic

    def on_trace_end(self, trace):
        # OTEL logic to export the trace data

    def on_span_start(self, span):
        # OTEL logic

    def on_span_end(self, span):
        # OTEL logic to export the span data

    def shutdown(self):
        # OTEL logic

    def force_flush(self):
        # OTEL logic
Luckily, there are already open source implementations in the community. There is the OpenTelemetry OpenAI Agents Instrumentation from OpenTelemetry, which follows the Semantic conventions for generative client AI spans. There is also the openinference implementation, which we will be using in this example. You can check out the detailed code here.
Using the processor is very simple, and similar to the OpenTelemetry implementation:
1. Install the package:
pip install openinference-instrumentation-openai-agents
2. Register the processor:
OpenAIAgentsInstrumentor().instrument(tracer_provider=tracer_provider)
Below is the complete modified code, based on the original example in the Quickstart guide. The only code added is the three lines of code to instantiate an OpenTelemetry trace exporter and register it with OpenAI Agents SDK:
tracer_provider = TracerProvider()
tracer_provider.add_span_processor(BatchSpanProcessor(OTLPSpanExporter()))
OpenAIAgentsInstrumentor().instrument(tracer_provider=tracer_provider)
We also created a custom trace with the name openai-tutor-workflow by leveraging the trace function. Otherwise, all the traces would be named the default “Agent workflow” name. This also allows us to group both agent runs under one trace.
from agents import Agent, InputGuardrail, GuardrailFunctionOutput, Runner, trace
from agents.exceptions import InputGuardrailTripwireTriggered
from pydantic import BaseModel
import asyncio

from openinference.instrumentation.openai_agents import OpenAIAgentsInstrumentor
from opentelemetry.exporter.otlp.proto.http.trace_exporter import OTLPSpanExporter
from opentelemetry.sdk.trace import TracerProvider
from opentelemetry.sdk.trace.export import BatchSpanProcessor

tracer_provider = TracerProvider()
tracer_provider.add_span_processor(BatchSpanProcessor(OTLPSpanExporter()))
OpenAIAgentsInstrumentor().instrument(tracer_provider=tracer_provider)

class HomeworkOutput(BaseModel):
   is_homework: bool
   reasoning: str

guardrail_agent = Agent(
   name="Guardrail check",
   instructions="Check if the user is asking about homework.",
   output_type=HomeworkOutput,
)

math_tutor_agent = Agent(
   name="Math Tutor",
   handoff_description="Specialist agent for math questions",
   instructions="You provide help with math problems. Explain your reasoning at each step and include examples",
)

history_tutor_agent = Agent(
   name="History Tutor",
   handoff_description="Specialist agent for historical questions",
   instructions="You provide assistance with historical queries. Explain important events and context clearly.",
)

async def homework_guardrail(ctx, agent, input_data):
   result = await Runner.run(guardrail_agent, input_data, context=ctx.context)
   final_output = result.final_output_as(HomeworkOutput)
   return GuardrailFunctionOutput(
       output_info=final_output,
       tripwire_triggered=not final_output.is_homework,
   )

triage_agent = Agent(
   name="Triage Agent",
   instructions="You determine which agent to use based on the user's homework question",
   handoffs=[history_tutor_agent, math_tutor_agent],
   input_guardrails=[
       InputGuardrail(guardrail_function=homework_guardrail),
   ],
)

async def main():
   with trace("openai-tutor-workflow"):
       # Example 1: History question
       try:
           result = await Runner.run(triage_agent, "who was the first president of the united states?")
           print(result.final_output)
       except InputGuardrailTripwireTriggered as e:
           print("Guardrail blocked this input:", e)

       # Example 2: General/philosophical question
       try:
           result = await Runner.run(triage_agent, "What is the meaning of life?")
           print(result.final_output)
       except InputGuardrailTripwireTriggered as e:
           print("Guardrail blocked this input:", e)

if __name__ == "__main__":
   asyncio.run(main())
Sending traces to Grafana Cloud
To send these traces to Grafana Cloud via OpenTelemetry, we will have to perform some related configurations. Typically, you would first send the traces to a collector, such as the OpenTelemetry Collector or Alloy, and then the collector would forward the traces to Grafana Cloud. To keep things brief for our example, we will send the traces directly to Grafana Cloud without a collector.
1. Log into your Grafana Cloud account and select your stack. In my case, it’s called qu. (Don’t have a Grafana Cloud account? Sign up for the free forever plan today).
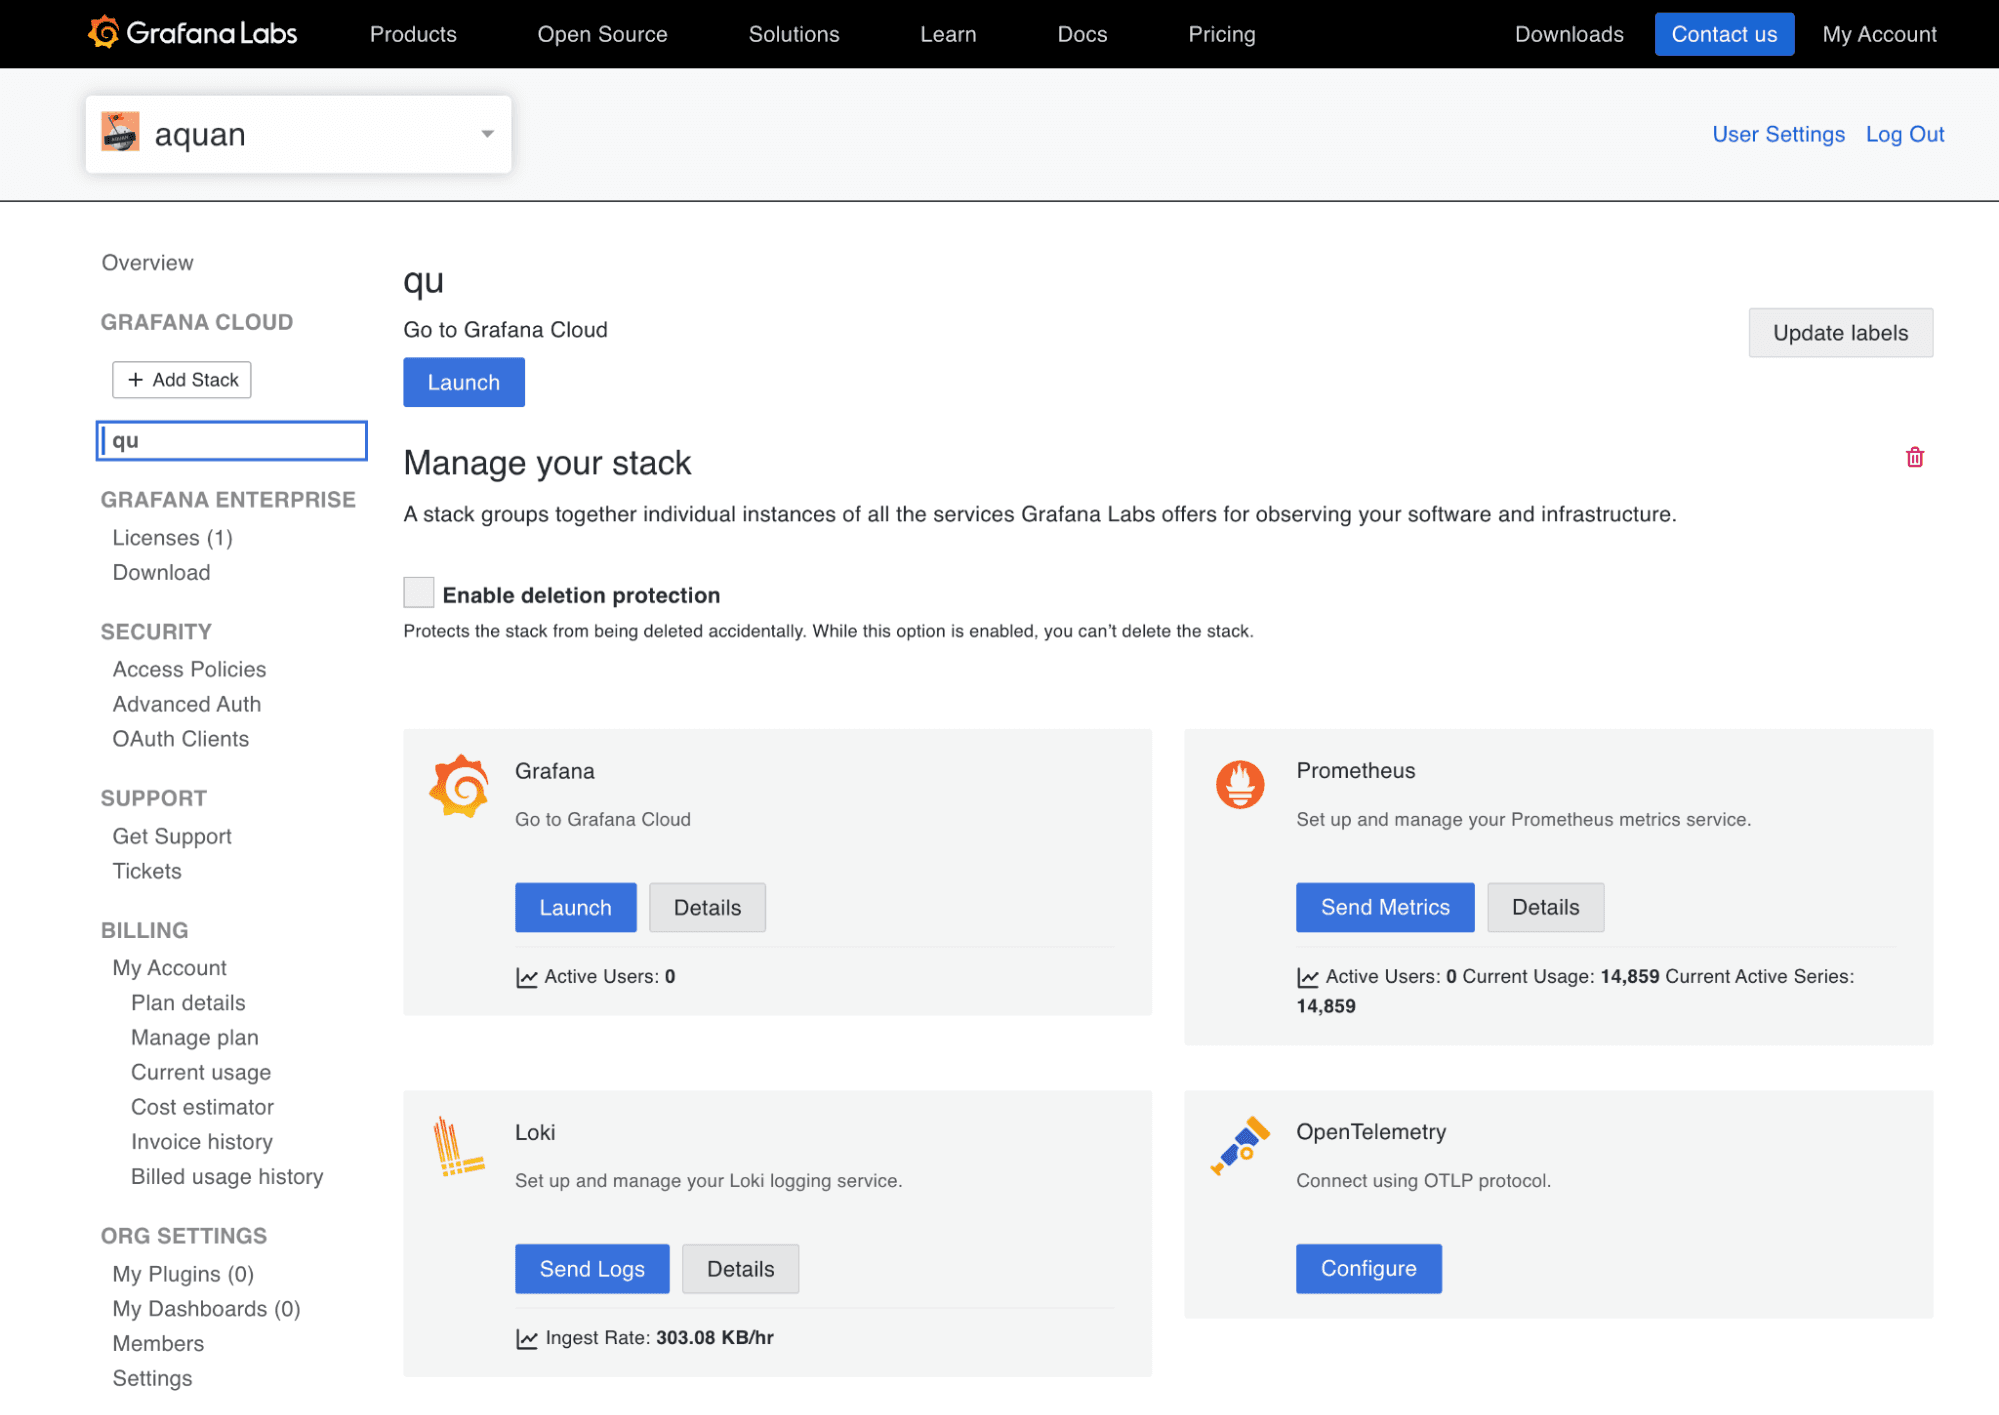
2. Click Configure in the OpenTelemetry card. You can see the OTLP endpoint for your instance here. You will need to generate an API token for authentication.
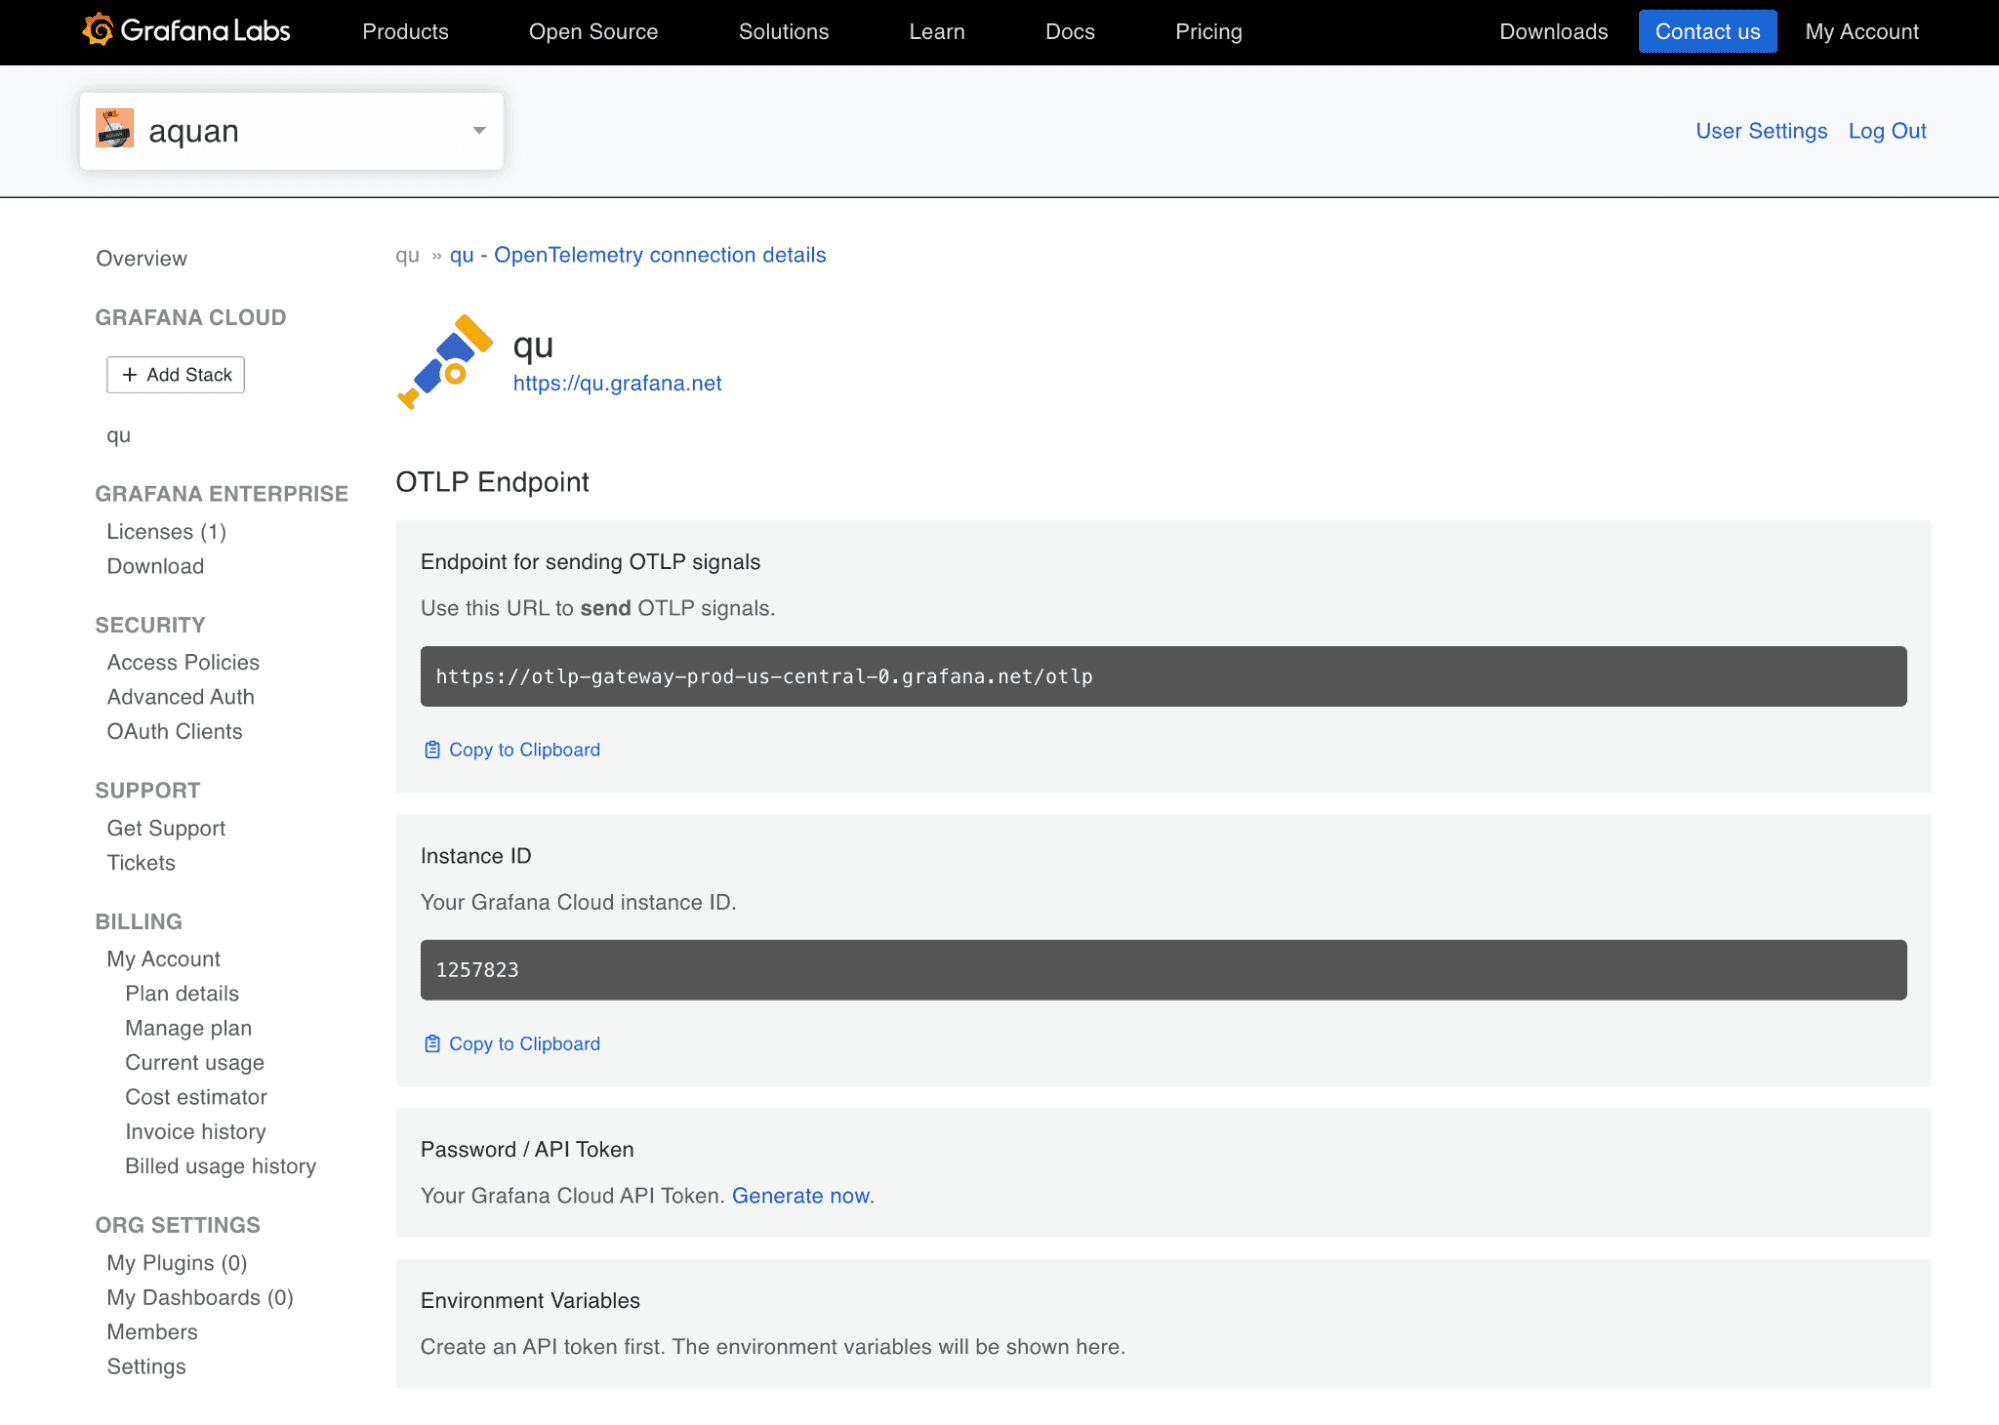
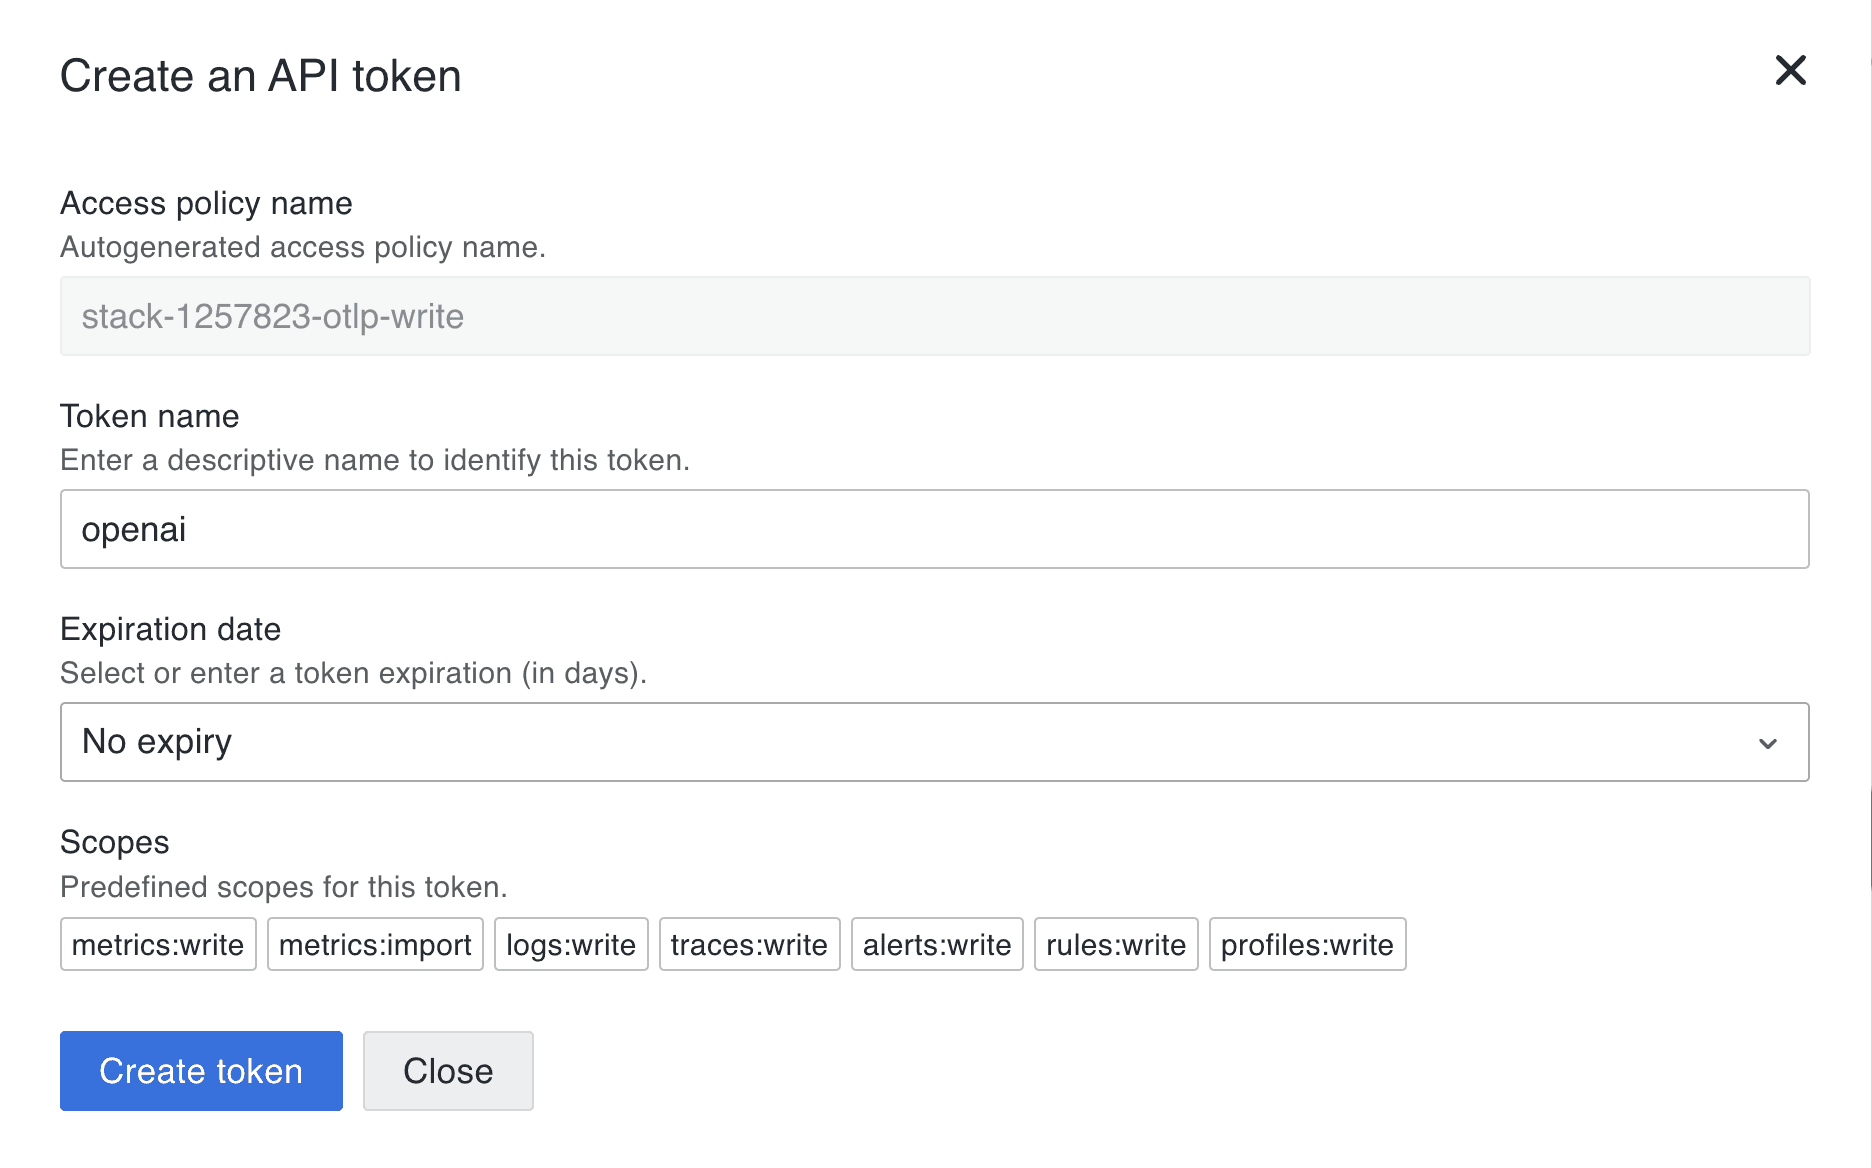
3. Click Generate now to generate an API token. You can name it something like openai. Click Create token to generate the token and close the dialog.
4. You will see a set of environment variables you can set in the terminal where you will run your agents. Again, you would normally configure these for either the OTel Collector or Alloy.
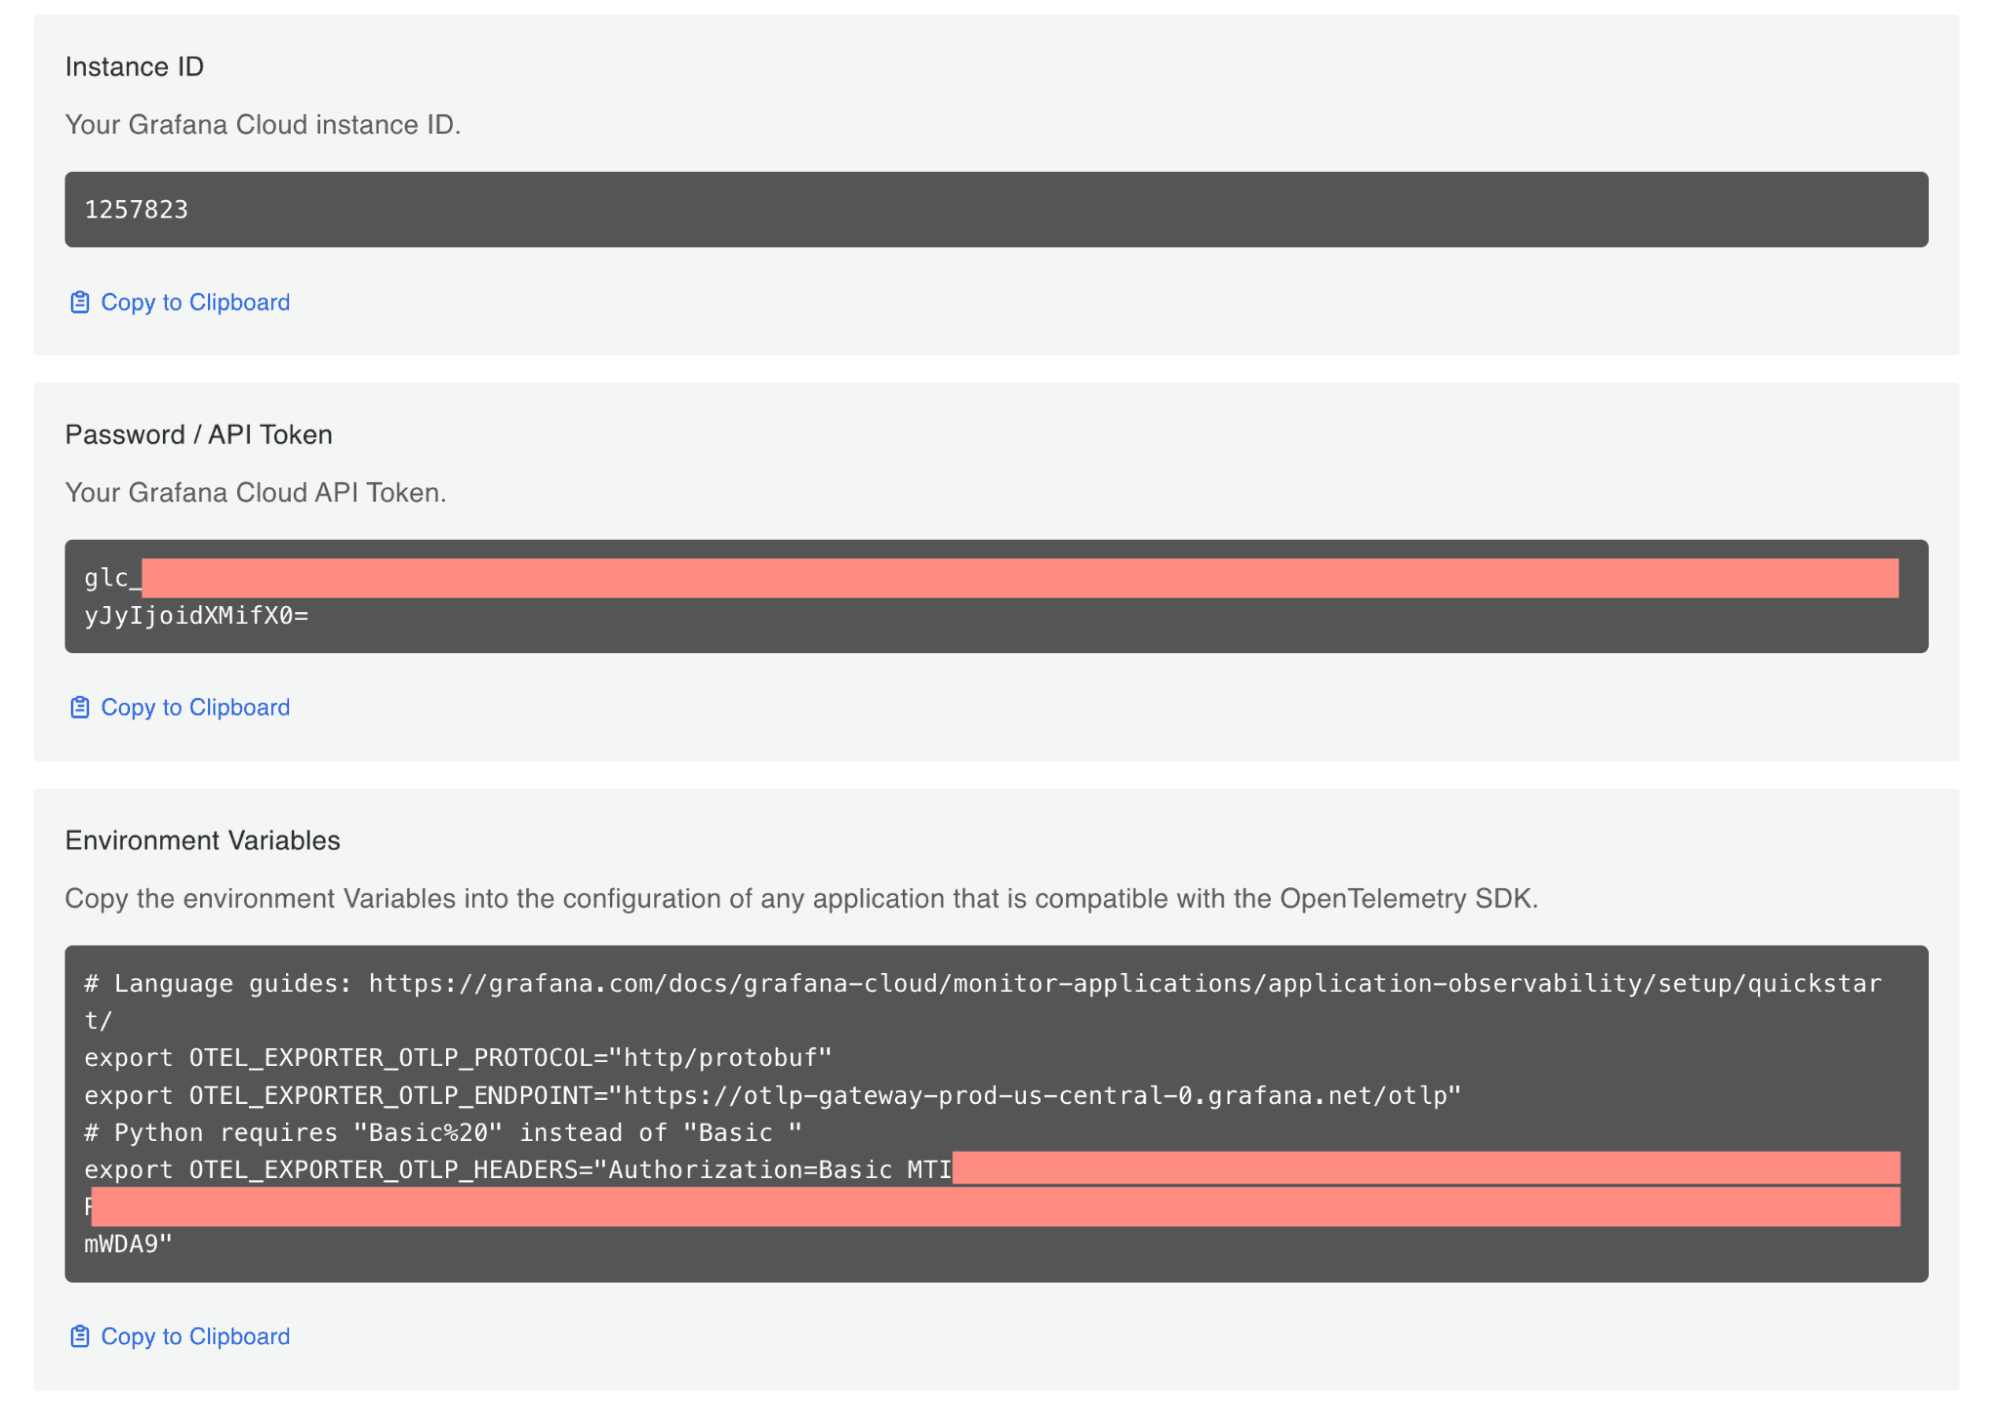
Set the following environment variables in your terminal. Make sure you use your own credentials. Other than the endpoint and credentials, we’ll also set a few properties, such as the service name, and some resource-level attributes, such as environment, namespace, and version.
export OTEL_EXPORTER_OTLP_PROTOCOL="http/protobuf"
export OTEL_EXPORTER_OTLP_ENDPOINT="https://otlp-gateway-prod-us-central-0.grafana.net/otlp"
export OTEL_EXPORTER_OTLP_HEADERS="Authorization=Basic MTI1NzgyMzpnb…"
export OTEL_SERVICE_NAME="openai-tutor-app"
export OTEL_RESOURCE_ATTRIBUTES="deployment.environment=dev,service.namespace=backend,service.version=1.0,service.instance.id=1
Running the agents
Before running the agents, we need to do some homework to set up our Python project.
1. Create and activate a virtual environment (run in your terminal):
python3 -m venv agents-env
source agents-env/bin/activate  # On Windows: agents-env\Scripts\activate
2. Install all the required packages:
pip install opentelemetry-api opentelemetry-sdk opentelemetry-exporter-otlp
pip install openinference-instrumentation-openai-agents
pip install openai-agents
3. Run the agents:
python3 openai_example.py
4. You should see something like this in your terminal:

You can see that the question “Who was the first president of the United States?" was given an answer by the history tutor, but the question “What is the meaning of life?” failed the guardrail check.
You can also clone this repo to get the complete code.
Investigating OpenAI Agents SDK traces in Grafana Cloud
Log into your Grafana Cloud environment. From the left side menu, click Drilldown → Traces and the Traces tab. Make sure you select the appropriate timeline for your traces to show up here.
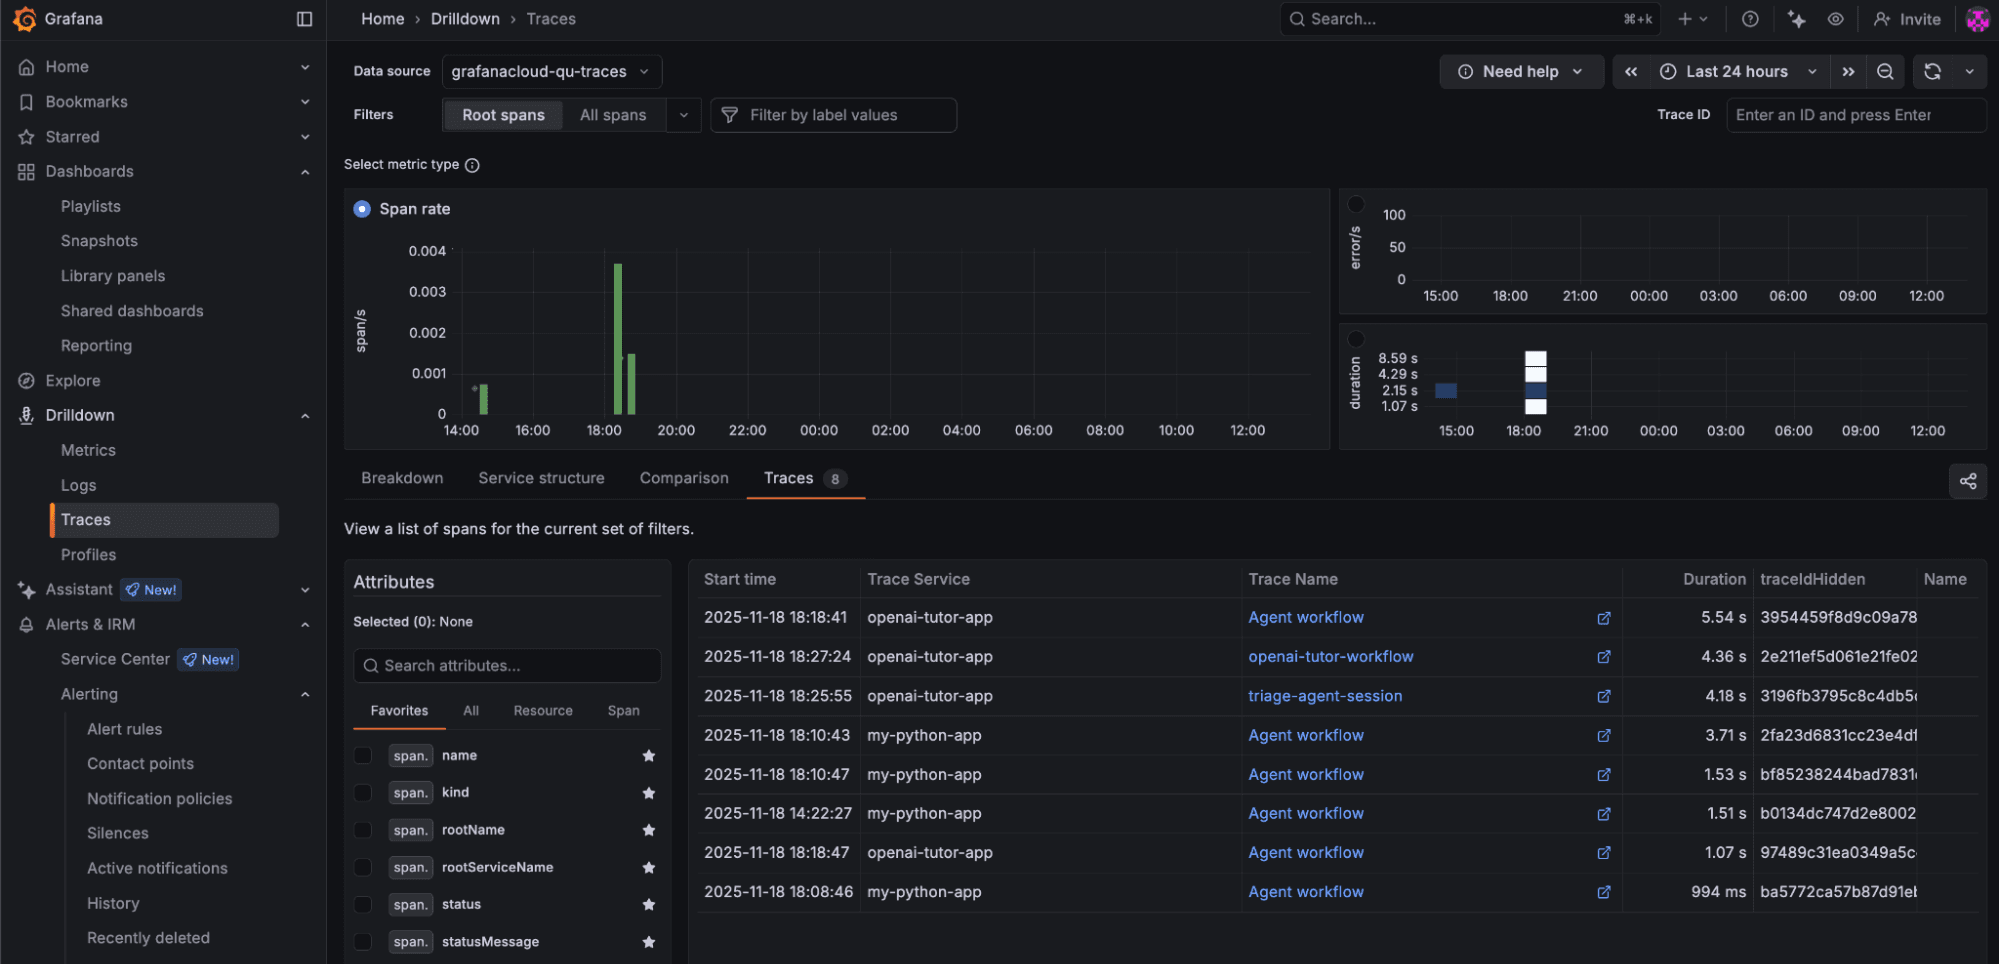
Click on a recent trace, openai-tutor-workflow, and you will see something like this:
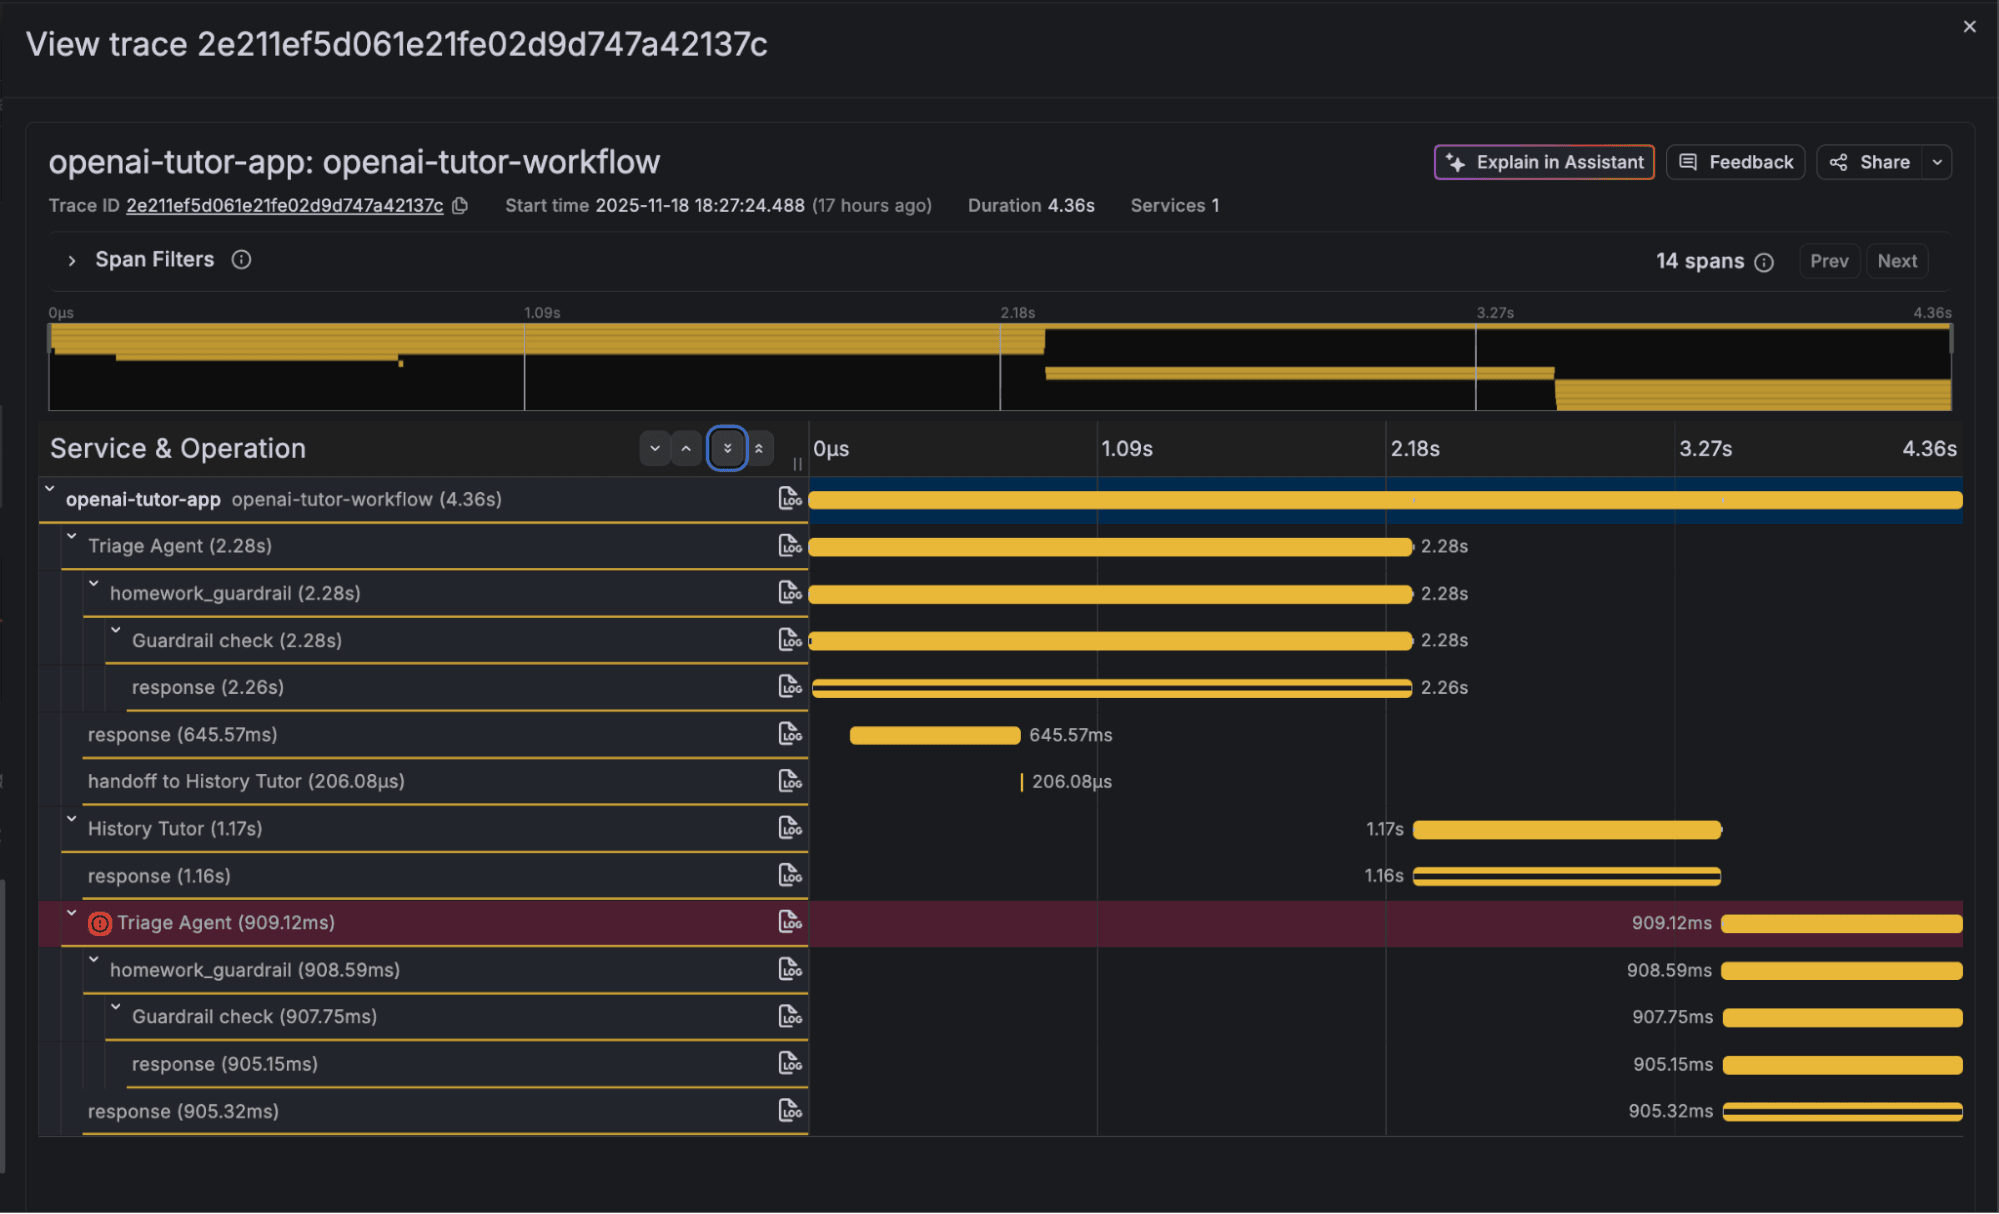
As you can see, the trace contains a set of spans with comprehensive information about the agent execution. The first agent ran for the question “Who was the first president of the United States?” and was successful, and the second agent ran for the question “What is the meaning of life?” and failed the guardrail. Expand the response part and you will see additional, more detailed information, including the LLM model.
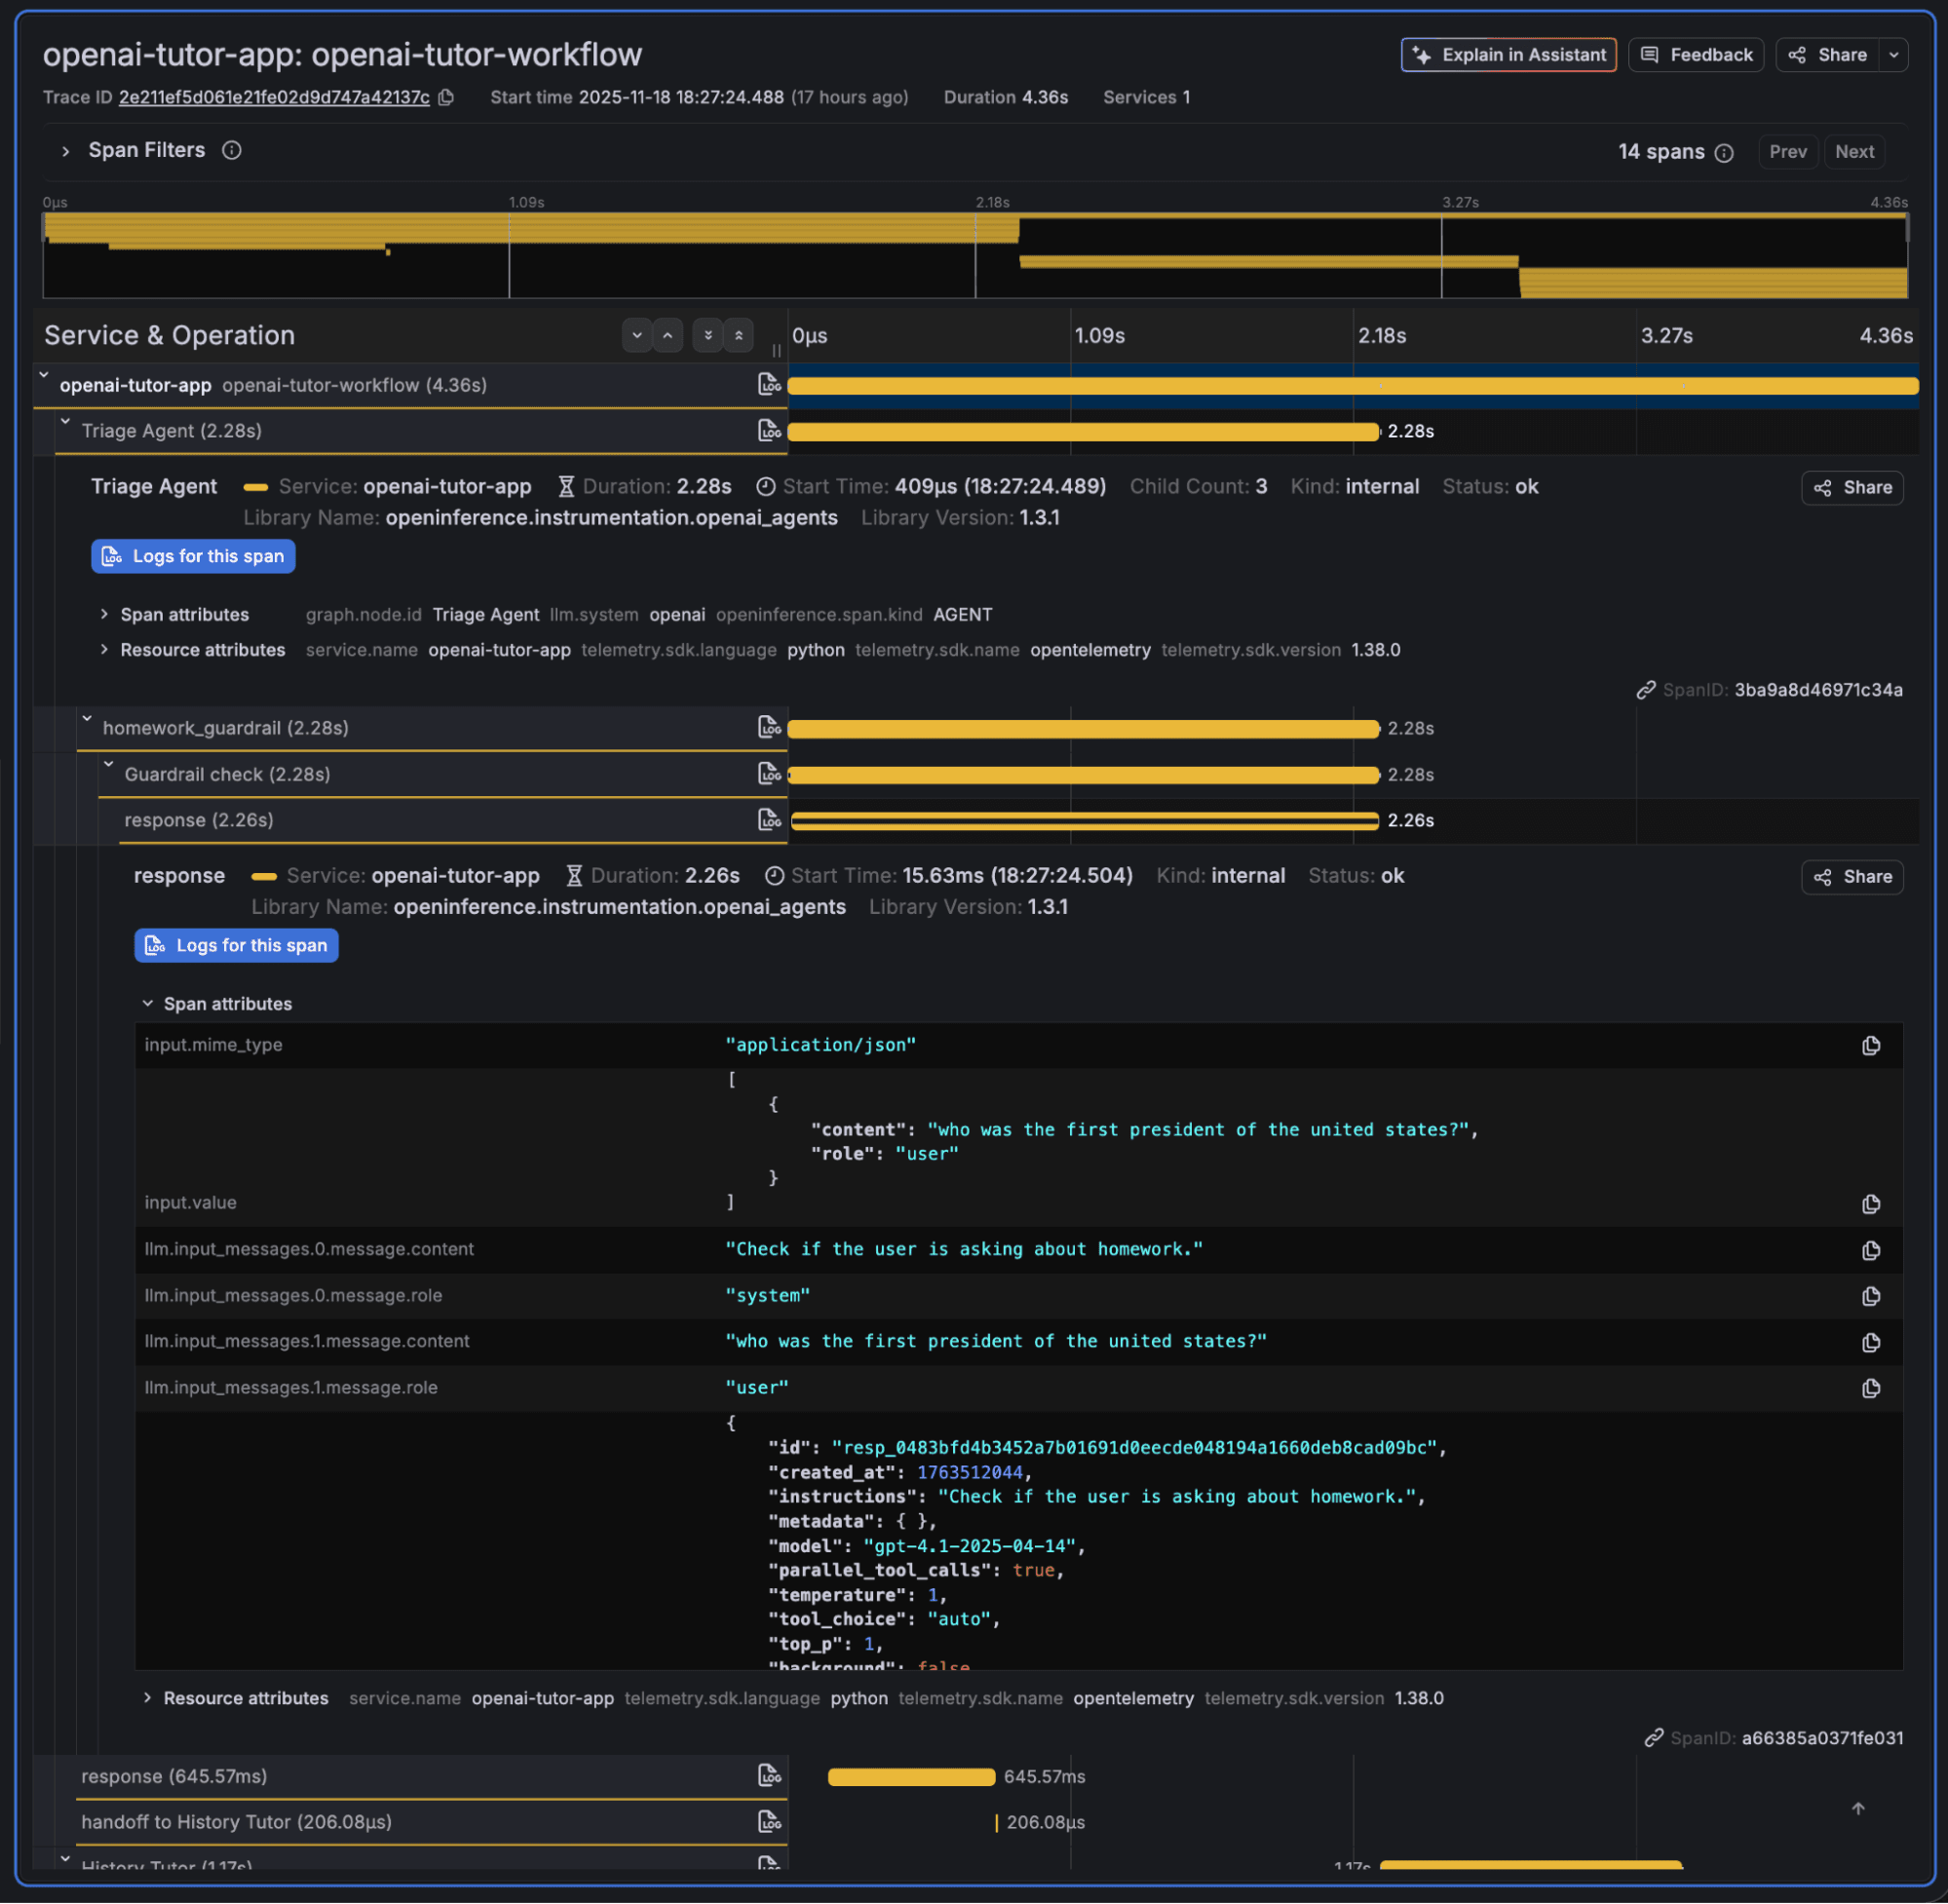
The output section contains even more comprehensive information, such as the agent reasoning results and tokens used.
{
    "id": "resp_0483bfd4b3452a7b01691d0eecde048194a1660deb8cad09bc",
    "created_at": 1763512044,
    "error": null,
    "incomplete_details": null,
    "instructions": "Check if the user is asking about homework.",
    "metadata": { },
    "model": "gpt-4.1-2025-04-14",
    "object": "response",
    "output": [
        {
            "id": "msg_0483bfd4b3452a7b01691d0eee3b248194ae1c26c621bdd789",
            "content": [
                {
                    "annotations": [ ],
                    "text": "{"is_homework": true, "reasoning": "The question is a common factual one, often asked in educational contexts like history classes, and is typical of what might be assigned as homework."}",
                    "type": "output_text",
                    "logprobs": [ ]
                }
            ],
            "role": "assistant",
            "status": "completed",
            "type": "message"
        }
    ],
    …
    "status": "completed",
    "text": {
        "format": {
            "name": "final_output",
            "schema_": {
                "properties": {
                    "is_homework": {
                        "title": "Is Homework",
                        "type": "boolean"
                    },
                    "reasoning": {
                        "title": "Reasoning",
                        "type": "string"
                    }
                },
                "required": [
                    "is_homework",
                    "reasoning"
                ],
                "title": "HomeworkOutput",
                "type": "object",
                "additionalProperties": false
            },
            "type": "json_schema",
            "description": null,
            "strict": true
        },
        "verbosity": "medium"
    },
    "top_logprobs": 0,
    "truncation": "disabled",
    "usage": {
        "input_tokens": 78,
        "input_tokens_details": {
            "cached_tokens": 0
        },
        "output_tokens": 42,
        "output_tokens_details": {
            "reasoning_tokens": 0
        },
        "total_tokens": 120
    },
    "user": null,
    "billing": {
        "payer": "developer"
    },
    "store": false
}
Rich insights with TraceQL
Once your traces are in Grafana Cloud, you can explore them using TraceQL or using Grafana Assistant, the AI-powered agent in Grafana Cloud.
Grafana Cloud Traces can also automatically generate metrics from your traces, which allows you to perform rich analysis more easily.
While I won’t cover all the details of how TraceQL works, you can essentially use this query language to:
- Query traces and spans based on resource and span attributes
- Get metrics from attributes that are numbers
Let’s take a look at a few simple examples.
1. The following query allows you to see how many times the LLM model gpt-4.1-2025-04-14 was invoked:
{.llm.model_name="gpt-4.1-2025-04-14"} | count_over_time()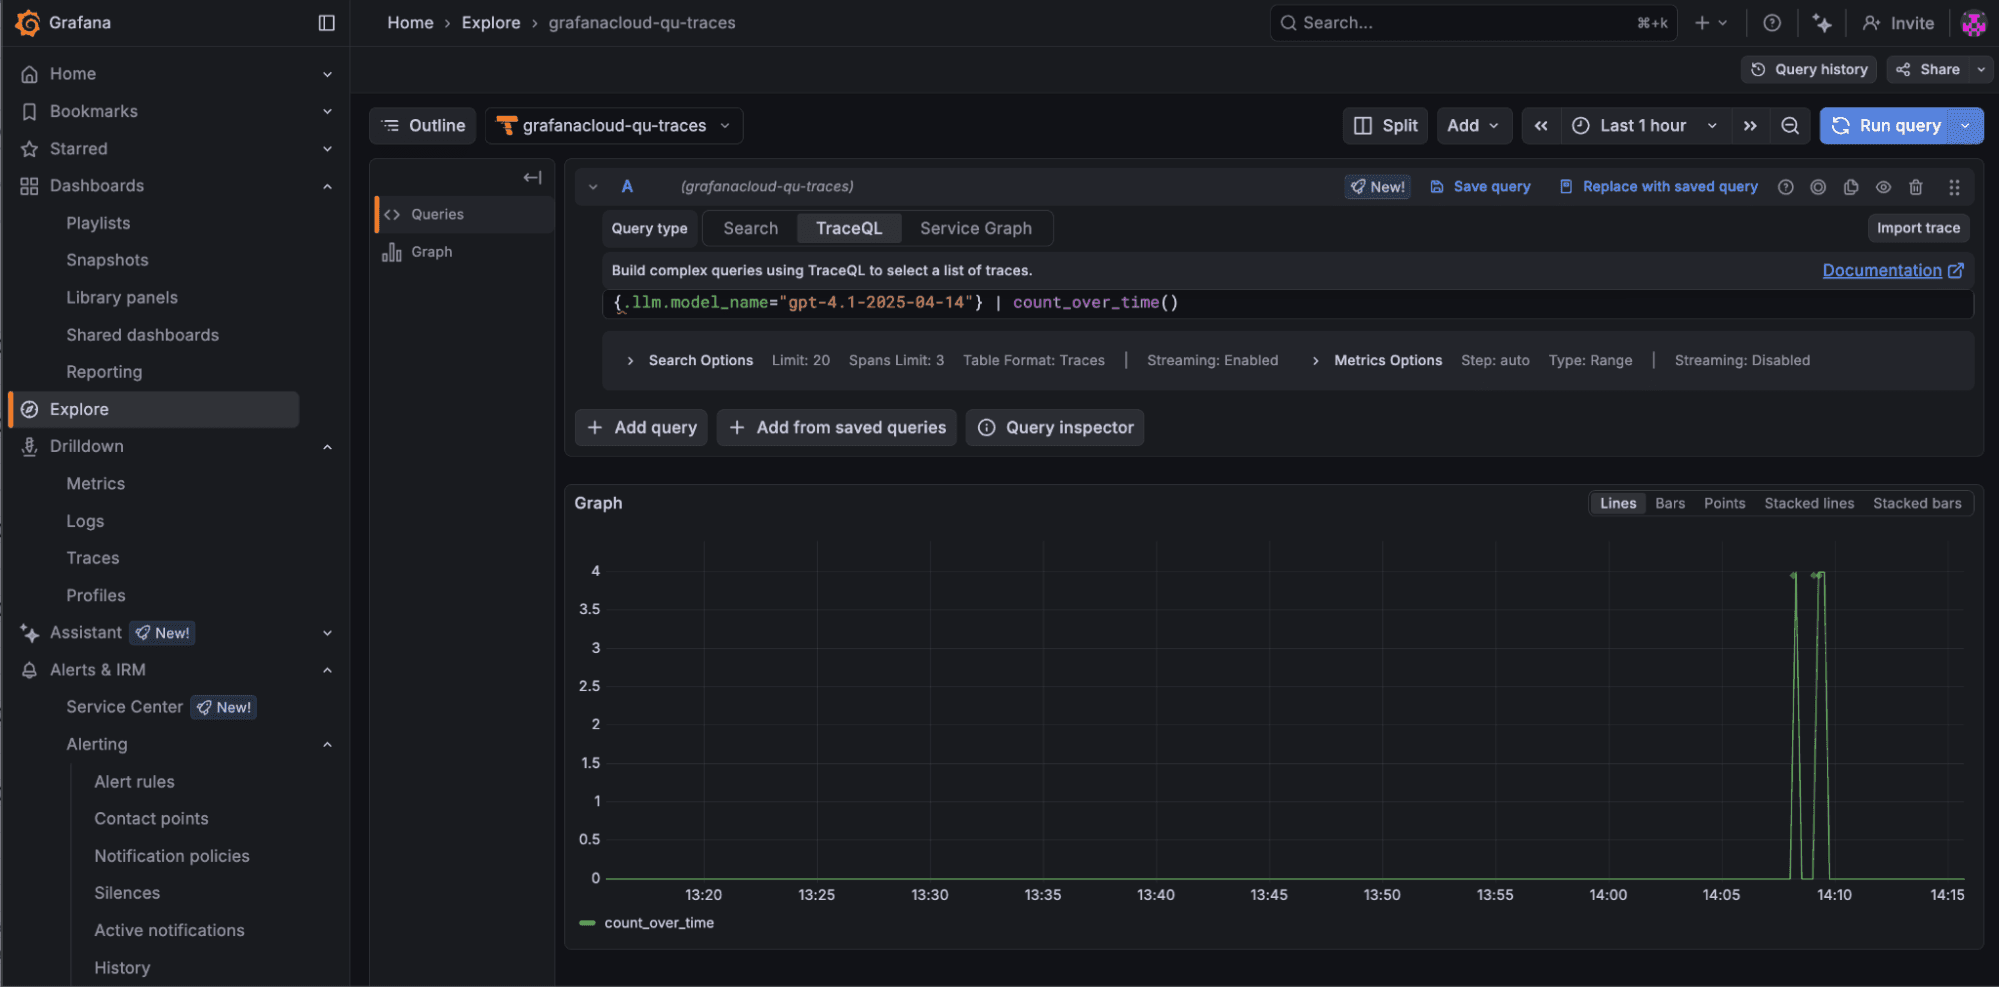
2. This query allows you to see the invocation rate of the model gpt-4.1-2025-04-14 by different agent workflows:

3. From the example trace, you can see that the response span from the history tutor agent takes the most time during the entire workflow. We could run the following query to list all the workflows that took more than 3 seconds for the history tutor agent to come up with an answer:
{name="History Tutor"} > { resource.service.name="openai-tutor-app" && name="response" && span:duration>3000}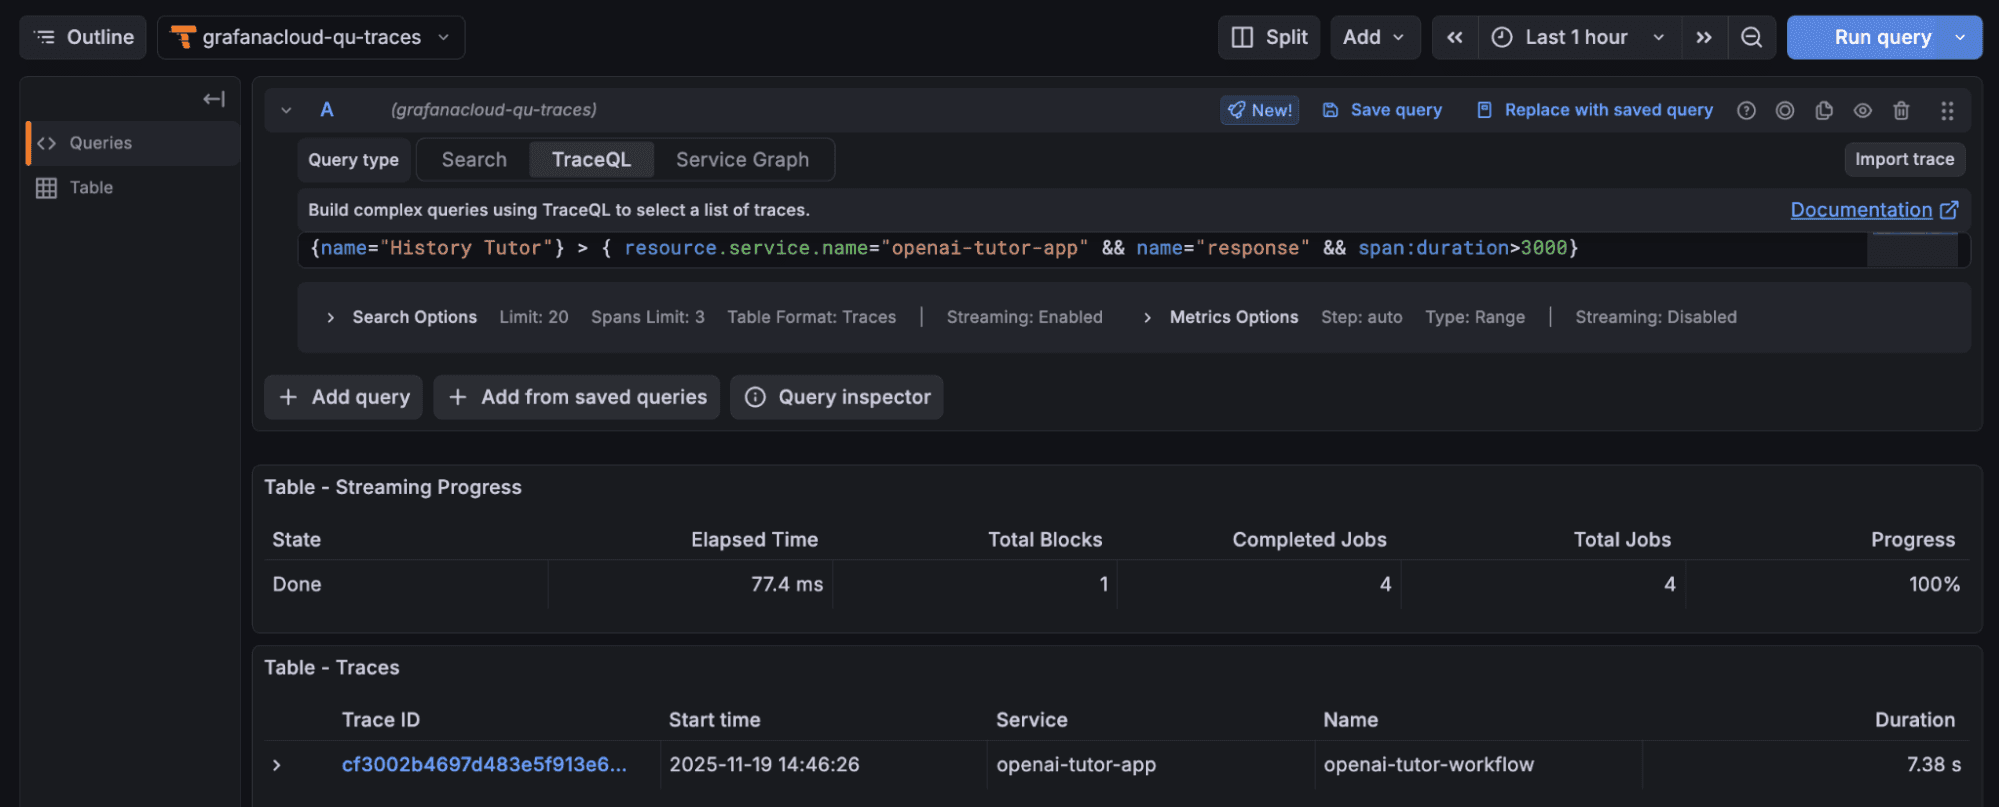
4. These two queries return the average and total number of tokens consumed by the history tutor agent for answer generation, respectively:
{name="History Tutor"} > { resource.service.name="openai-tutor-app" && name="response"} | avg_over_time(span.llm.token_count.completion){name="History Tutor"} > { resource.service.name="openai-tutor-app" && name="response"} | sum_over_time(span.llm.token_count.completion)
5. These two queries return the average and total number of tokens consumed by the history tutor from all operations (prompt, response, etc.) in the last 24 hours, respectively:
{name="History Tutor"} >> {} | avg_over_time(span.llm.token_count.total){name="History Tutor"} >> {} | sum_over_time(span.llm.token_count.total)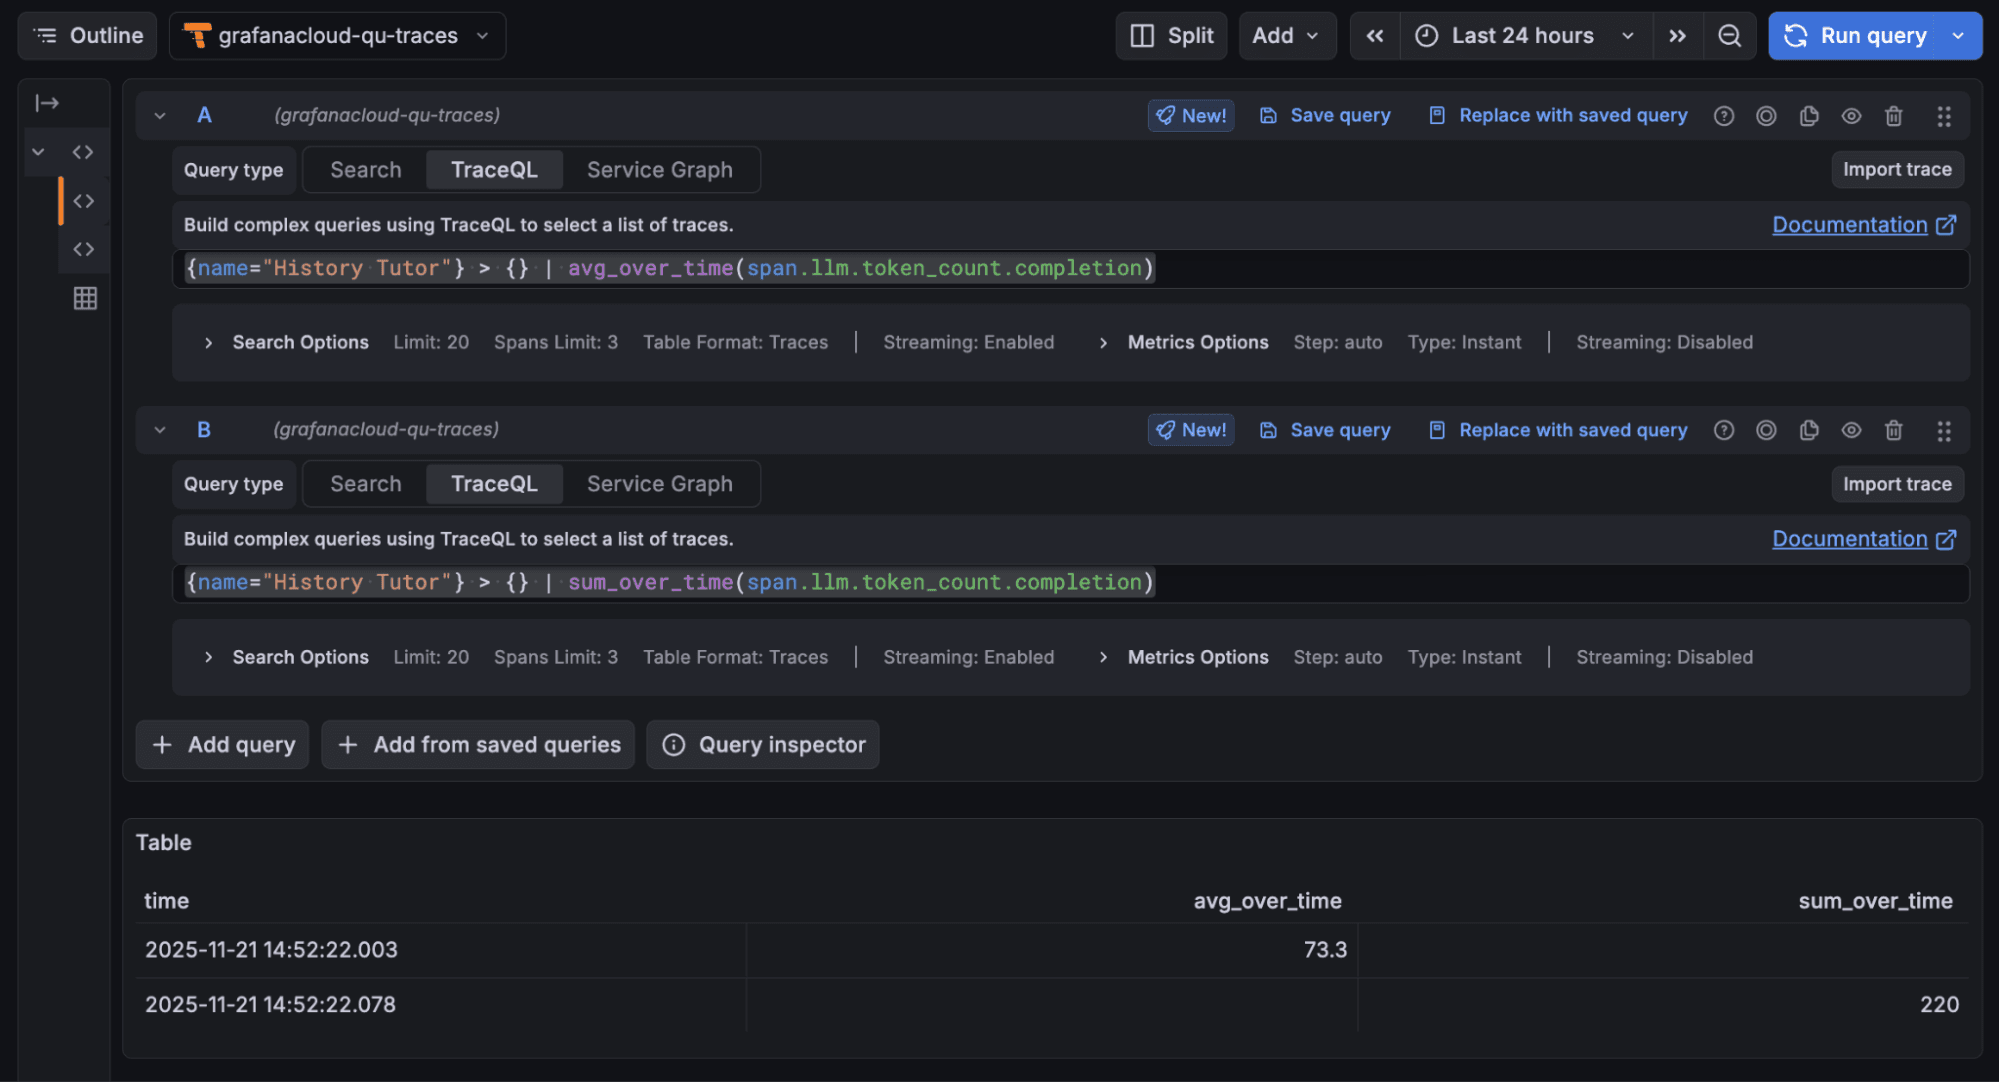
You can create Grafana Cloud dashboards to visualize all these insights as you wish. And if you aren’t familiar with TraceQL, Assistant can query these traces for you.
Wrapping up
Grafana Cloud Traces helps build off the native tracing capabilities of the OpenAI Agents SDK to enable rich analysis of agent workflows.
To learn more, please check out our Grafana Cloud Traces documentation, as well as the docs pages for OpenAI Agents SDK.
Grafana Cloud is the easiest way to get started with metrics, logs, traces, dashboards, and more. We have a generous forever-free tier and plans for every use case. Sign up for free now!

