

%3Aquality(90)%2F&w=3840&q=75)
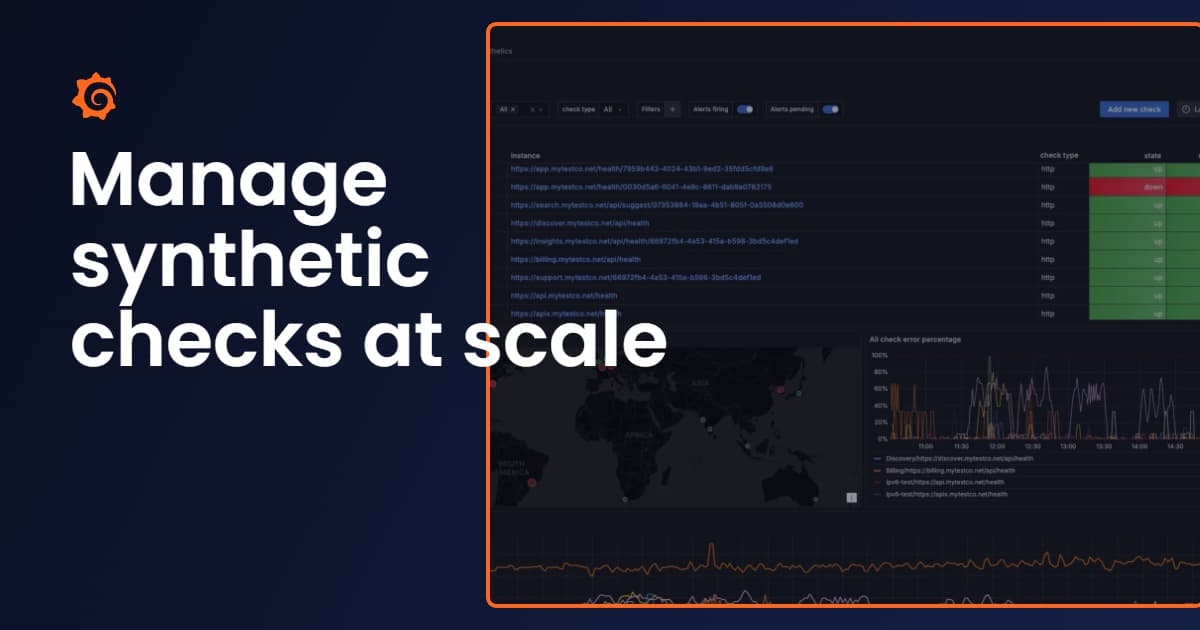
Manage synthetic checks at scale: Introducing folders in Grafana Cloud Synthetic Monitoring


As your use of Grafana Cloud Synthetic Monitoring grows, so does the number of checks you need to manage across services, environments, and teams. Eventually, a single flat list of checks becomes difficult to navigate, and even simple questions get harder to answer: Which checks belong to the payments team? Can I disable everything in staging during a maintenance window? Who should be able to edit the checks for this service?
Synthetic Monitoring folders, now generally available, help solve this challenge. You can organize checks into the same Grafana Cloud folders you already use for dashboards and alert rules, making it easier to group checks by team, service, or environment, manage multiple checks at once, and control who can edit them.
%3Aquality(90)%2F&w=3840&q=75)
The benefits of folders in Synthetic Monitoring
Grafana Cloud Synthetic Monitoring is a black box monitoring solution that lets you proactively assess system reliability and performance by running checks from probe locations around the world. You can set up different types of checks, including ping checks, browser checks, scripted checks, DNS checks, and HTTP checks, to verify system performance at various network levels.
But as your Synthetic Monitoring setup grows, the process of managing checks one at a time doesn’t scale. You could have dozens of checks for the same service, separate sets for production and staging, or hundreds of checks owned by different teams. Without a way to group them, finding the right checks, making changes across them, and keeping ownership clear all require more manual work.
Folders give you a way to manage checks in a way that aligns with how your organization already works. Group checks by team, service, environment, or another structure that makes sense for you, then use that grouping to navigate your checks, take action across them, and control access. Because Synthetic Monitoring uses standard Grafana Cloud folders, the same organizational structure you use for dashboards and alert rules can now extend to your synthetic checks.
Folders bring three key benefits to your Synthetic Monitoring setup:
- Find the checks you need faster: Browse checks grouped by folder instead of scanning a flat list, and expand only the folders you care about.
- Manage related checks as a group: Enable, disable, move, or delete every check in a folder in a single operation. This is ideal for managing checks during maintenance windows or environment cleanups.
- Give teams clearer ownership: Combine Grafana Cloud folder permissions with Synthetic Monitoring roles so each team manages the checks in their own folder.
How folders work
A Synthetic Monitoring check can live in any Grafana Cloud folder you can edit, such as your team's folder, a service folder, or anywhere else in your folder tree. When you create a check in the Synthetic Monitoring app, the default Synthetic Monitoring folder is preselected, and you can change it to any other folder by searching or browsing your folder tree. Checks created without a folder through the API or Terraform are stored in the default folder.
If a folder containing checks is deleted from Grafana Cloud, its checks are automatically moved to the default Synthetic Monitoring folder and keep running without interruption.
Assign checks to folders
When you create or edit a check, use the Folder field to select where it should live. You can also create a new folder right from the check editor.
%3Aquality(90)%2F&w=3840&q=75)
To organize existing checks, select multiple checks in the check list and use Move to folder to move them all in one operation.
%3Aquality(90)%2F&w=3840&q=75)
You can also assign checks to folders using the gcx CLI.
Browse and act on groups of checks
The check list offers a folder view in addition to the card and list views. Checks are grouped under their folders, so you can expand only what you need.
From a folder's actions, you can operate on all its checks at once:
- Enable or disable all checks in the folder (for example, to silence an entire environment during a planned maintenance window).
- Move all checks to another folder.
- Delete all checks in the folder.
- Move the folder itself to another location in your folder tree.
These actions apply to the checks you've selected in the folder or, when nothing is selected, to every check in it, including checks in nested subfolders. Deleting checks never deletes the folder itself.
%3Aquality(90)%2F&w=3840&q=75)
Manage team access with folder permissions
This is where folders go beyond organization. Folder permissions work together with Synthetic Monitoring roles, so you can control which folders each user or team can manage. For example, the payments team could have edit permissions on the payments folder, while everyone else in the org only gets view access.
For more information on how to set up access permissions, refer to our documentation.
Provision folders as code
If you manage your synthetic checks through automation, folders are supported there, too. Options include:
- Synthetic Monitoring API: checks accept a
folderUidfield on create and update. - Terraform: the
grafana_synthetic_monitoring_checkresource accepts afolder_uidattribute (Grafana Terraform provider v4.37.0 or later). Terraform remains the source of truth for the checks it manages: if someone moves a Terraform-managed check to a different folder in the UI, the nextterraform planreports the change as drift, and applying moves the check back to the folder defined in your configuration (or to the default folder, if none is set).
Wrapping up
Folders make it easier to scale your Synthetic Monitoring setup, giving you a consistent way to organize and manage checks. And because folders work across the UI, API, and Terraform, you can bring that same structure to both manual and automated workflows.
To learn more and get started, refer to our documentation for organizing checks in folders.
Grafana Cloud is the easiest way to get started with synthetic monitoring. We have a generous forever-free tier that includes 100k test executions per month and more. Sign up for free now!


