

%3Aquality(90)%2F&w=3840&q=75)

Identify anomalies, outlier detection, forecasting: How Grafana Cloud uses AI to make observability easier


Note: This blog originally published in July 2024 and was updated in August 2026 to reflect the latest AI solutions and workflows in Grafana Cloud.
Tech stacks keep getting more complicated, which means they’re also more difficult to monitor. At Grafana Labs, we’re building AI solutions to help you understand these complex systems with less toil, so you can get to answers faster when something looks off.
A big part of that is helping you catch anomalies earlier and pinpoint root causes, without needing to be an expert in every query language. In this post, we’ll explore a few of the AI-powered capabilities in Grafana Cloud designed to do just that, from forecasting and outlier detection to easier data exploration and incident response with Grafana Assistant, Watchers, and Investigations.
Find anomalies: Agentic alerting, forecasting, and outlier detection
There are lots of ways AI can help you spot potential issues earlier in Grafana Cloud. Here are a few capabilities that help you identify when your system deviates from what’s expected, whether that’s against your own definition of “normal,” against historical patterns, or compared with similar services and instances.
Agentic alerting for your systems: Assistant Watchers
What if you know what you want to keep an eye on, but you don’t know exactly which metrics or thresholds to alert on?
That’s why we built Assistant Watchers. A capability of Grafana Assistant, the AI-powered agent in Grafana Cloud (more on that below), Watchers are always-on agents that check a scoped slice of your telemetry on a schedule. You describe what “normal” looks like in your own words—the service, the failure mode, the noise that’s expected during a deployment. Assistant Watchers calibrates concrete checks against your metrics and logs, then raises concern when a run finds something notable.
For example, let’s say you deployed a new service and have some telemetry, but you aren’t sure what to alert on yet. You can use a watcher to monitor the service and tune what “normal” looks like as you go.
%3Aquality(90)%2F&w=3840&q=75)
A watcher can stay quiet when signals look healthy, notify via Slack or a webhook when it flags a warning, and launch Assistant Investigations (again, more on that below) for critical findings. Use Watchers for recurring service health checks, noisy-but-important failure modes, and follow-up monitoring after an incident or deployment.
Forecasting and outlier detection
When you already know which metrics matter, forecasting and outlier detection features in Grafana Cloud give you more targeted ways to identify unusual behavior. These tried-and-true approaches learn what to expect from your metrics over time or across groups of similar services, so you can detect deviations without relying solely on static thresholds.
With forecasting, for example, you learn from the historical performance of a time series and predict current and future values. Instead of tuning static thresholds, you can alert when a metric is out of bounds. Forecasting also captures daily and weekly seasonality, which helps with peak vs. off-peak hours, capacity planning, and autoscaling.
For example, many services have cyclical trends in traffic (e.g., lower at night or on the weekends, and higher during the weekday). Forecasting can help you alert when traffic is abnormally high or low based on those trends, rather than against a static threshold.
%3Aquality(90)%2F&w=3840&q=75)
With outlier detection, you monitor a group of similar services or instances and identify when one member isn’t performing like the rest—the memory leak, the noisy neighbor, the replica that fell behind. For example, you can detect when one or more pods’ memory keeps climbing while the rest of the deployment is flat.
%3Aquality(90)%2F&w=3840&q=75)
To learn more, refer to our outlier detection documentation and forecasting tutorial.
Observability, simplified: natural-language searches and automated investigations
Querying telemetry can be difficult. You need to understand both your data and the query language before you can start making sense of your metrics, logs, traces, and profiles. Beyond Watchers, Grafana Assistant can take on some of that complexity for you. Here are two examples, whether you want help exploring your data or an agent to investigate an issue on your behalf.
Explore your data in natural language: Grafana Assistant
Grafana Assistant lets you interact with your data through natural language. You can ask it to write a query, explain a panel, build a dashboard, or walk you through what’s on the page. Because Assistant understands the context of your specific environment, you can use it for broad questions or more specific, focused exploration without worrying about what the underlying tool or query language is. Just give the intent and Assistant does the rest.
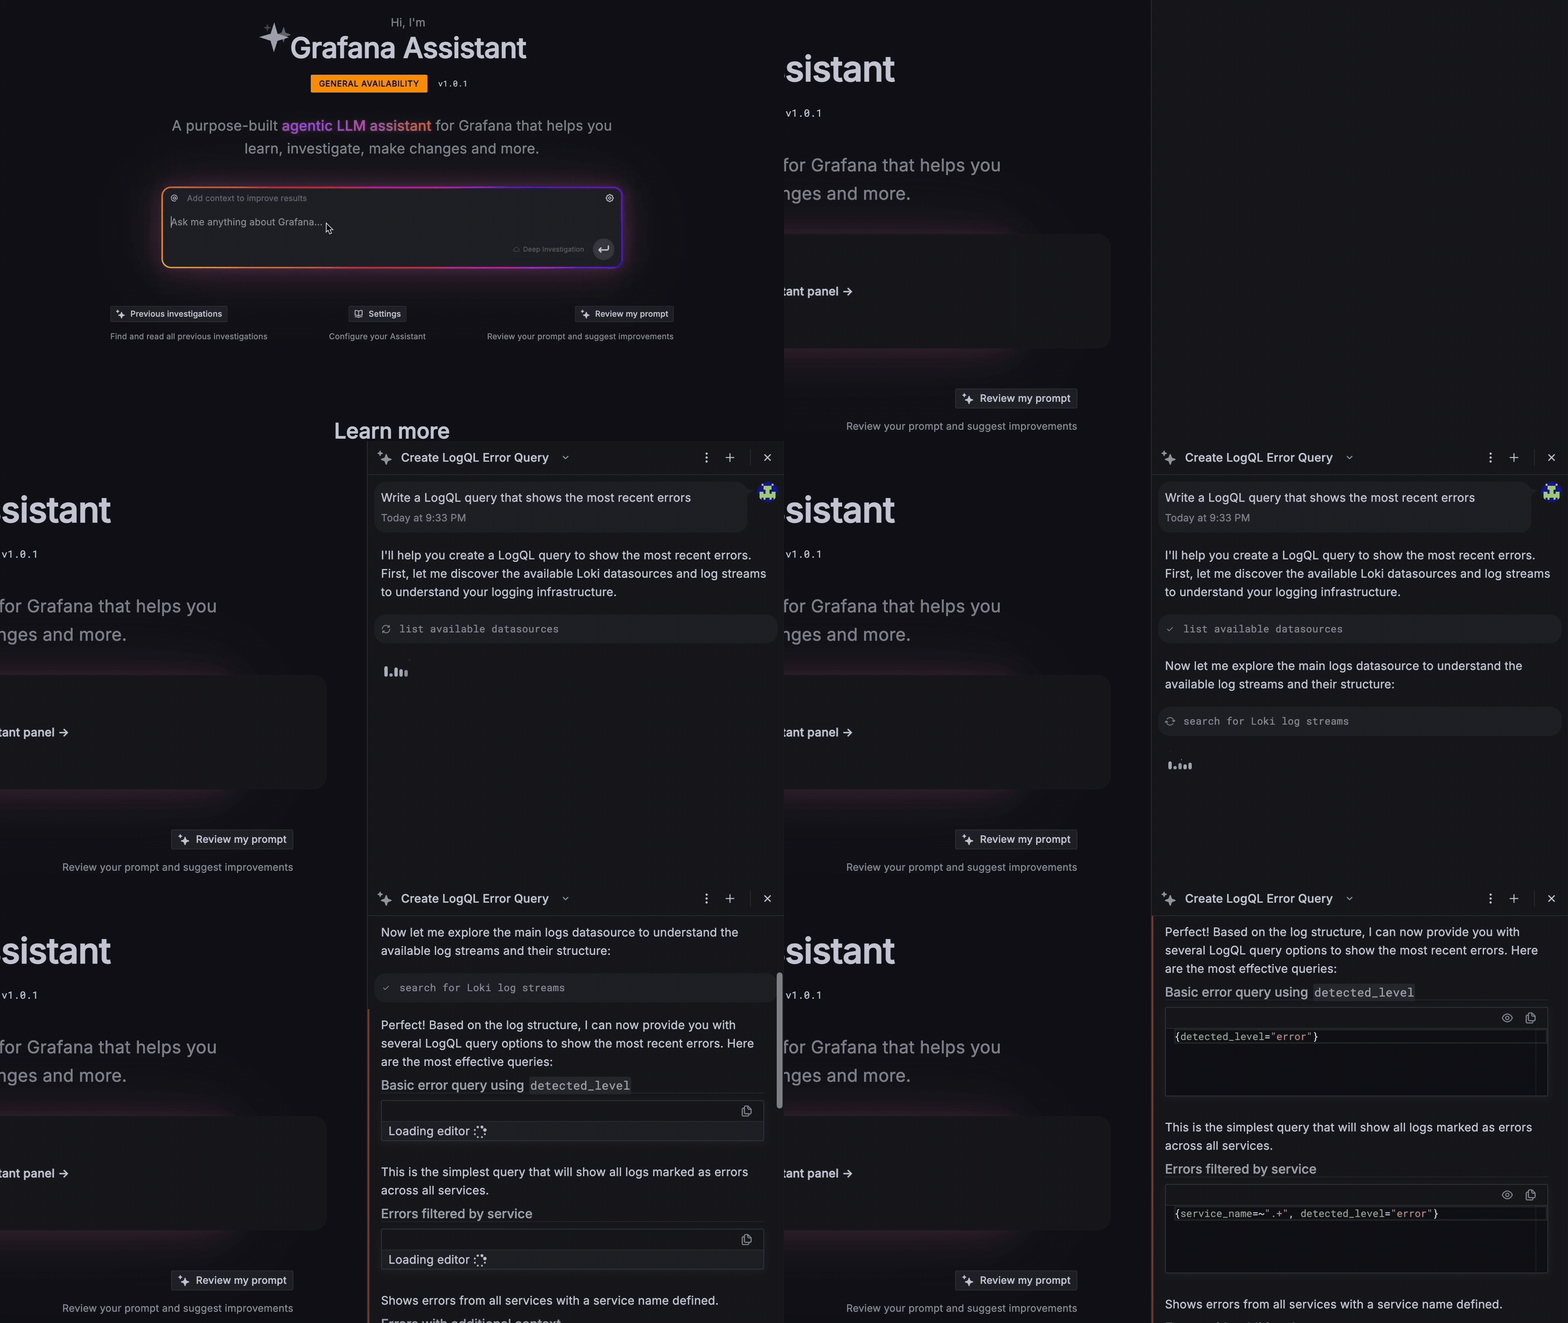
Use Assistant from the sidebar while you stay on a dashboard, or open Workspace when you want a full-page view with chat, context, and visualizations side by side.
You can try Assistant in the public Grafana Play sandbox at play.grafana.com—no install, no account, and no setup required. When you’re ready to use it on your own stack, enable it in Grafana Cloud. Assistant is also accessible via self-managed Grafana environments, starting with Grafana 13.
Automated root cause analysis: Assistant Investigations
Once you’ve identified an anomaly, the next question is why it happened. You can use Grafana Assistant to investigate via chat, but what if that analysis could already be underway by the time the pager rings? That’s where Assistant Investigations comes in, helping you automatically discover incidents and find root causes faster.
Investigations runs longer, prompt-driven analyses across metrics, logs, traces, and profiles within your Grafana Cloud stack. It builds and tests hypotheses, then produces a structured report with findings, evidence, and recommended next steps for incident response.
%3Aquality(90)%2F&w=3840&q=75)
Assistant Investigations lives in Assistant Workspaces. You can start from chat, and share the investigation with your team. You can also configure IRM and alert webhooks so investigations launch automatically when an alert group is created or an incident is updated.
Go further with AI in Grafana Cloud
Forecasting, outlier detection, Watchers, and Assistant are just a few of the ways we’re using AI to make observability easier. Grafana Cloud includes a growing set of AI capabilities that can help you automate recurring work, observe your own AI applications, and bring Assistant into more of the tools you already use.
Here are a few more ways to put AI to work:
- Automate recurring work with Automations: Save Assistant prompts and run them on demand or on a schedule for workflows like daily digests and recurring checks.
- Use Assistant where you already work: Bring Assistant into the tools and workflows you already use everyday, including Slack, Microsoft Teams, an API, or the CLI.
- Connect AI agents to Grafana with gcx and MCP server: Give your AI agents structured access to your Grafana instance and let them interact with your telemetry data.
- Observe your own AI agents with Agent Observability: Monitor the AI agents you run in production, including their performance, cost, and quality.
To learn more, check our Assistant docs, our AI tools docs, and our AI blog posts.
Grafana Assistant is the easiest way to get started with metrics, logs, traces, dashboards, and more in Grafana Cloud. We have a generous forever-free tier and plans for every use case. Sign up for free now!
%3Aquality(90)%2F&w=3840&q=75)


